| Param | Original file | Final file |
|---|---|---|
| Filename | modeM0/AS1A04_067T01_9000001926_13084cztM0_level2.evt | modeM0/AS1A04_067T01_9000001926_13084cztM0_level2_quad_clean.evt |
| Size (bytes) | 574,073,280 | 96,917,760 |
| Size | 547.5 MB | 92.4 MB |
| Events in quadrant A | 3,194,215 | 636,477 |
| Events in quadrant B | 6,277,435 | 614,251 |
| Events in quadrant C | 3,988,625 | 630,031 |
| Events in quadrant D | 3,483,259 | 598,945 |
| Mode M9 | |||
|---|---|---|---|
| Quadrant | BADHDUFLAG | Total packets | Discarded packets |
| A | 0 | 17 | 0 |
| B | 0 | 17 | 0 |
| C | 0 | 17 | 0 |
| D | 0 | 18 | 0 |
| Mode SS | |||
|---|---|---|---|
| Quadrant | BADHDUFLAG | Total packets | Discarded packets |
| A | 0 | 132 | 0 |
| B | 0 | 132 | 0 |
| C | 0 | 132 | 0 |
| D | 0 | 132 | 0 |
| Mode M0 | |||
|---|---|---|---|
| Quadrant | BADHDUFLAG | Total packets | Discarded packets |
| A | 0 | 13658 | 3 |
| B | 0 | 23006 | 2 |
| C | 0 | 16186 | 2 |
| D | 0 | 14871 | 2 |
| Quadrant | Total seconds | Saturated seconds | Saturation percentage |
|---|---|---|---|
| A | 6527 | 31 | 0.474950% |
| B | 6527 | 1200 | 18.385169% |
| C | 6527 | 157 | 2.405393% |
| D | 6527 | 93 | 1.424851% |
Noise dominated data is calculated using 1-second bins in cleaned event files. If a bin has >2000 counts, and if more than 50% of those come from <1% of pixels, then it is considered to be noise-dominated and hence unusable.
| Quadrant | # 1 sec bins | Bins with >0 counts | Bins with >2000 counts | High rate bins dominated by noise | Noise dominated (total time) | Noise dominated (detector-on time) | Marked lightcurve |
|---|---|---|---|---|---|---|---|
| A | 7854 | 6529 | 15 | 15 | 0.19% | 0.23% | 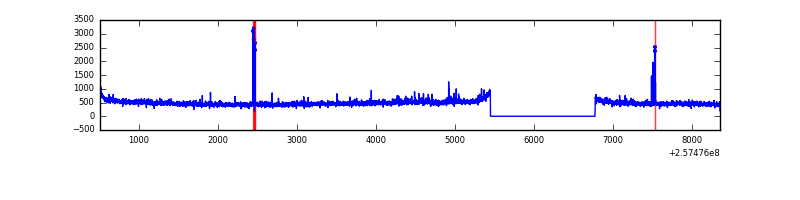 |
| B | 7854 | 6529 | 808 | 808 | 10.29% | 12.38% | 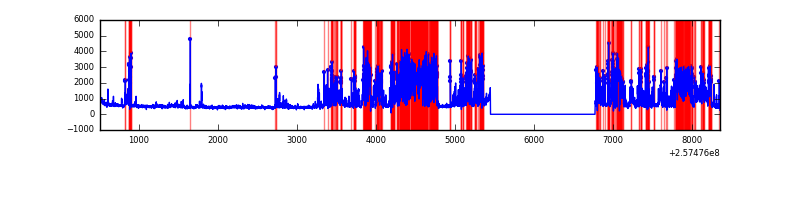 |
| C | 7854 | 6529 | 142 | 142 | 1.81% | 2.17% | 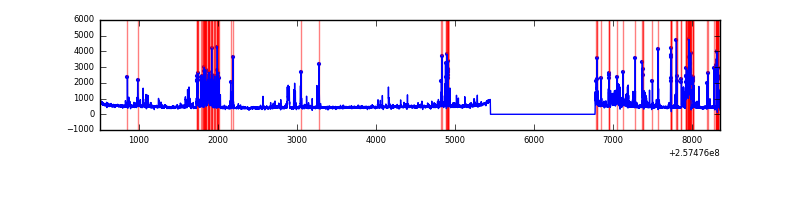 |
| D | 7854 | 6529 | 66 | 66 | 0.84% | 1.01% | 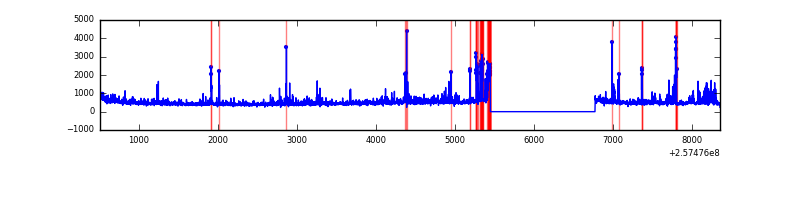 |
Top three noisy pixels from each quadrant. If the there are fewer than three noisy pixels in the level2.evt file, extra rows are filled as -1
| Pixel properties | Quadrant properties | ||||||
|---|---|---|---|---|---|---|---|
| Quadrant | DetID | PixID | Counts | Sigma | Mean | Median | Sigma |
| A | 9 | 143 | 61944 | 388.01 | 793 | 778 | 157.6 |
| A | 12 | 189 | 59265 | 371.01 | 793 | 778 | 157.6 |
| A | 1 | 162 | 16749 | 101.31 | 793 | 778 | 157.6 |
| B | 0 | 85 | 2045662 | 14996.6 | 727 | 711 | 136.4 |
| B | 4 | 239 | 1076132 | 7886.58 | 727 | 711 | 136.4 |
| B | 3 | 64 | 146115 | 1066.32 | 727 | 711 | 136.4 |
| C | 15 | 208 | 1006467 | 5783.95 | 762 | 766 | 173.9 |
| C | 0 | 207 | 5854 | 29.26 | 762 | 766 | 173.9 |
| C | 13 | 61 | 5597 | 27.78 | 762 | 766 | 173.9 |
| D | 1 | 52 | 451130 | 2533.99 | 752 | 732 | 177.7 |
| D | 10 | 157 | 127088 | 710.89 | 752 | 732 | 177.7 |
| D | 2 | 234 | 23705 | 129.25 | 752 | 732 | 177.7 |
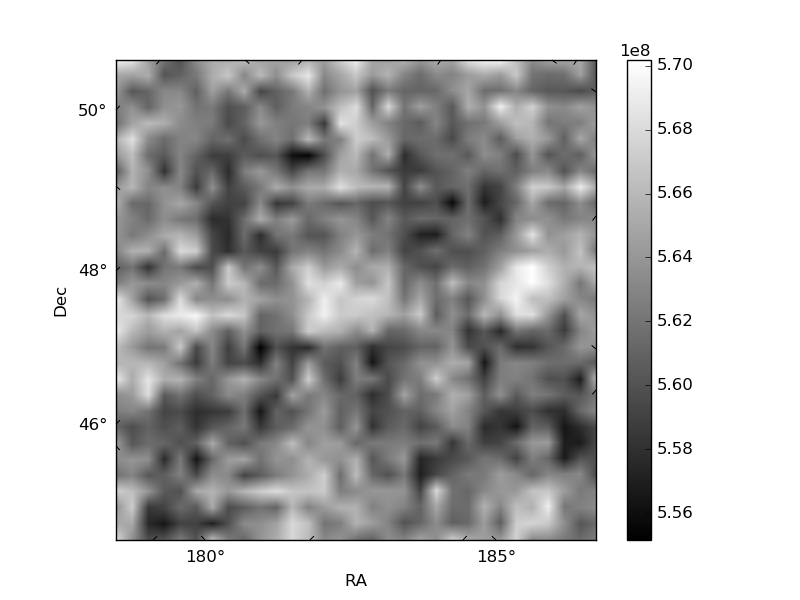
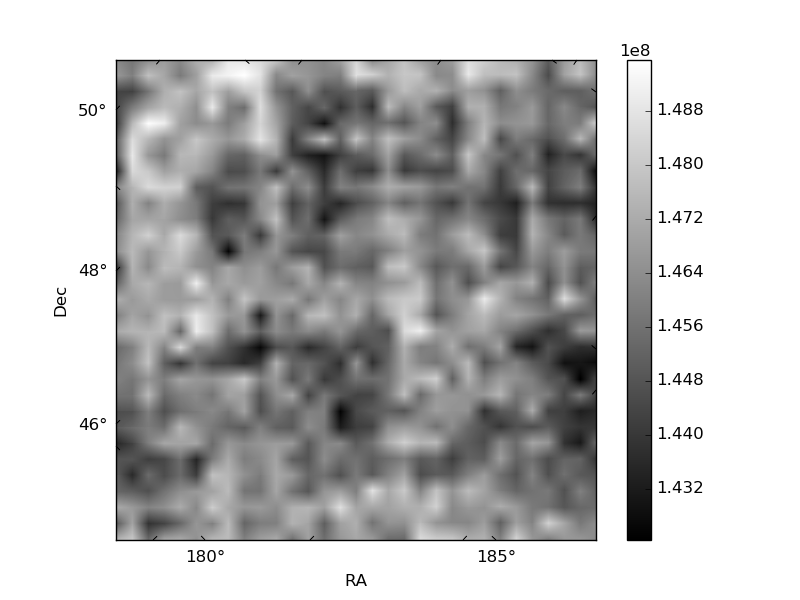
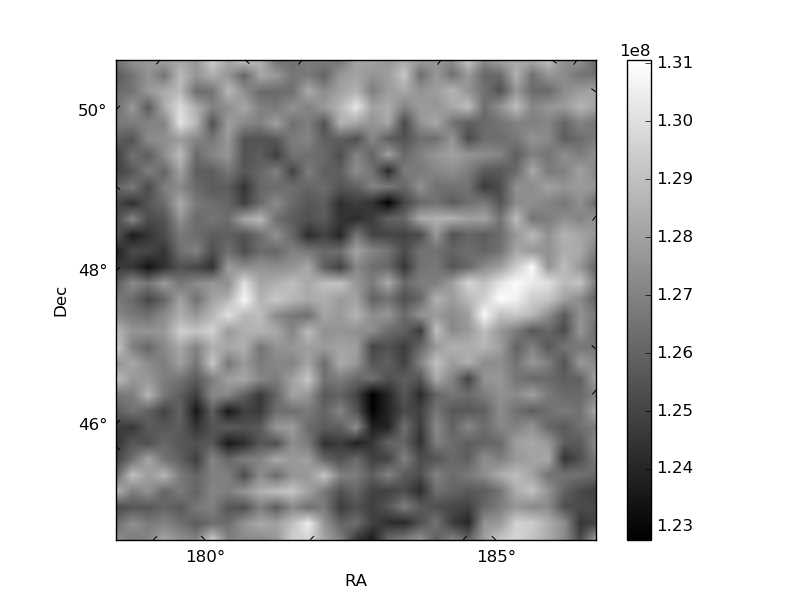
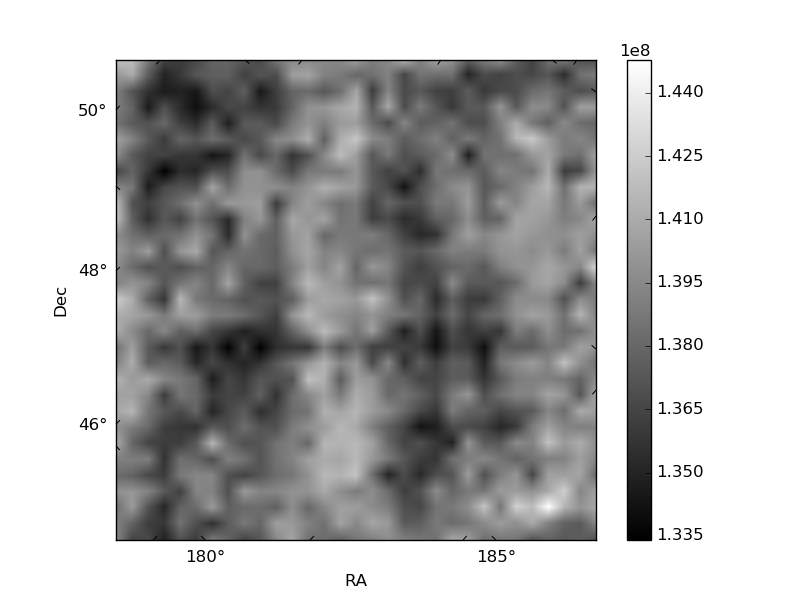
Histogram calculated using DETX and DETY for each event in the final _common_clean file
| Quadrant A | 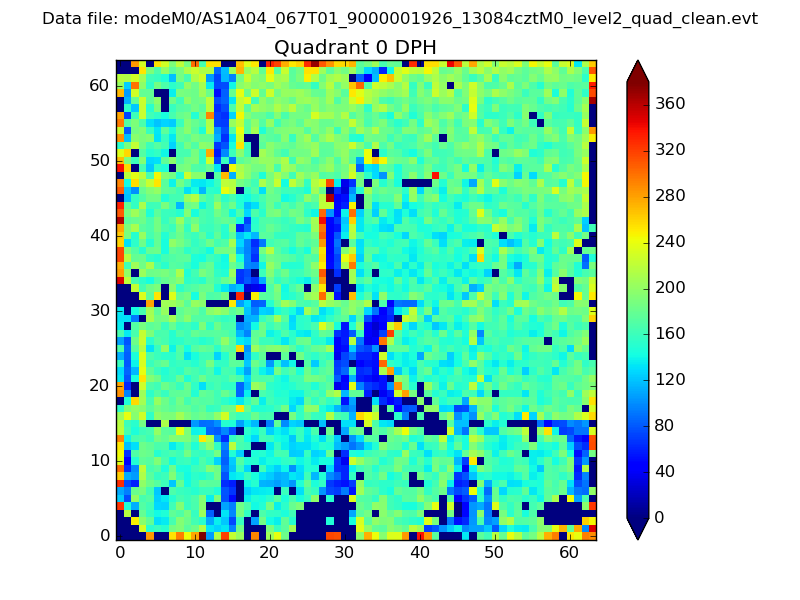 |
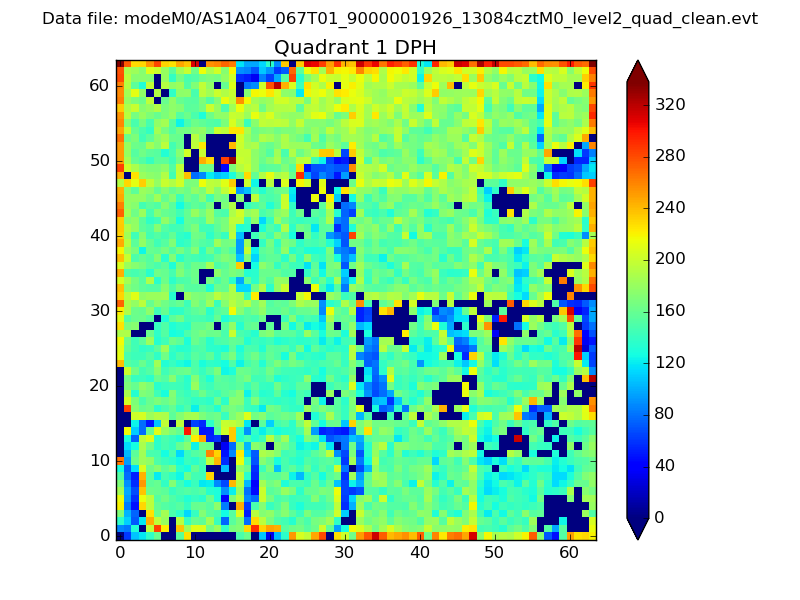 |
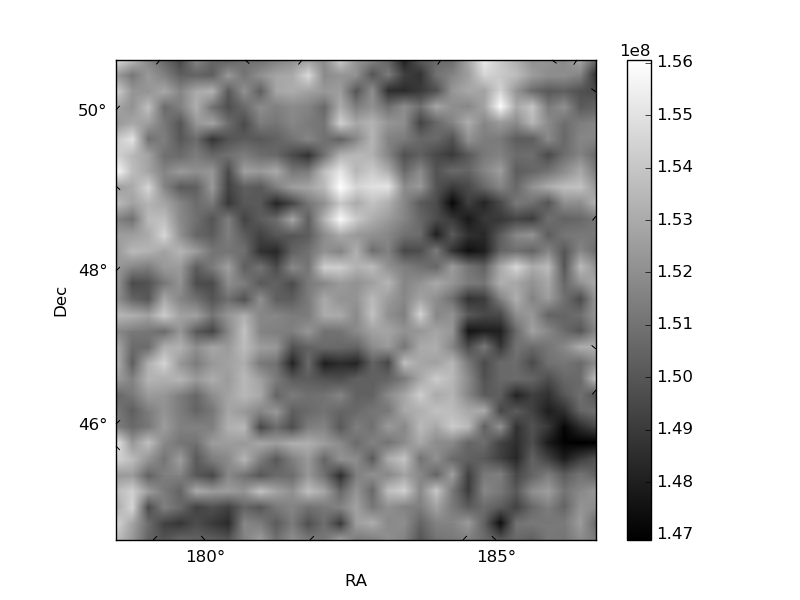
Quadrant B |
|---|---|---|---|
| Quadrant D | 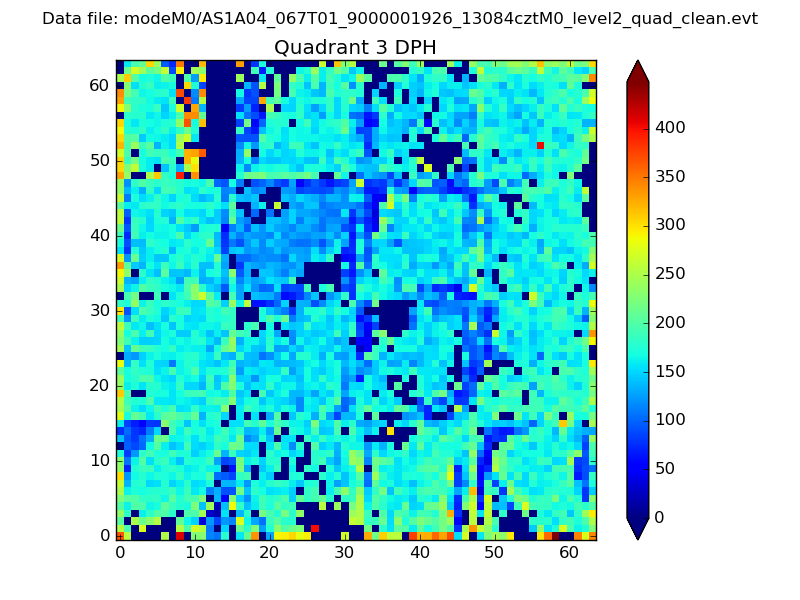 |
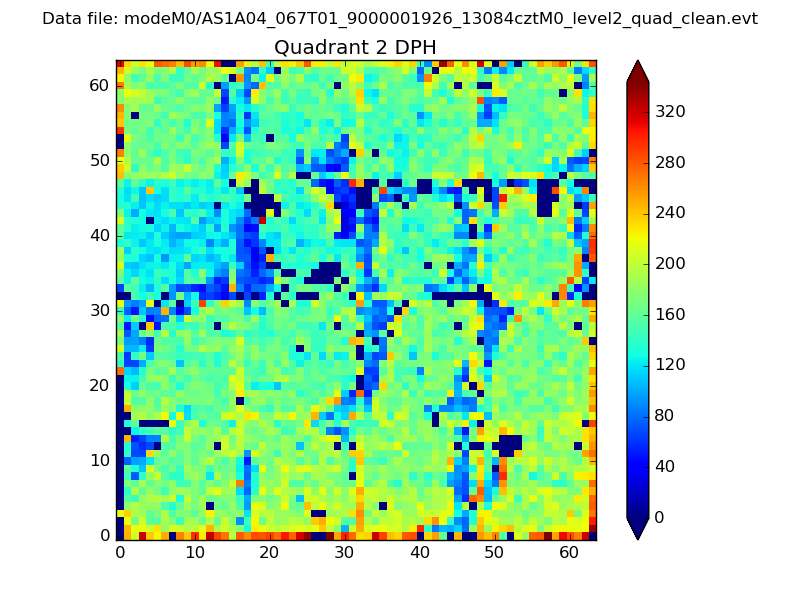 |
Quadrant C |
| Plot type | Count rate plots | Images |
|---|---|---|
| Comparison with Poisson distribution Blue bars denote a histogram of data divided into 1 sec bins. Red curve is a Poisson curve with rate = median count rate of data. |
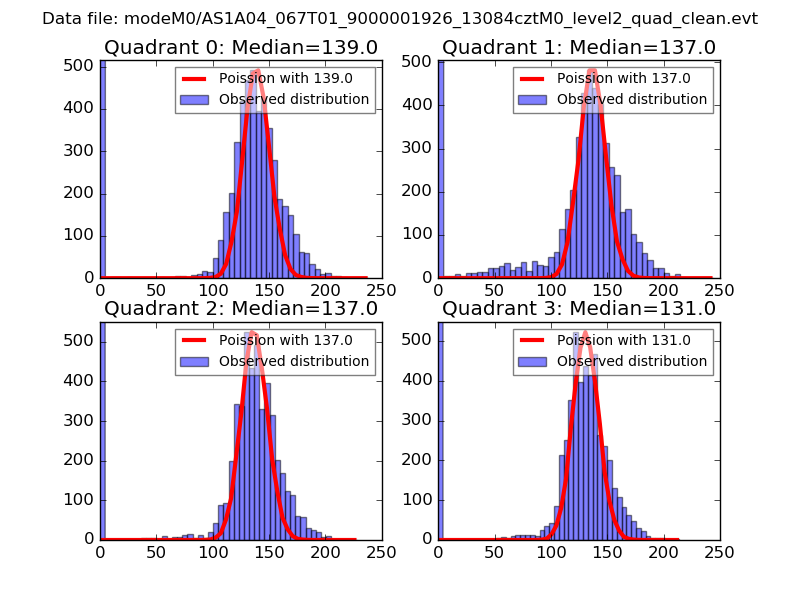 |
 |
| Quadrant-wise count rates Data is divided into 100 sec bins |
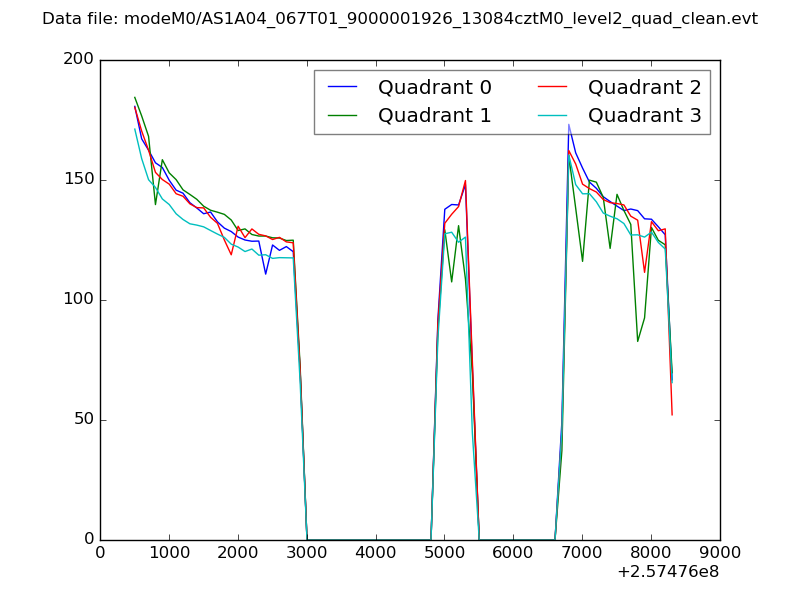 |
|
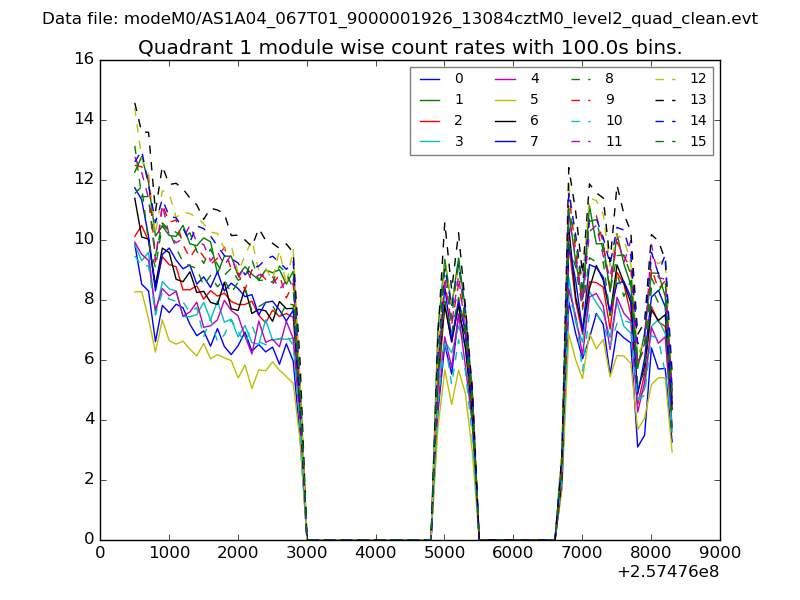
| Module-wise count rates for Quadrant A Data is divided into 100 sec bins |
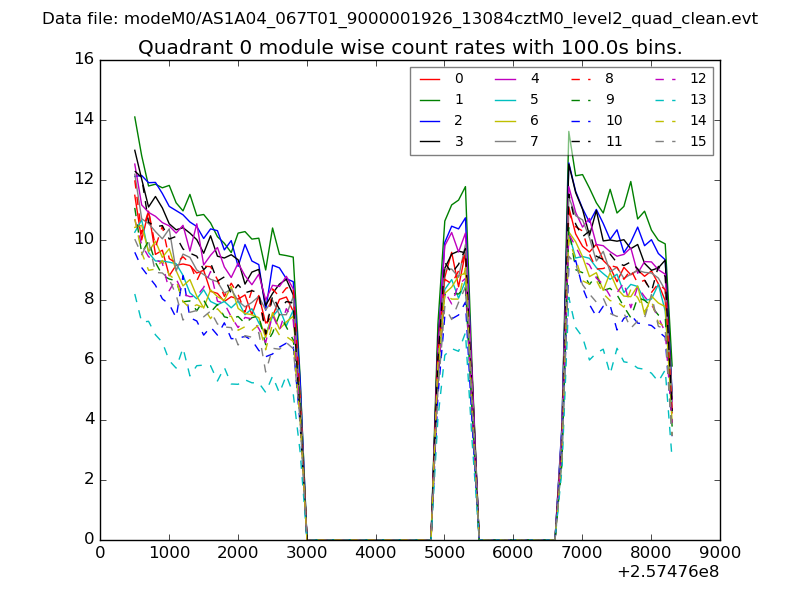 |
 |
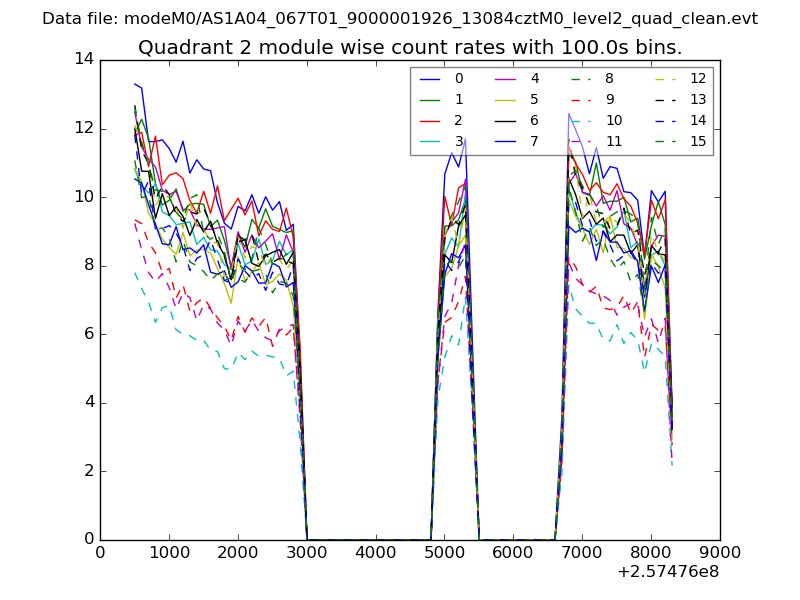
| Module-wise count rates for Quadrant B Data is divided into 100 sec bins |
 |
 |
| Module-wise count rates for Quadrant C Data is divided into 100 sec bins |
 |
 |
| Module-wise count rates for Quadrant D Data is divided into 100 sec bins |
 |
 |
| Parameter | Plot |
|---|---|
| CZT HV Monitor | 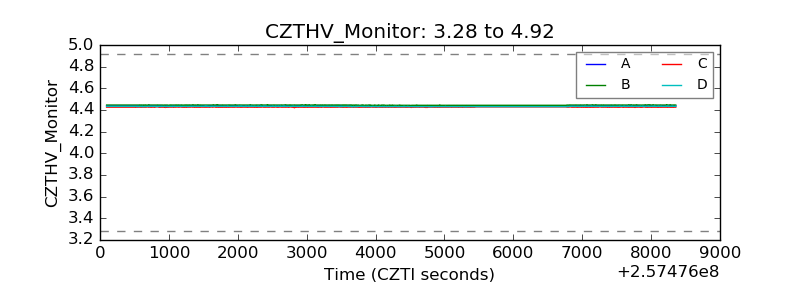 |
| D_VDD | 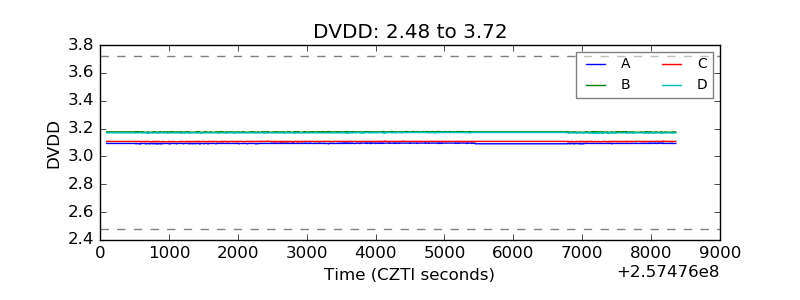 |
| Temperature 1 |  |
| Veto HV Monitor | 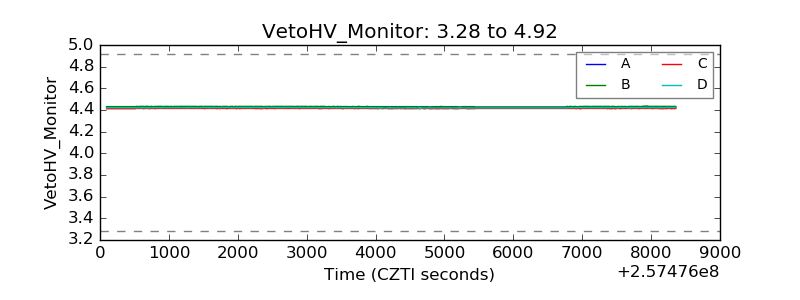 |
| Veto LLD | 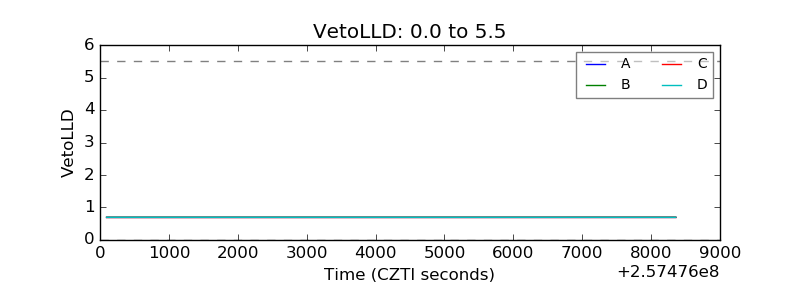 |
| Alpha Counter | 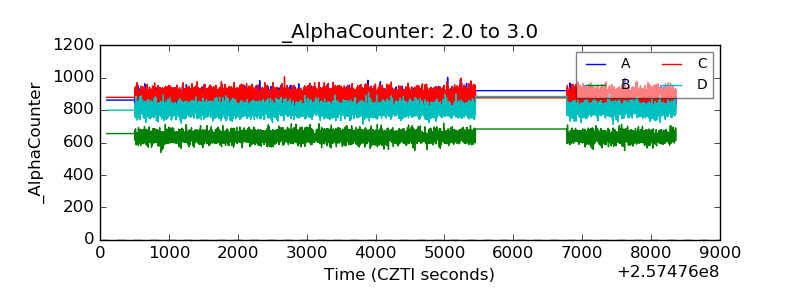 |
| _CPM_Rate | 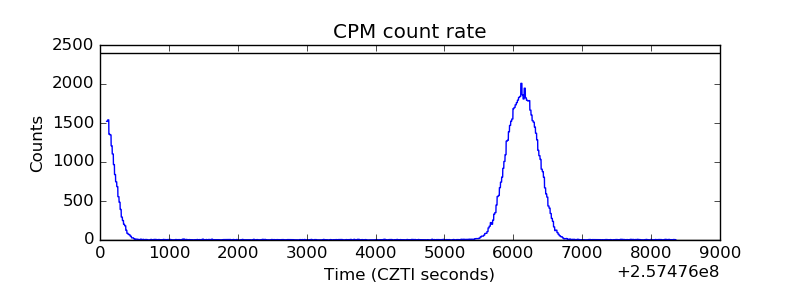 |
| CZT Counter | 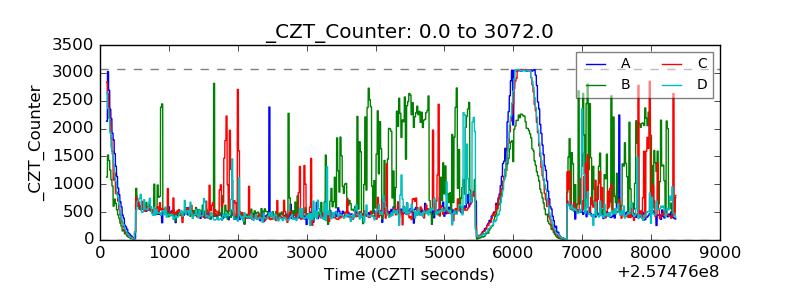 |
| +2.5 Volts monitor |  |
| +5 Volts monitor |  |
| _ROLL_ROT | 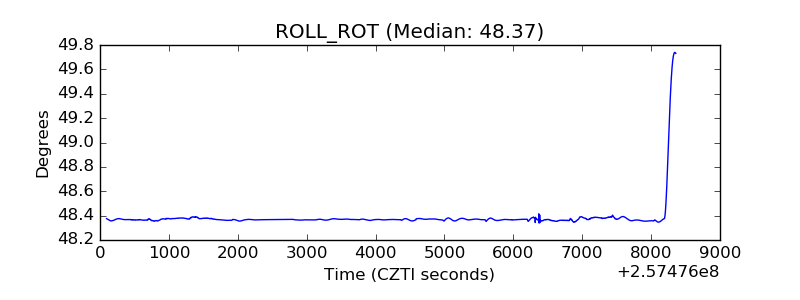 |
| _Roll_DEC | 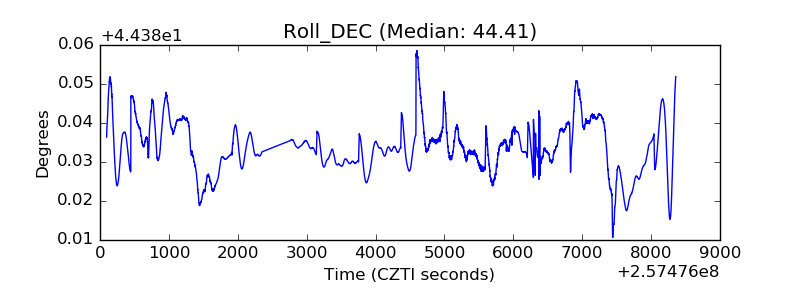 |
| _Roll_RA | 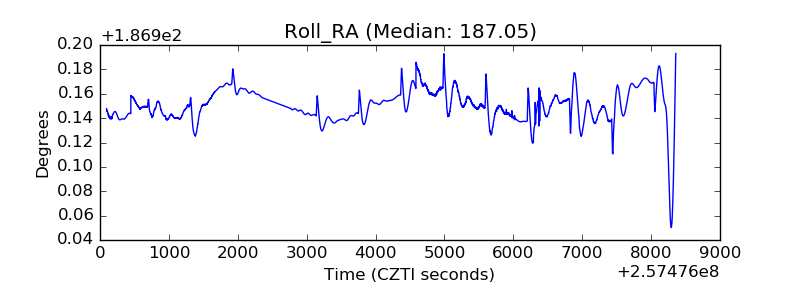 |
| Veto Counter | 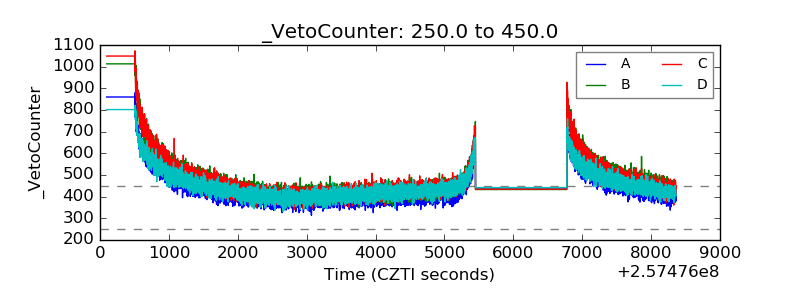 |