| Param | Original file | Final file |
|---|---|---|
| Filename | modeM0/AS1A04_067T01_9000001926_13086cztM0_level2.evt | modeM0/AS1A04_067T01_9000001926_13086cztM0_level2_quad_clean.evt |
| Size (bytes) | 621,161,280 | 92,989,440 |
| Size | 592.4 MB | 88.7 MB |
| Events in quadrant A | 3,972,537 | 574,165 |
| Events in quadrant B | 5,442,817 | 559,381 |
| Events in quadrant C | 4,504,906 | 565,459 |
| Events in quadrant D | 4,332,882 | 544,139 |
| Mode M9 | |||
|---|---|---|---|
| Quadrant | BADHDUFLAG | Total packets | Discarded packets |
| A | 0 | 24 | 8 |
| B | 0 | 24 | 9 |
| C | 0 | 24 | 7 |
| D | 0 | 24 | 6 |
| Mode SS | |||
|---|---|---|---|
| Quadrant | BADHDUFLAG | Total packets | Discarded packets |
| A | 0 | 209 | 46 |
| B | 0 | 210 | 40 |
| C | 0 | 210 | 42 |
| D | 0 | 210 | 44 |
| Mode M0 | |||
|---|---|---|---|
| Quadrant | BADHDUFLAG | Total packets | Discarded packets |
| A | 0 | 21381 | 4400 |
| B | 0 | 26580 | 5171 |
| C | 0 | 23808 | 4845 |
| D | 0 | 23344 | 5023 |
| Quadrant | Total seconds | Saturated seconds | Saturation percentage |
|---|---|---|---|
| A | 8267 | 27 | 0.326600% |
| B | 8198 | 518 | 6.318614% |
| C | 8258 | 161 | 1.949625% |
| D | 8225 | 50 | 0.607903% |
Noise dominated data is calculated using 1-second bins in cleaned event files. If a bin has >2000 counts, and if more than 50% of those come from <1% of pixels, then it is considered to be noise-dominated and hence unusable.
| Quadrant | # 1 sec bins | Bins with >0 counts | Bins with >2000 counts | High rate bins dominated by noise | Noise dominated (total time) | Noise dominated (detector-on time) | Marked lightcurve |
|---|---|---|---|---|---|---|---|
| A | 12767 | 8545 | 0 | 0 | 0.00% | 0.00% |  |
| B | 12764 | 8486 | 304 | 304 | 2.38% | 3.58% |  |
| C | 12766 | 8556 | 133 | 133 | 1.04% | 1.55% | 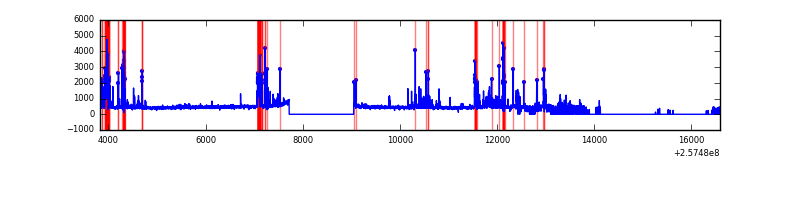 |
| D | 12764 | 8514 | 35 | 35 | 0.27% | 0.41% | 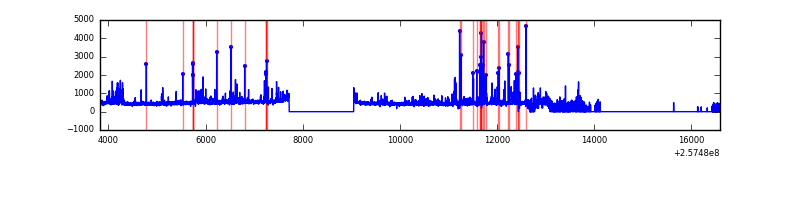 |
Top three noisy pixels from each quadrant. If the there are fewer than three noisy pixels in the level2.evt file, extra rows are filled as -1
| Pixel properties | Quadrant properties | ||||||
|---|---|---|---|---|---|---|---|
| Quadrant | DetID | PixID | Counts | Sigma | Mean | Median | Sigma |
| A | 12 | 189 | 88898 | 442.77 | 992 | 971 | 198.6 |
| A | 8 | 192 | 37424 | 183.57 | 992 | 971 | 198.6 |
| A | 1 | 162 | 17462 | 83.04 | 992 | 971 | 198.6 |
| B | 0 | 85 | 776324 | 4356.74 | 954 | 933 | 178.0 |
| B | 4 | 239 | 760489 | 4267.77 | 954 | 933 | 178.0 |
| B | 0 | 219 | 74341 | 412.46 | 954 | 933 | 178.0 |
| C | 15 | 208 | 826917 | 3862.93 | 940 | 944 | 213.8 |
| C | 13 | 61 | 7038 | 28.5 | 940 | 944 | 213.8 |
| C | 0 | 207 | 4564 | 16.93 | 940 | 944 | 213.8 |
| D | 1 | 52 | 543207 | 2436.82 | 942 | 914 | 222.5 |
| D | 10 | 157 | 94791 | 421.84 | 942 | 914 | 222.5 |
| D | 7 | 80 | 71769 | 318.39 | 942 | 914 | 222.5 |
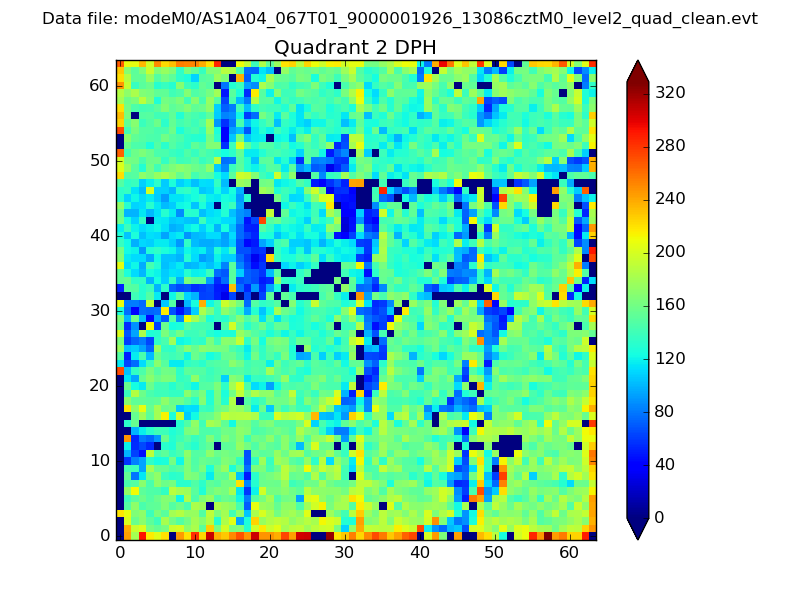
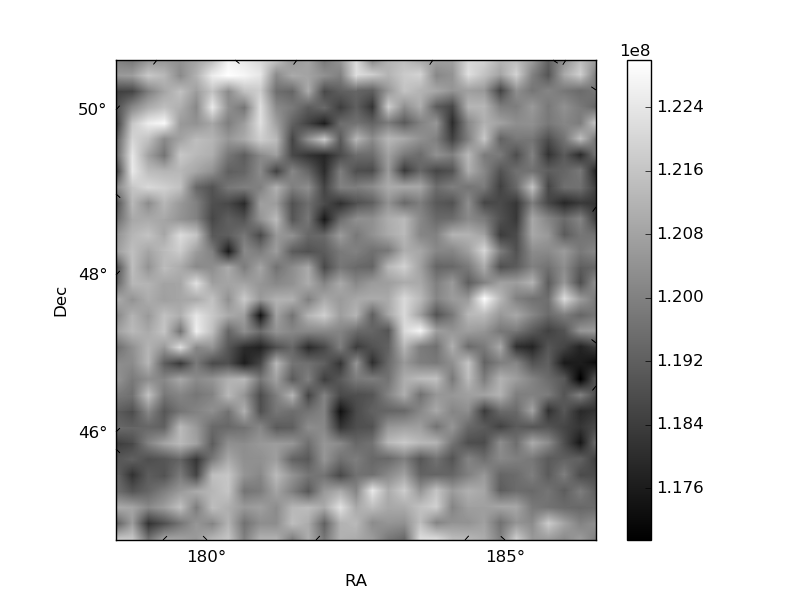
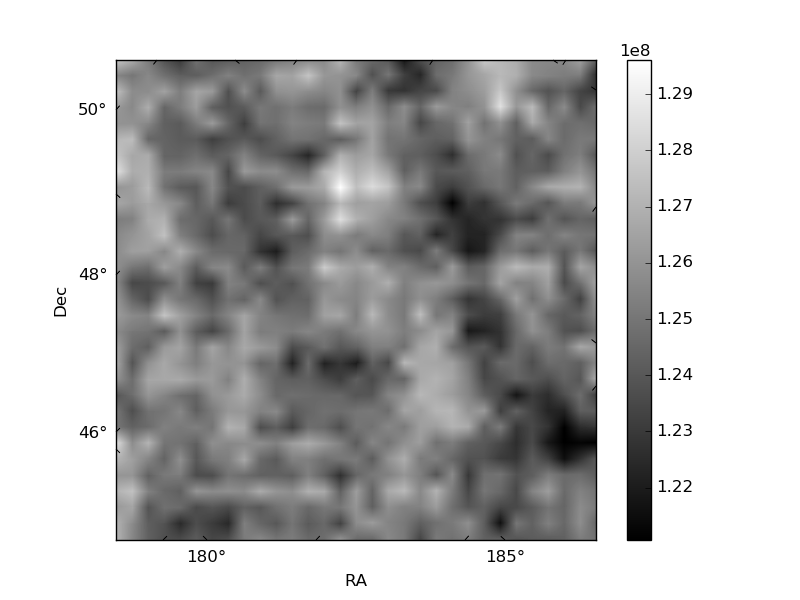
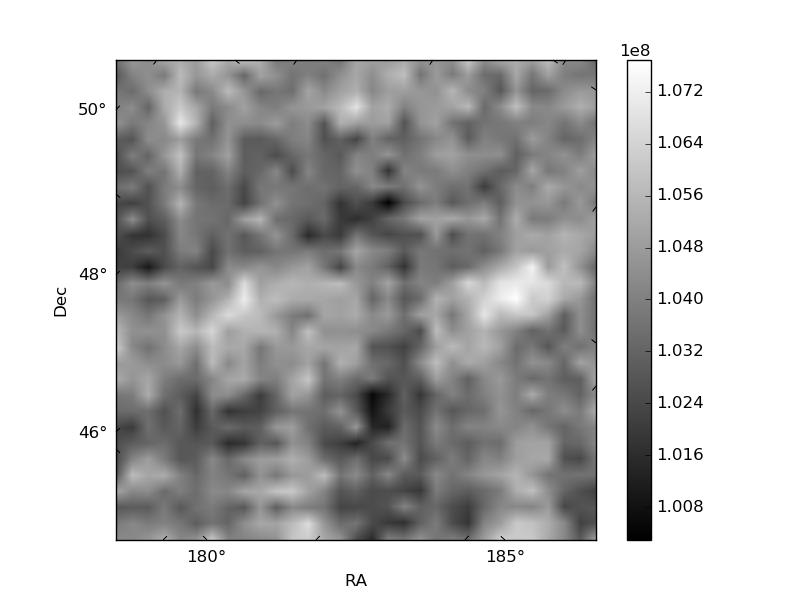
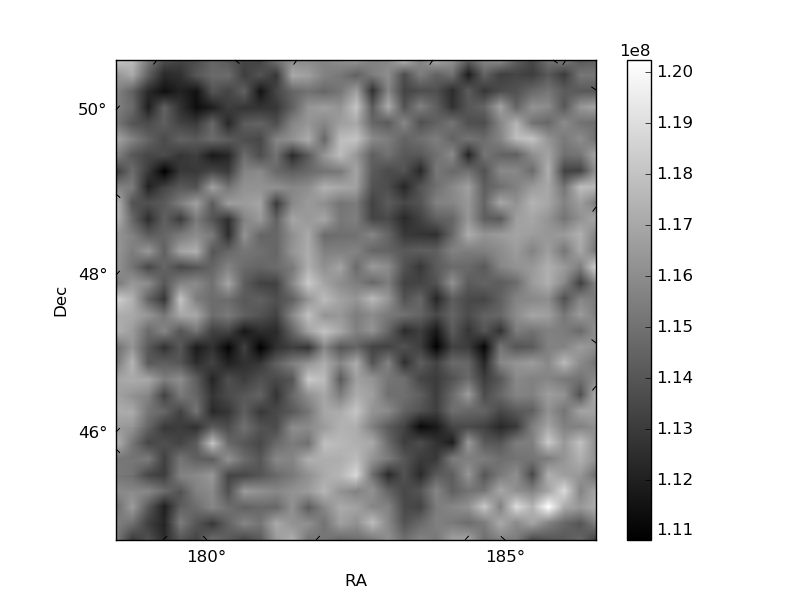
Histogram calculated using DETX and DETY for each event in the final _common_clean file
| Quadrant A | 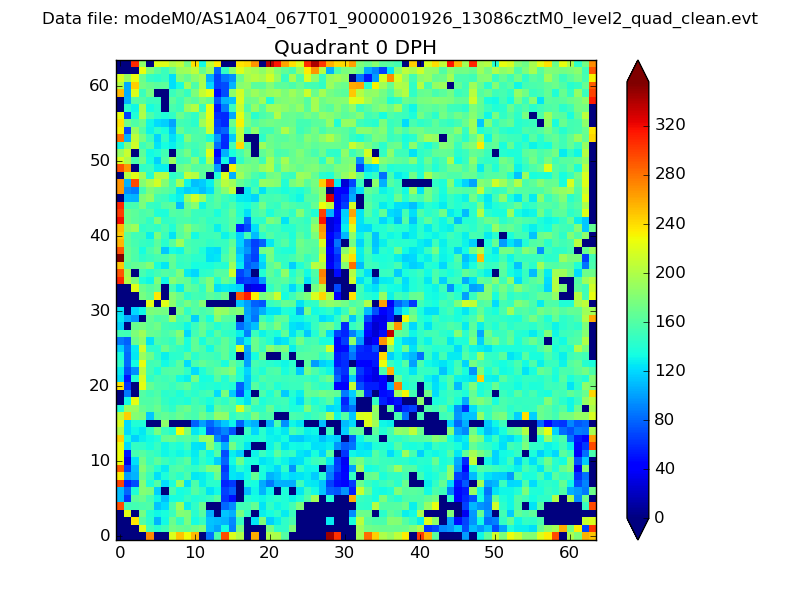 |
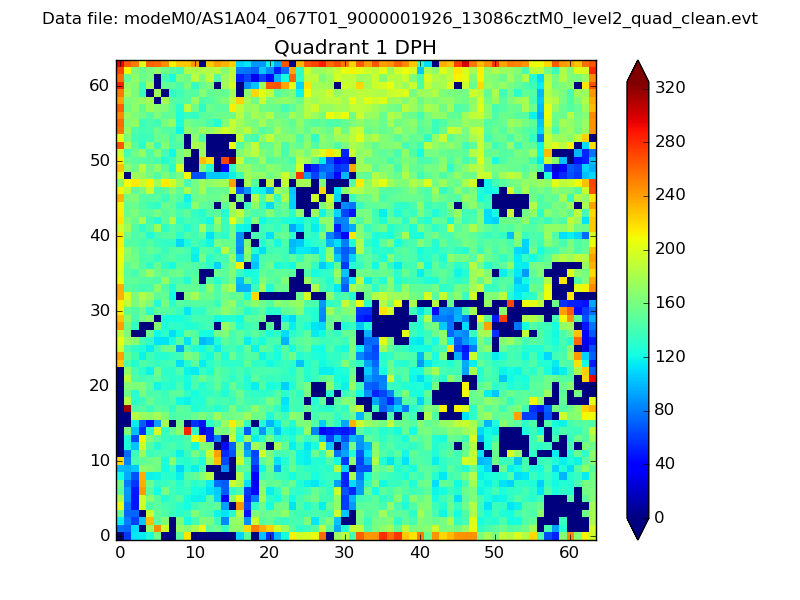 |
Quadrant B |
|---|---|---|---|
| Quadrant D | 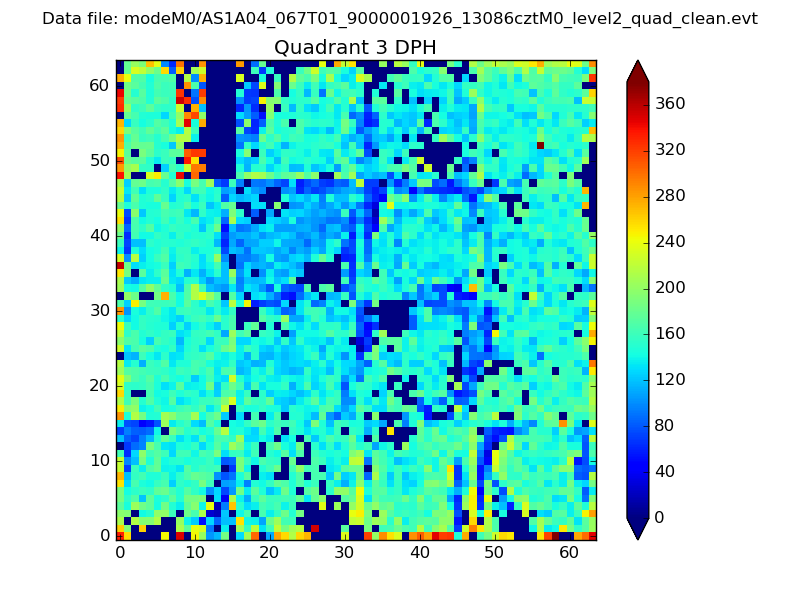 |
 |
Quadrant C |
| Plot type | Count rate plots | Images |
|---|---|---|
| Comparison with Poisson distribution Blue bars denote a histogram of data divided into 1 sec bins. Red curve is a Poisson curve with rate = median count rate of data. |
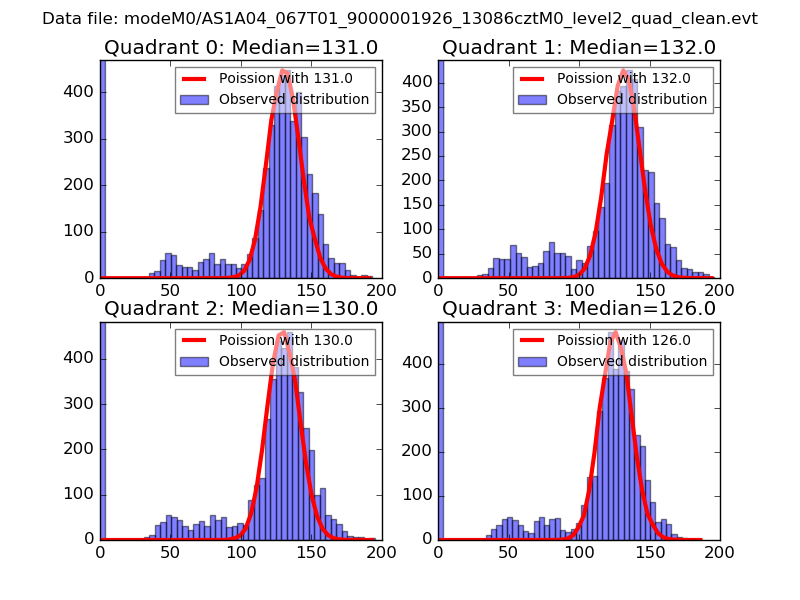 |
 |
| Quadrant-wise count rates Data is divided into 100 sec bins |
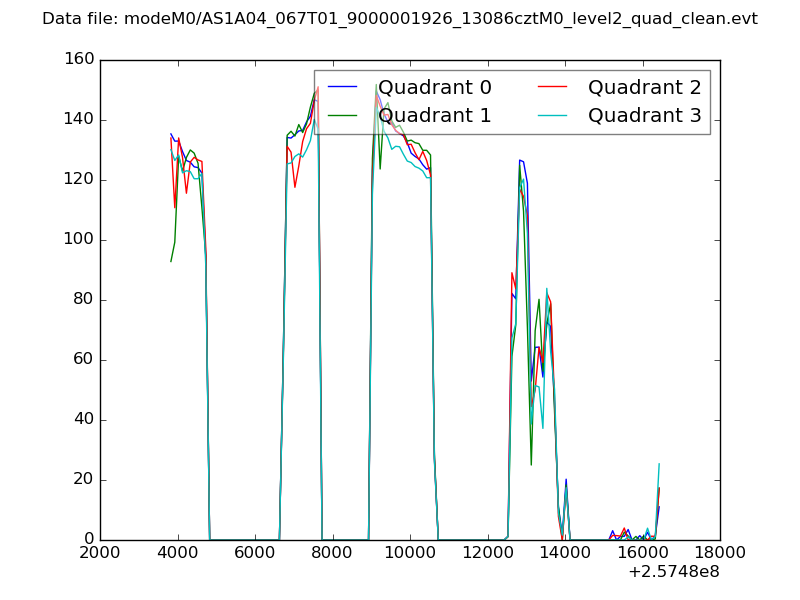 |
|
| Module-wise count rates for Quadrant A Data is divided into 100 sec bins |
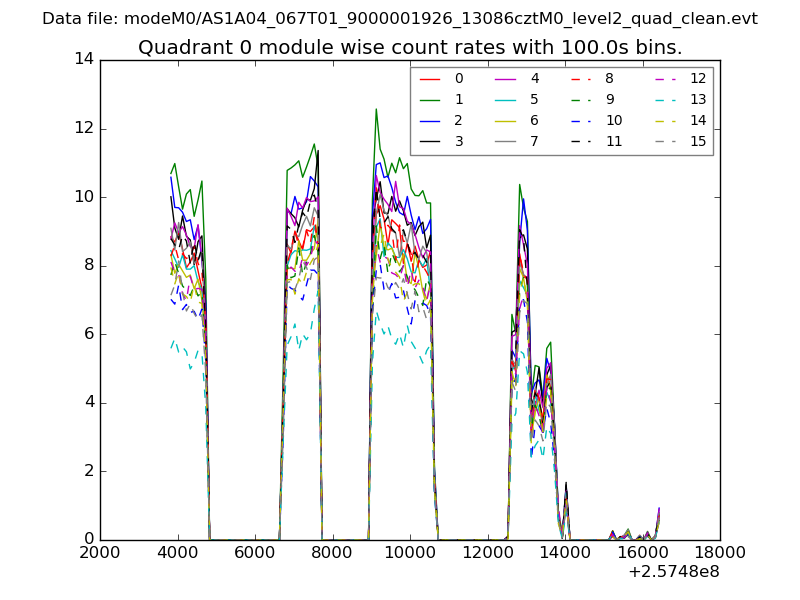 |
 |
| Module-wise count rates for Quadrant B Data is divided into 100 sec bins |
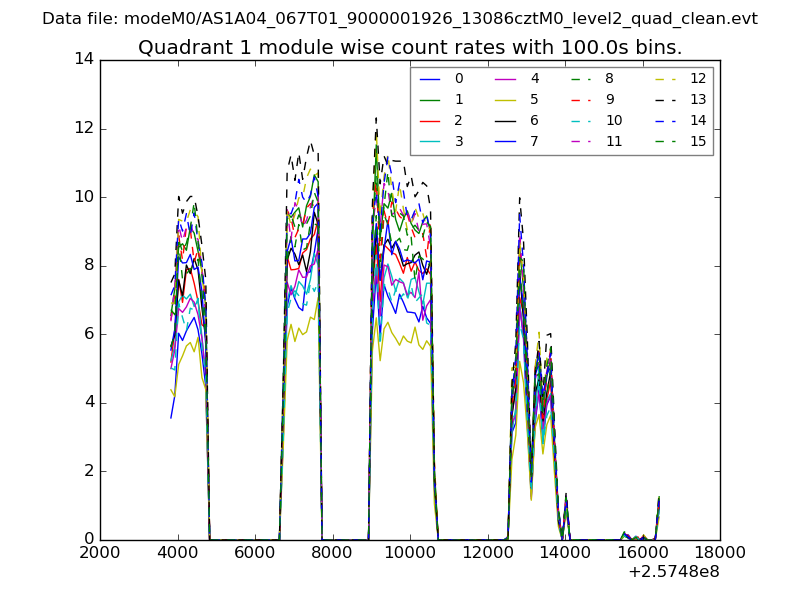 |
 |
| Module-wise count rates for Quadrant C Data is divided into 100 sec bins |
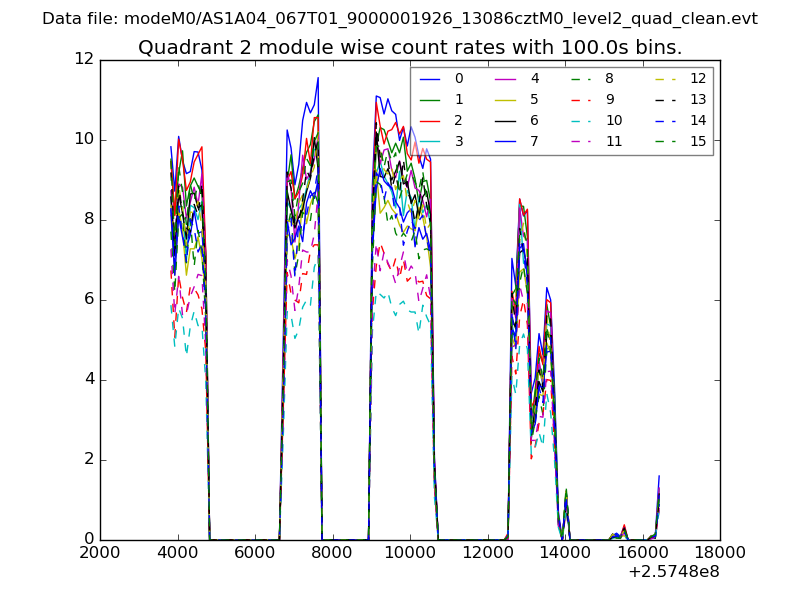 |
 |
| Module-wise count rates for Quadrant D Data is divided into 100 sec bins |
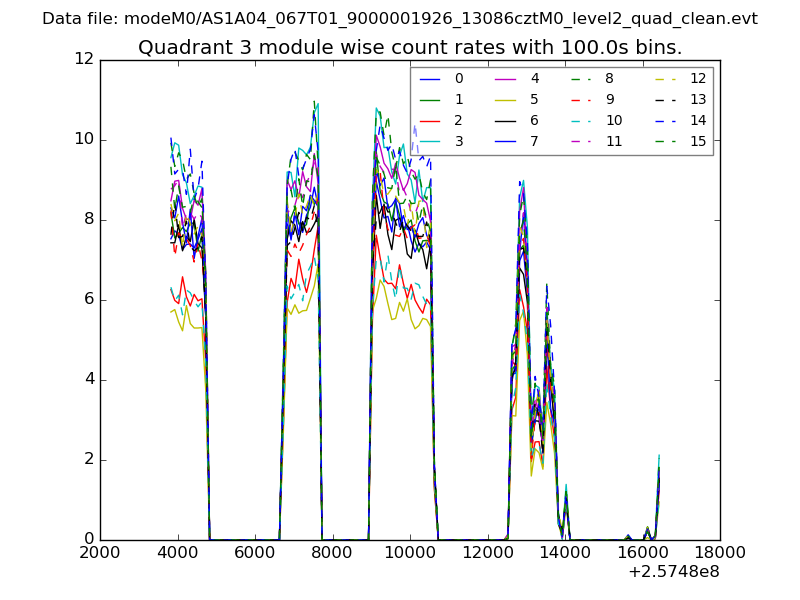 |
 |
| Parameter | Plot |
|---|---|
| CZT HV Monitor | 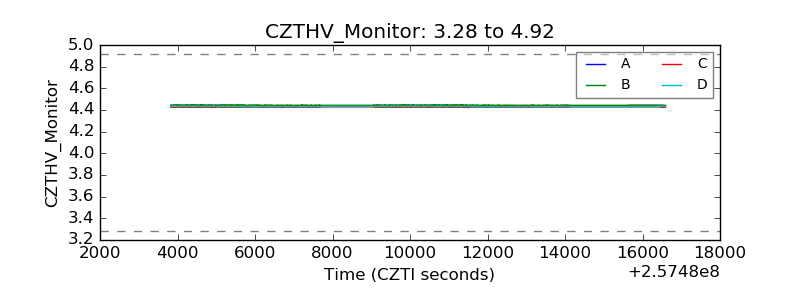 |
| D_VDD |  |
| Temperature 1 | 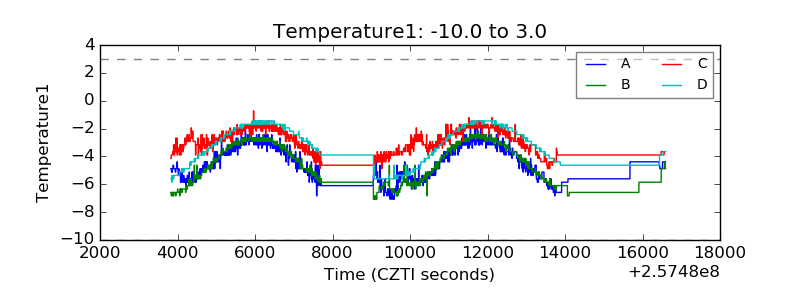 |
| Veto HV Monitor |  |
| Veto LLD | 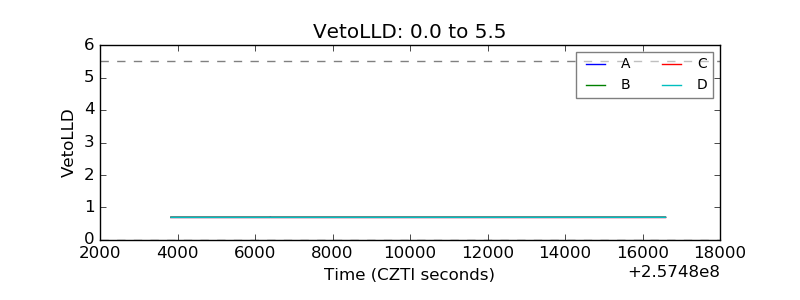 |
| Alpha Counter | 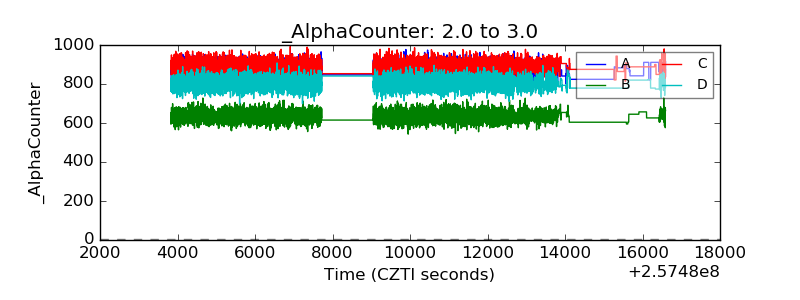 |
| _CPM_Rate | 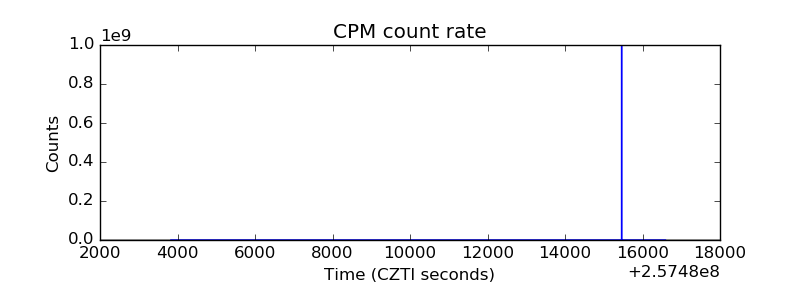 |
| CZT Counter | 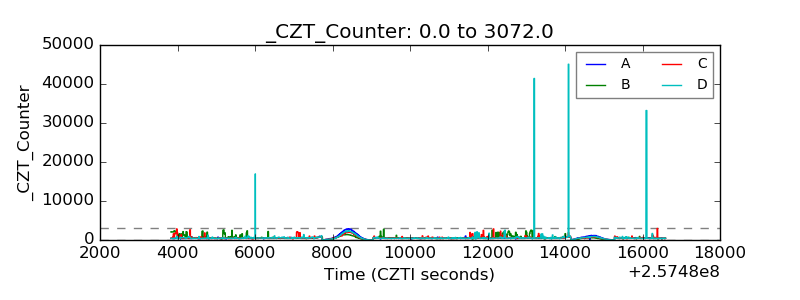 |
| +2.5 Volts monitor |  |
| +5 Volts monitor |  |
| _ROLL_ROT | 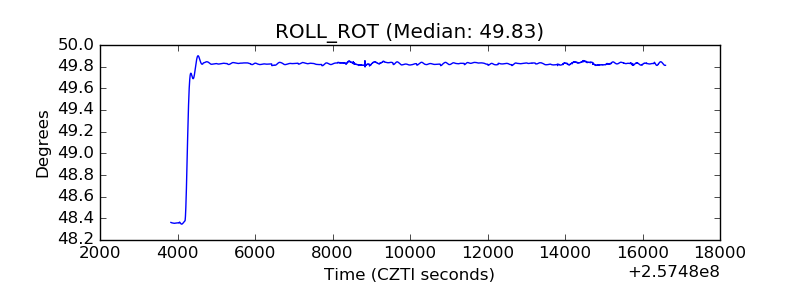 |
| _Roll_DEC | 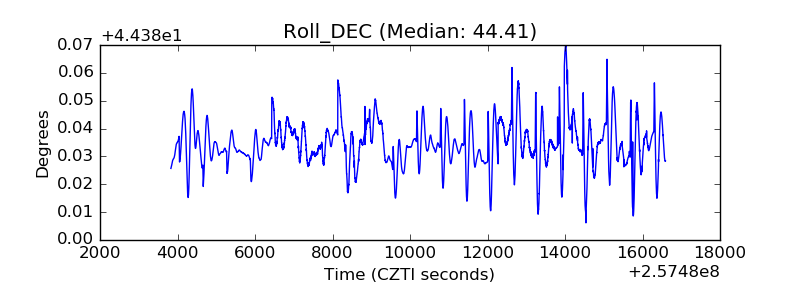 |
| _Roll_RA | 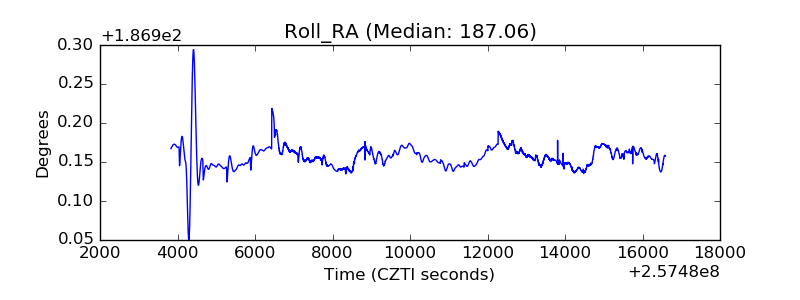 |
| Veto Counter | 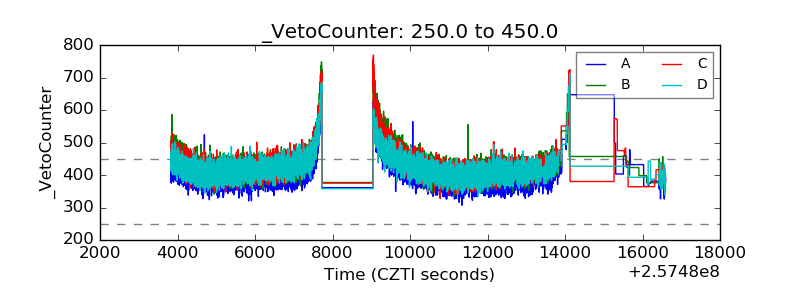 |