| Param | Original file | Final file |
|---|---|---|
| Filename | modeM0/AS1A04_067T01_9000001926_13087cztM0_level2.evt | modeM0/AS1A04_067T01_9000001926_13087cztM0_level2_quad_clean.evt |
| Size (bytes) | 471,758,400 | 77,523,840 |
| Size | 449.9 MB | 73.9 MB |
| Events in quadrant A | 3,162,819 | 482,432 |
| Events in quadrant B | 3,869,439 | 469,541 |
| Events in quadrant C | 3,347,880 | 482,061 |
| Events in quadrant D | 3,464,533 | 459,182 |
| Mode M9 | |||
|---|---|---|---|
| Quadrant | BADHDUFLAG | Total packets | Discarded packets |
| A | 0 | 8 | 0 |
| B | 0 | 8 | 0 |
| C | 0 | 8 | 0 |
| D | 0 | 8 | 0 |
| Mode SS | |||
|---|---|---|---|
| Quadrant | BADHDUFLAG | Total packets | Discarded packets |
| A | 0 | 132 | 0 |
| B | 0 | 132 | 0 |
| C | 0 | 132 | 0 |
| D | 0 | 132 | 0 |
| Mode M0 | |||
|---|---|---|---|
| Quadrant | BADHDUFLAG | Total packets | Discarded packets |
| A | 0 | 13466 | 3 |
| B | 0 | 15745 | 2 |
| C | 0 | 14392 | 2 |
| D | 0 | 14808 | 2 |
| Quadrant | Total seconds | Saturated seconds | Saturation percentage |
|---|---|---|---|
| A | 6512 | 70 | 1.074939% |
| B | 6512 | 379 | 5.820025% |
| C | 6512 | 90 | 1.382064% |
| D | 6512 | 165 | 2.533784% |
Noise dominated data is calculated using 1-second bins in cleaned event files. If a bin has >2000 counts, and if more than 50% of those come from <1% of pixels, then it is considered to be noise-dominated and hence unusable.
| Quadrant | # 1 sec bins | Bins with >0 counts | Bins with >2000 counts | High rate bins dominated by noise | Noise dominated (total time) | Noise dominated (detector-on time) | Marked lightcurve |
|---|---|---|---|---|---|---|---|
| A | 7383 | 6515 | 5 | 5 | 0.07% | 0.08% | 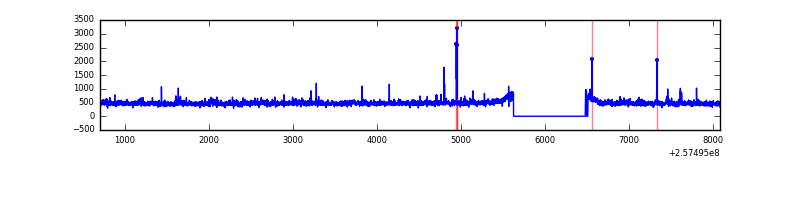 |
| B | 7383 | 6515 | 160 | 160 | 2.17% | 2.46% | 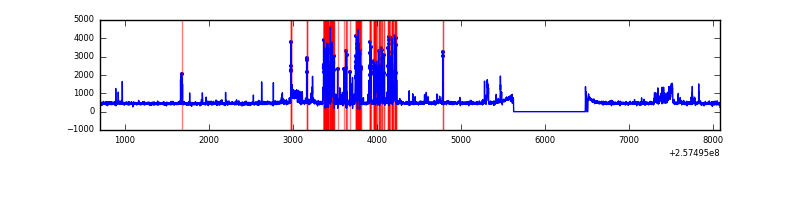 |
| C | 7383 | 6515 | 56 | 56 | 0.76% | 0.86% | 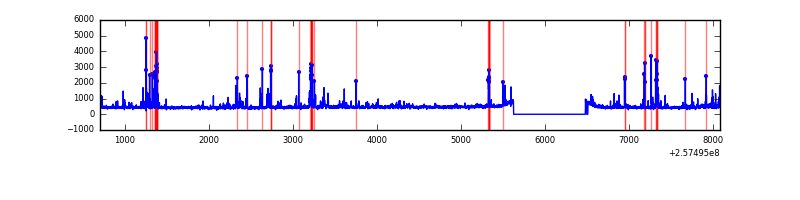 |
| D | 7383 | 6515 | 80 | 80 | 1.08% | 1.23% | 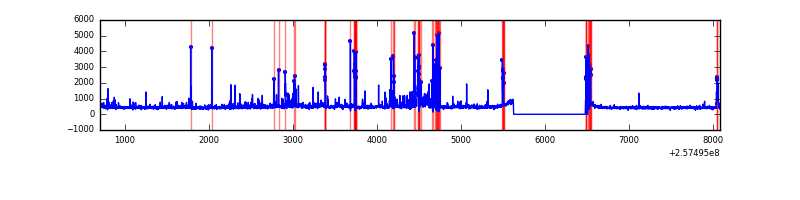 |
Top three noisy pixels from each quadrant. If the there are fewer than three noisy pixels in the level2.evt file, extra rows are filled as -1
| Pixel properties | Quadrant properties | ||||||
|---|---|---|---|---|---|---|---|
| Quadrant | DetID | PixID | Counts | Sigma | Mean | Median | Sigma |
| A | 12 | 189 | 83758 | 536.93 | 764 | 747 | 154.6 |
| A | 8 | 192 | 58113 | 371.05 | 764 | 747 | 154.6 |
| A | 5 | 16 | 31960 | 201.89 | 764 | 747 | 154.6 |
| B | 4 | 239 | 590307 | 4219.41 | 738 | 721 | 139.7 |
| B | 0 | 219 | 148330 | 1056.37 | 738 | 721 | 139.7 |
| B | 3 | 64 | 119644 | 851.08 | 738 | 721 | 139.7 |
| C | 15 | 208 | 449080 | 2648.43 | 733 | 736 | 169.3 |
| C | 14 | 234 | 31523 | 181.86 | 733 | 736 | 169.3 |
| C | 13 | 61 | 5394 | 27.52 | 733 | 736 | 169.3 |
| D | 1 | 52 | 555553 | 3171.12 | 728 | 709 | 175.0 |
| D | 8 | 195 | 96762 | 548.98 | 728 | 709 | 175.0 |
| D | 2 | 234 | 29396 | 163.96 | 728 | 709 | 175.0 |
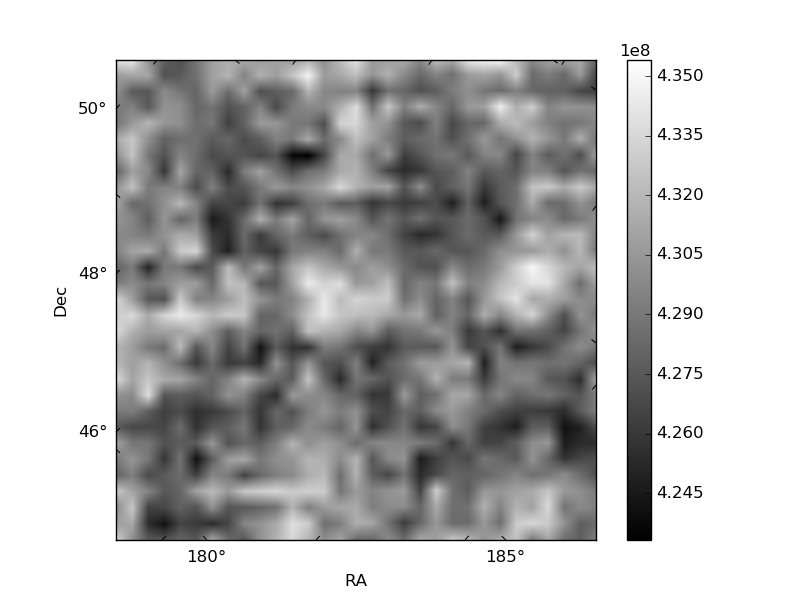
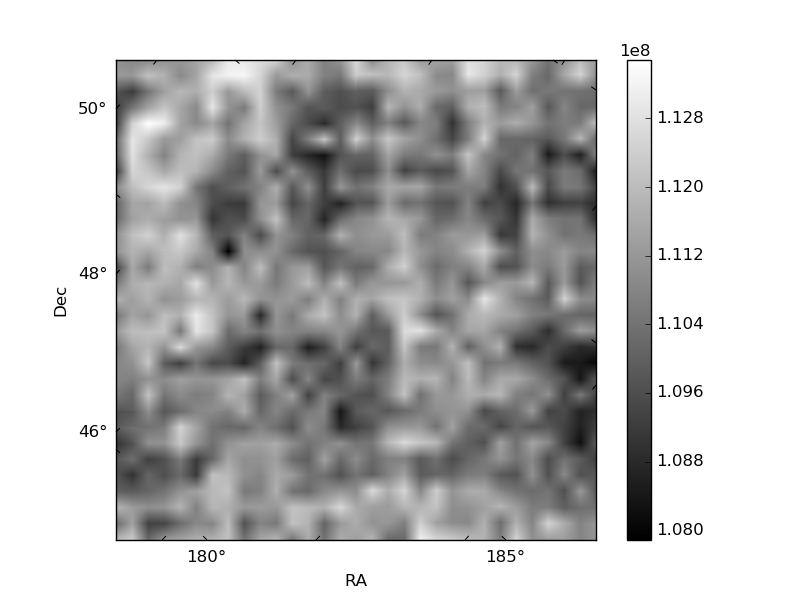
Histogram calculated using DETX and DETY for each event in the final _common_clean file
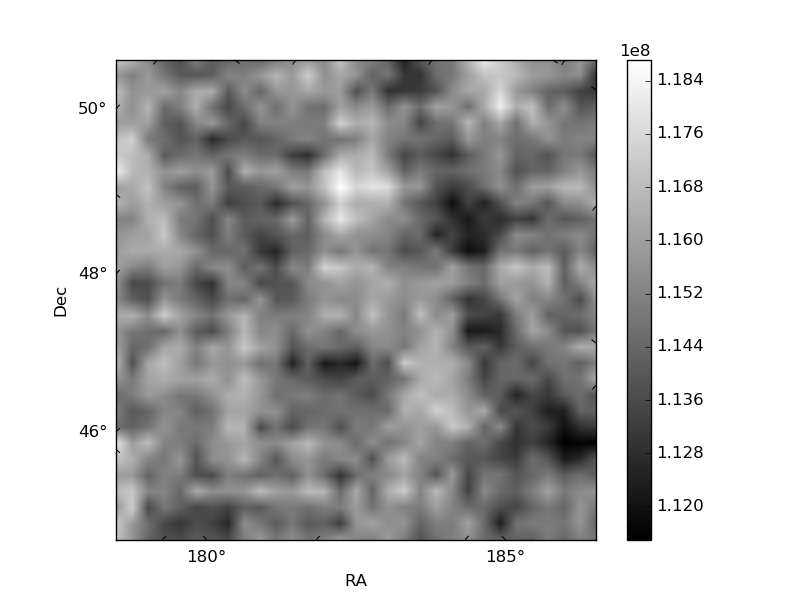
| Quadrant A | 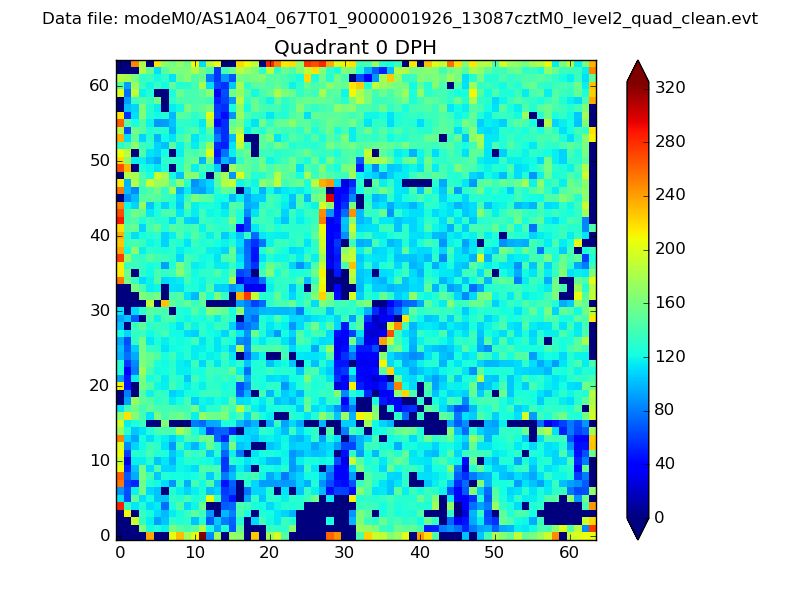 |
 |
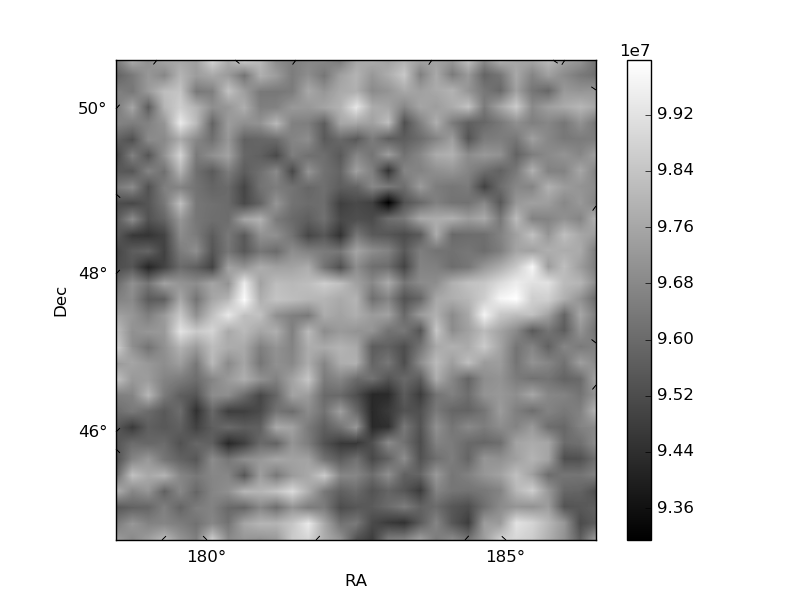
Quadrant B |
|---|---|---|---|
| Quadrant D | 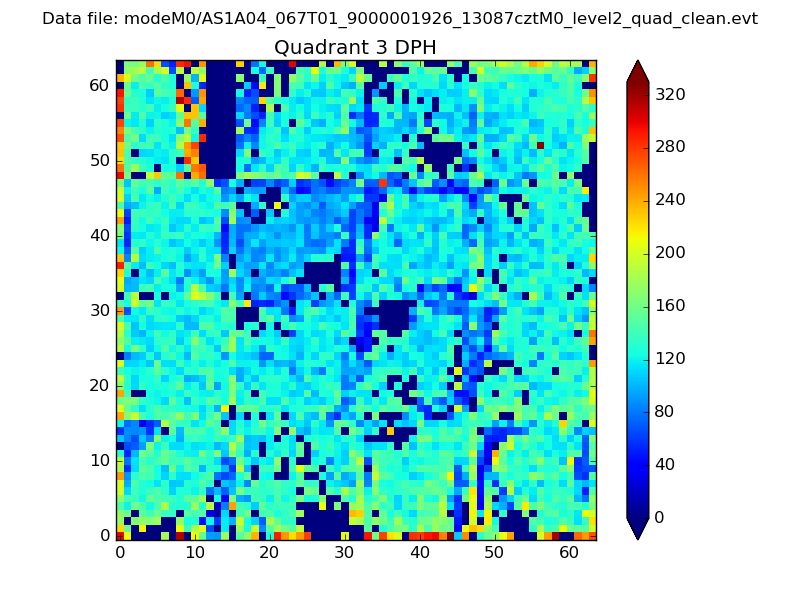 |
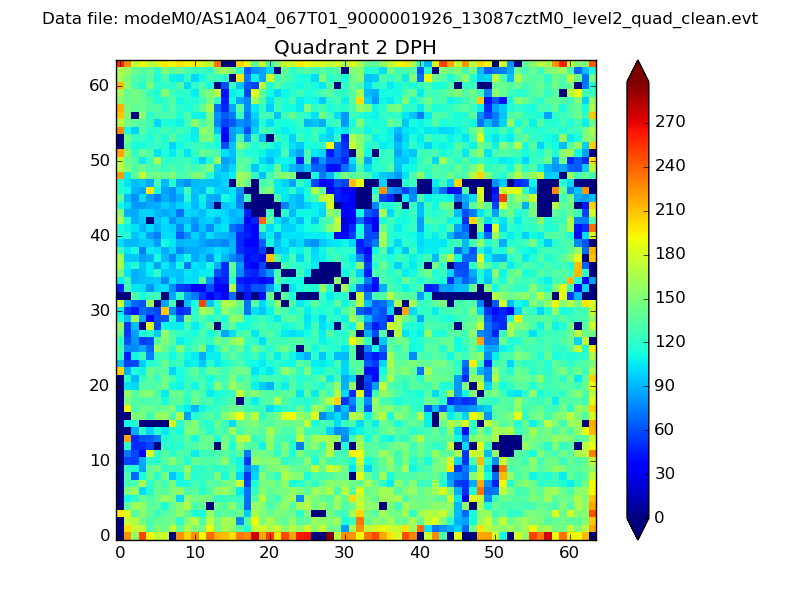 |
Quadrant C |
| Plot type | Count rate plots | Images |
|---|---|---|
| Comparison with Poisson distribution Blue bars denote a histogram of data divided into 1 sec bins. Red curve is a Poisson curve with rate = median count rate of data. |
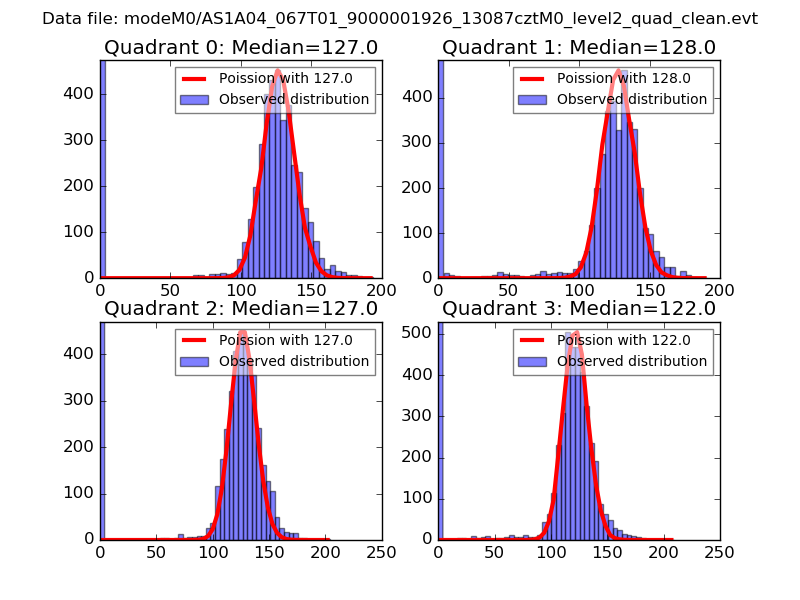 |
 |
| Quadrant-wise count rates Data is divided into 100 sec bins |
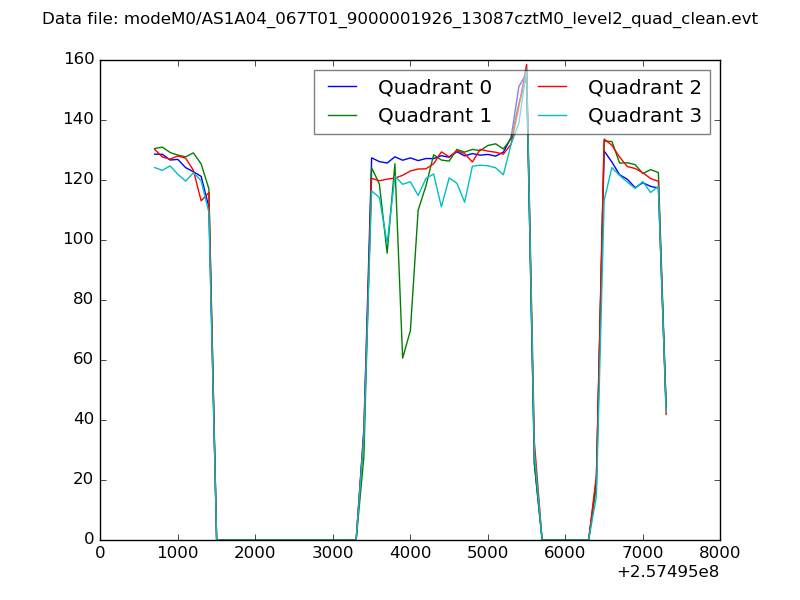 |
|
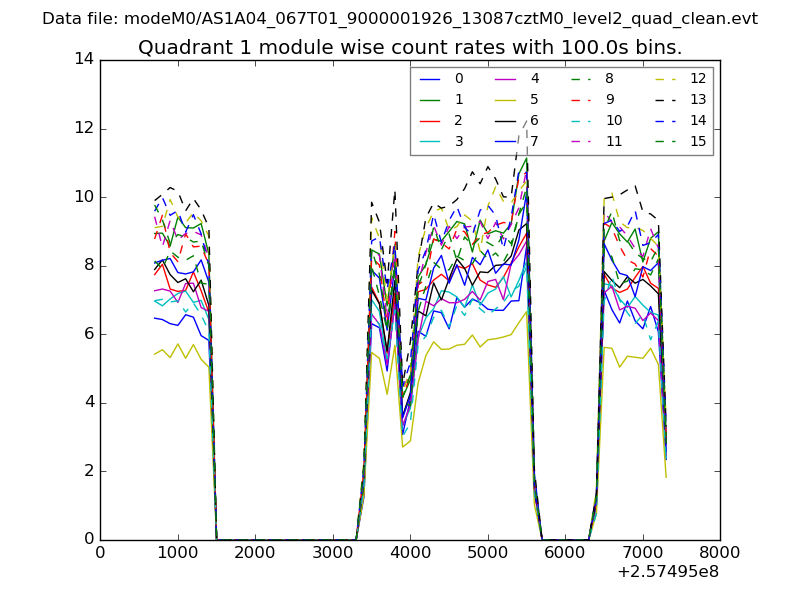
| Module-wise count rates for Quadrant A Data is divided into 100 sec bins |
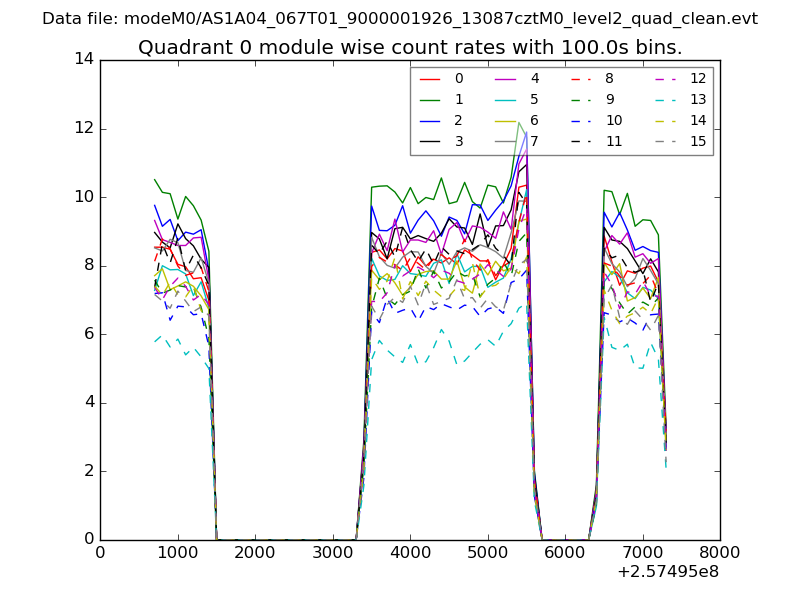 |
 |
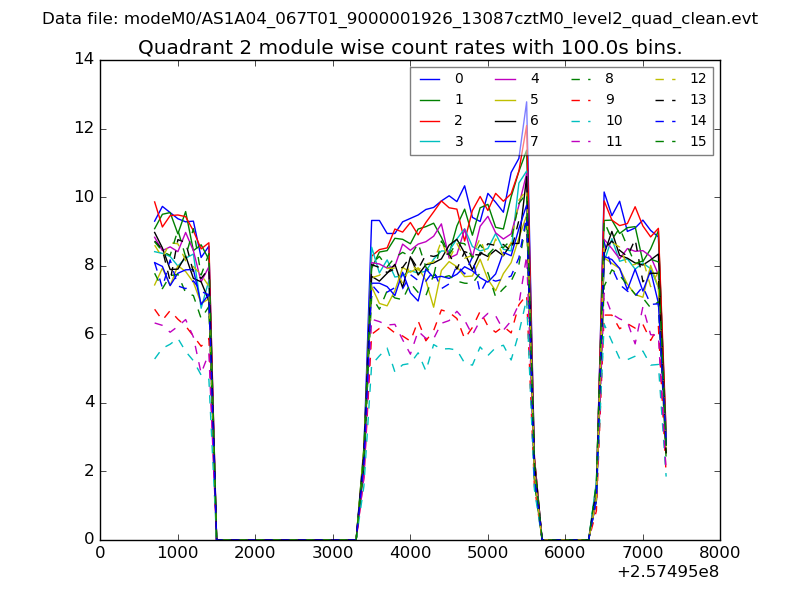
| Module-wise count rates for Quadrant B Data is divided into 100 sec bins |
 |
 |
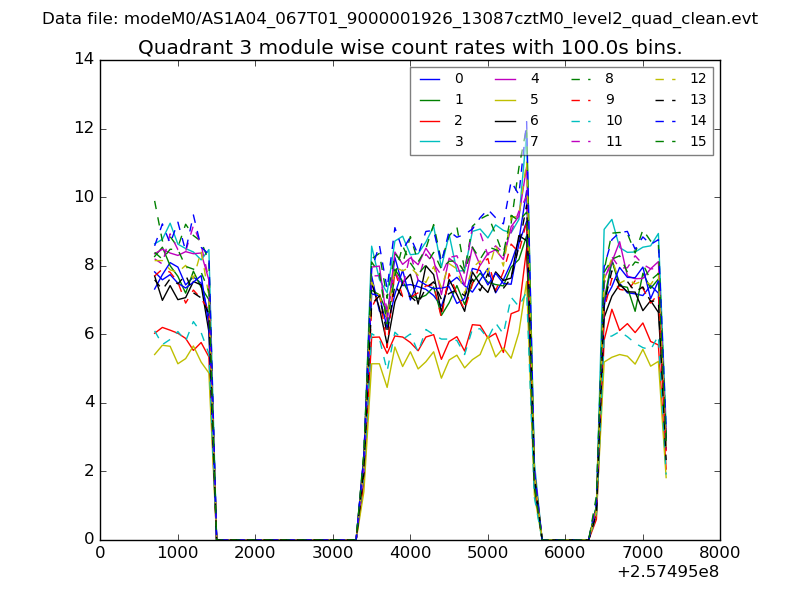
| Module-wise count rates for Quadrant C Data is divided into 100 sec bins |
 |
 |
| Module-wise count rates for Quadrant D Data is divided into 100 sec bins |
 |
 |
| Parameter | Plot |
|---|---|
| CZT HV Monitor | 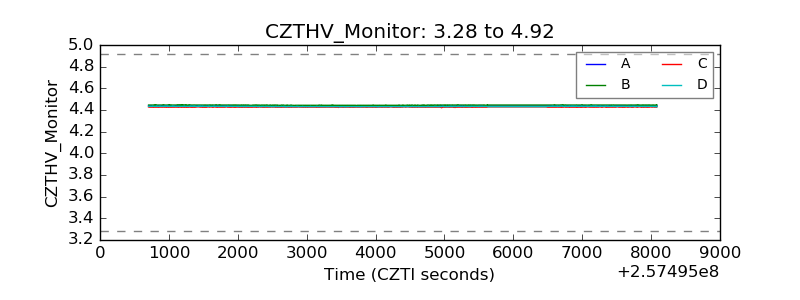 |
| D_VDD | 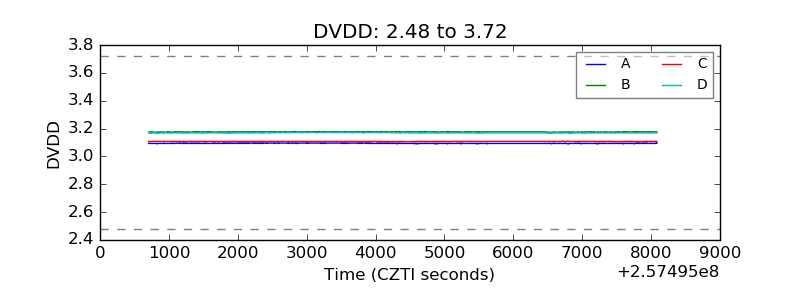 |
| Temperature 1 | 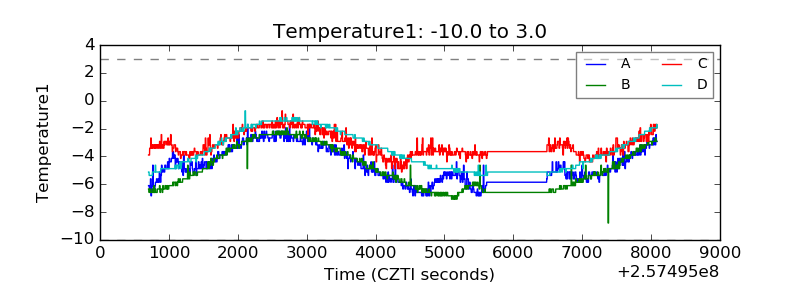 |
| Veto HV Monitor | 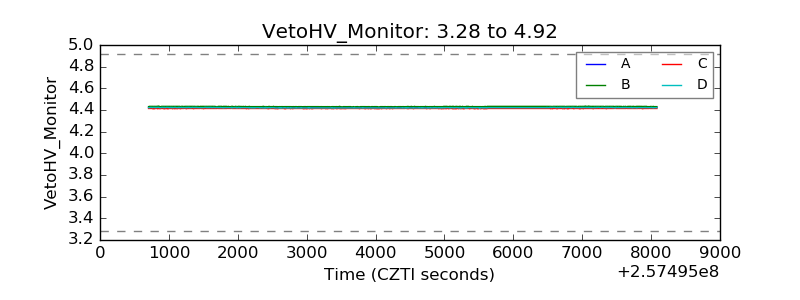 |
| Veto LLD | 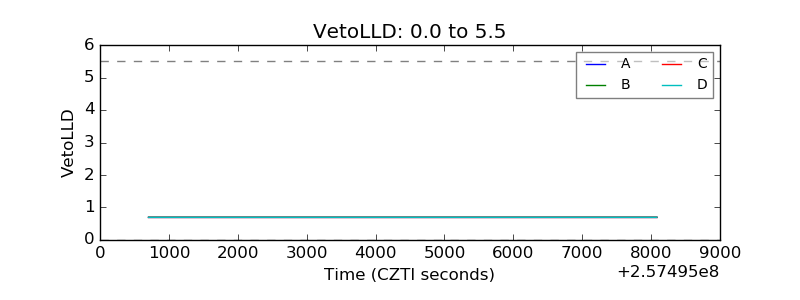 |
| Alpha Counter | 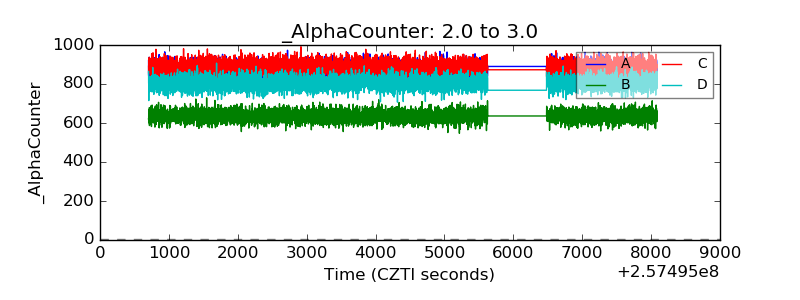 |
| _CPM_Rate | 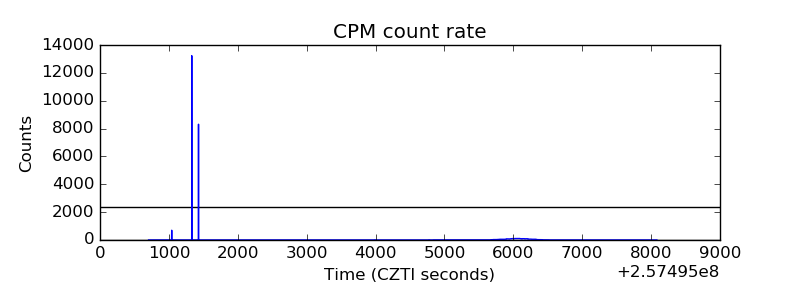 |
| CZT Counter | 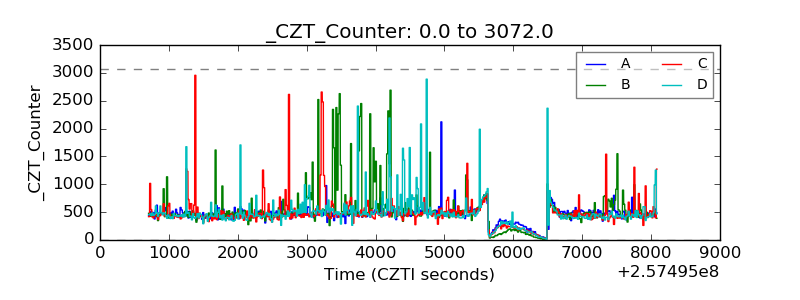 |
| +2.5 Volts monitor |  |
| +5 Volts monitor |  |
| _ROLL_ROT | 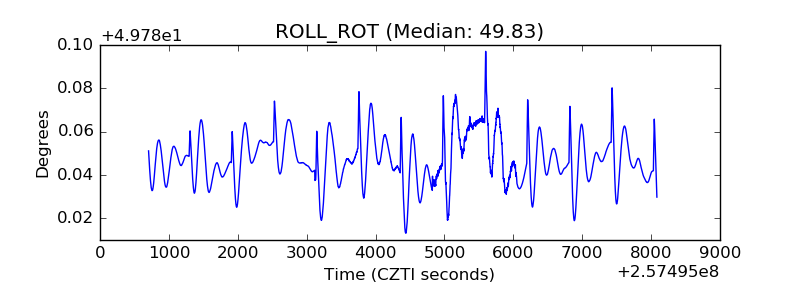 |
| _Roll_DEC | 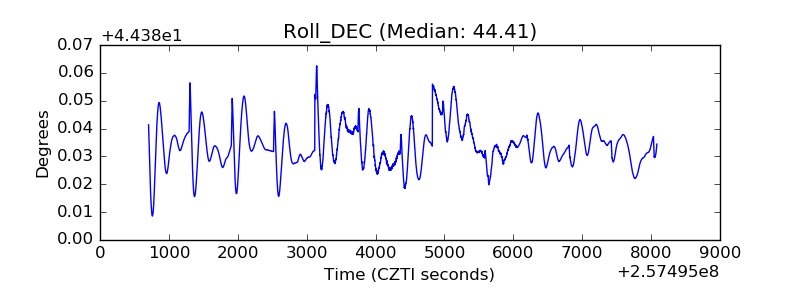 |
| _Roll_RA | 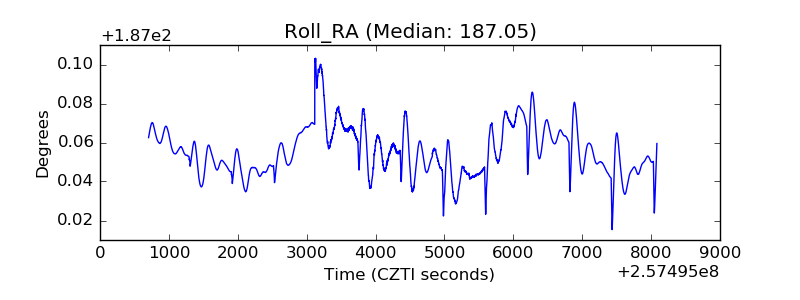 |
| Veto Counter | 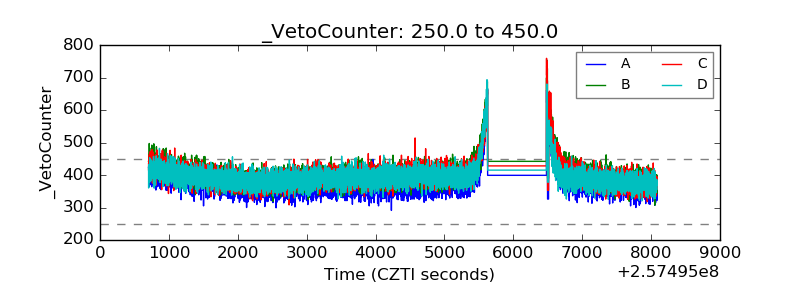 |