| Param | Original file | Final file |
|---|---|---|
| Filename | modeM0/AS1A04_067T01_9000001926_13088cztM0_level2.evt | modeM0/AS1A04_067T01_9000001926_13088cztM0_level2_quad_clean.evt |
| Size (bytes) | 566,533,440 | 86,063,040 |
| Size | 540.3 MB | 82.1 MB |
| Events in quadrant A | 3,642,859 | 526,540 |
| Events in quadrant B | 5,223,797 | 517,705 |
| Events in quadrant C | 3,837,280 | 529,764 |
| Events in quadrant D | 3,944,949 | 510,481 |
| Mode M9 | |||
|---|---|---|---|
| Quadrant | BADHDUFLAG | Total packets | Discarded packets |
| A | 0 | 4 | 0 |
| B | 0 | 4 | 0 |
| C | 0 | 4 | 0 |
| D | 0 | 4 | 0 |
| Mode SS | |||
|---|---|---|---|
| Quadrant | BADHDUFLAG | Total packets | Discarded packets |
| A | 0 | 154 | 0 |
| B | 0 | 154 | 0 |
| C | 0 | 154 | 0 |
| D | 0 | 154 | 0 |
| Mode M0 | |||
|---|---|---|---|
| Quadrant | BADHDUFLAG | Total packets | Discarded packets |
| A | 0 | 15646 | 4 |
| B | 0 | 20429 | 3 |
| C | 0 | 16635 | 3 |
| D | 0 | 16957 | 3 |
| Quadrant | Total seconds | Saturated seconds | Saturation percentage |
|---|---|---|---|
| A | 7484 | 145 | 1.937467% |
| B | 7484 | 823 | 10.996793% |
| C | 7484 | 146 | 1.950828% |
| D | 7485 | 151 | 2.017368% |
Noise dominated data is calculated using 1-second bins in cleaned event files. If a bin has >2000 counts, and if more than 50% of those come from <1% of pixels, then it is considered to be noise-dominated and hence unusable.
| Quadrant | # 1 sec bins | Bins with >0 counts | Bins with >2000 counts | High rate bins dominated by noise | Noise dominated (total time) | Noise dominated (detector-on time) | Marked lightcurve |
|---|---|---|---|---|---|---|---|
| A | 7940 | 7488 | 6 | 6 | 0.08% | 0.08% | 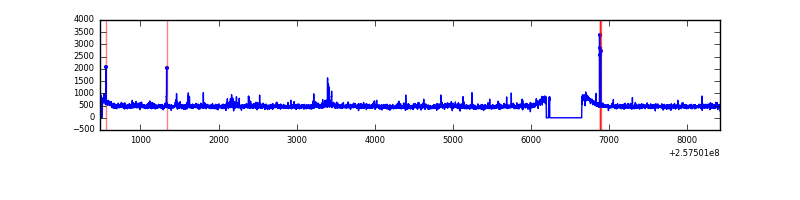 |
| B | 7940 | 7488 | 498 | 498 | 6.27% | 6.65% | 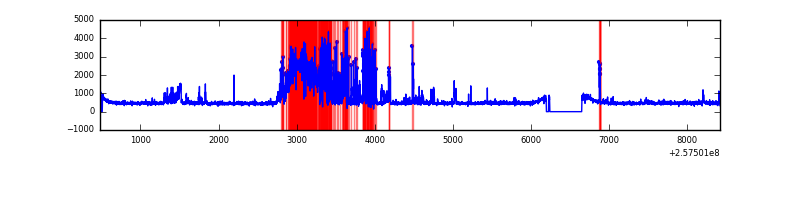 |
| C | 7940 | 7488 | 41 | 41 | 0.52% | 0.55% | 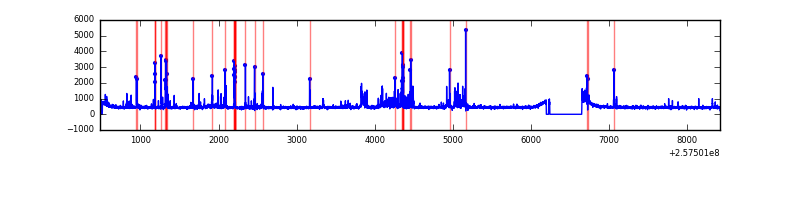 |
| D | 7941 | 7489 | 49 | 49 | 0.62% | 0.65% | 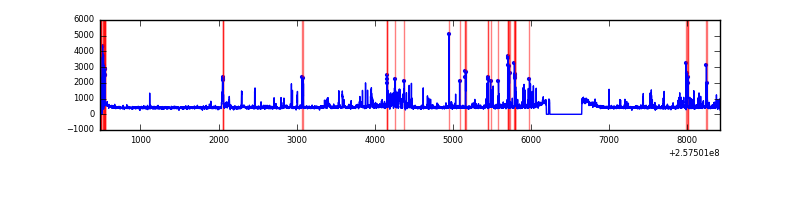 |
Top three noisy pixels from each quadrant. If the there are fewer than three noisy pixels in the level2.evt file, extra rows are filled as -1
| Pixel properties | Quadrant properties | ||||||
|---|---|---|---|---|---|---|---|
| Quadrant | DetID | PixID | Counts | Sigma | Mean | Median | Sigma |
| A | 12 | 189 | 106710 | 591.76 | 881 | 860 | 178.9 |
| A | 8 | 15 | 37713 | 206.03 | 881 | 860 | 178.9 |
| A | 1 | 162 | 29346 | 159.25 | 881 | 860 | 178.9 |
| B | 4 | 239 | 1284828 | 8086.31 | 829 | 807 | 158.8 |
| B | 3 | 64 | 328506 | 2063.73 | 829 | 807 | 158.8 |
| B | 0 | 230 | 167115 | 1047.35 | 829 | 807 | 158.8 |
| C | 15 | 208 | 451552 | 2297.4 | 848 | 851 | 196.2 |
| C | 14 | 234 | 62293 | 313.19 | 848 | 851 | 196.2 |
| C | 13 | 61 | 6114 | 26.83 | 848 | 851 | 196.2 |
| D | 1 | 52 | 618455 | 3046.33 | 846 | 821 | 202.7 |
| D | 7 | 80 | 38440 | 185.55 | 846 | 821 | 202.7 |
| D | 2 | 234 | 34791 | 167.55 | 846 | 821 | 202.7 |
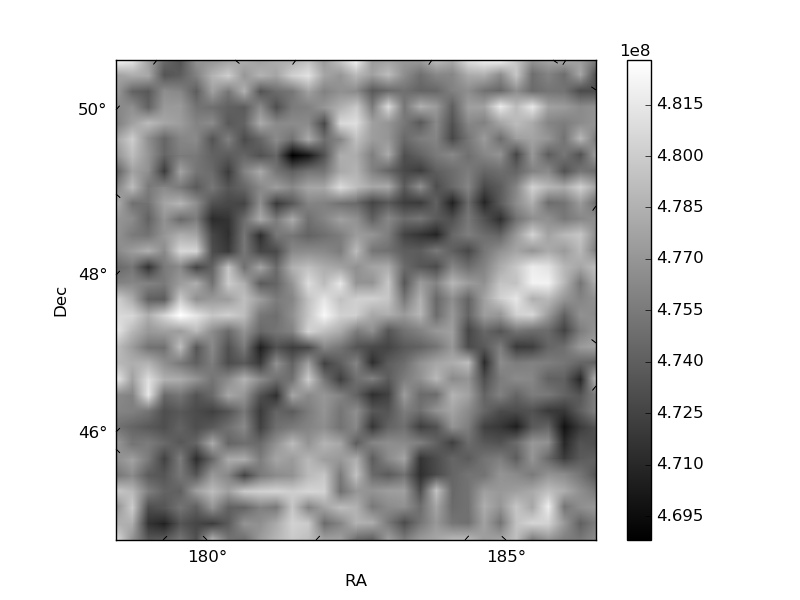
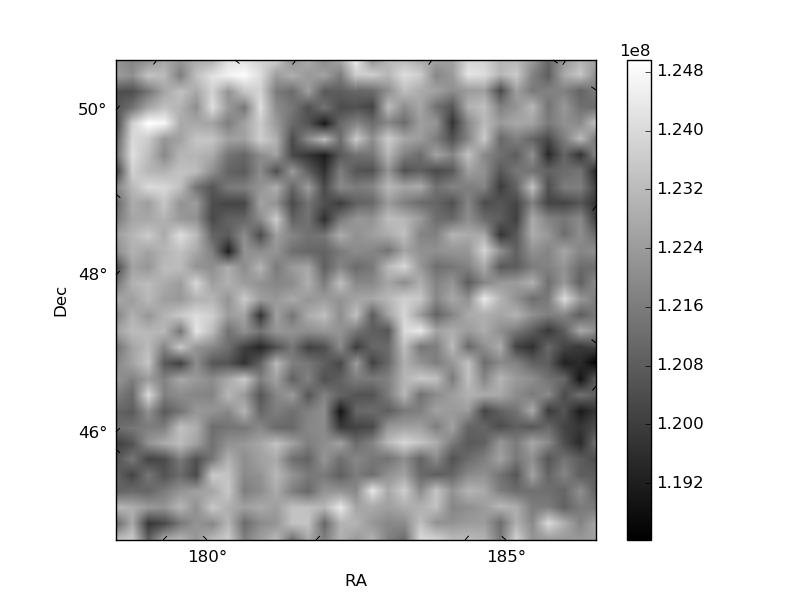
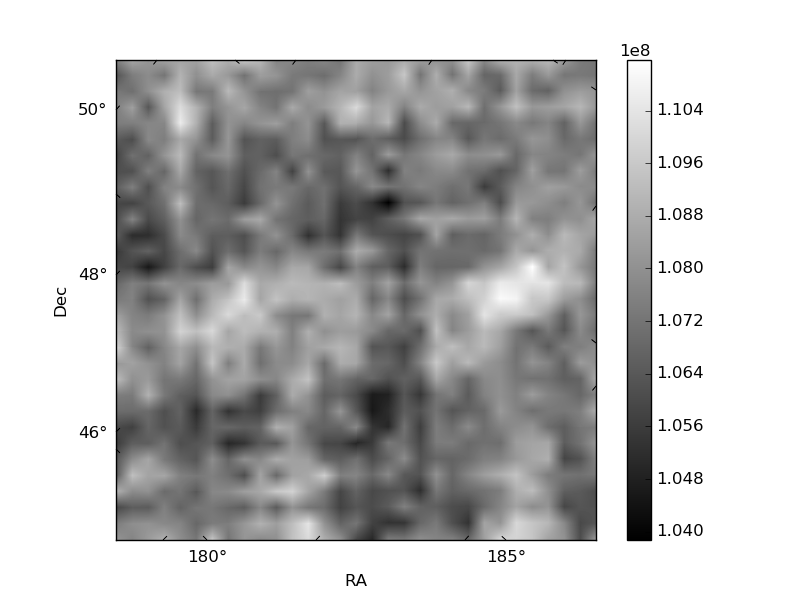
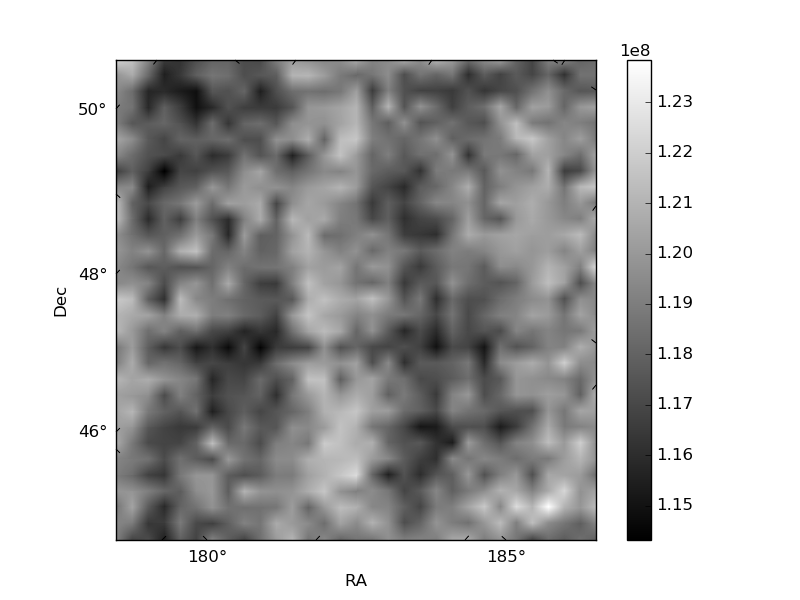
Histogram calculated using DETX and DETY for each event in the final _common_clean file
| Quadrant A | 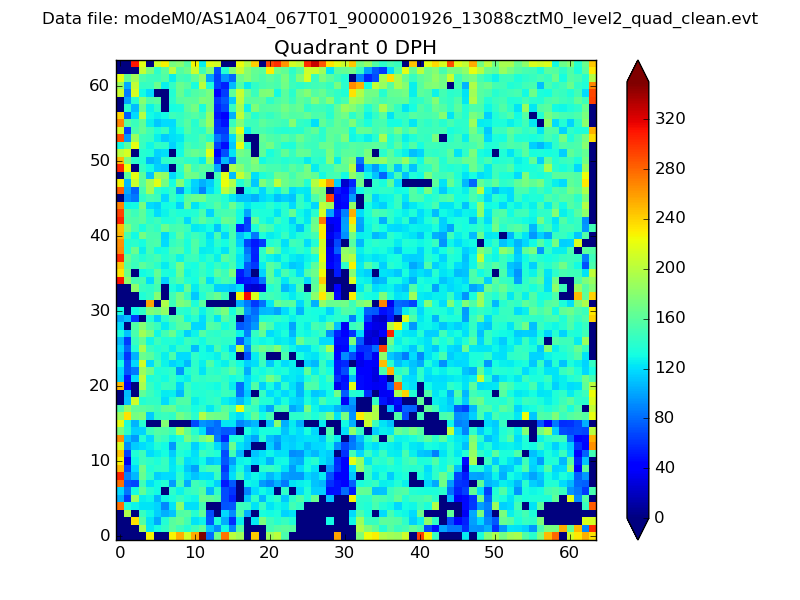 |
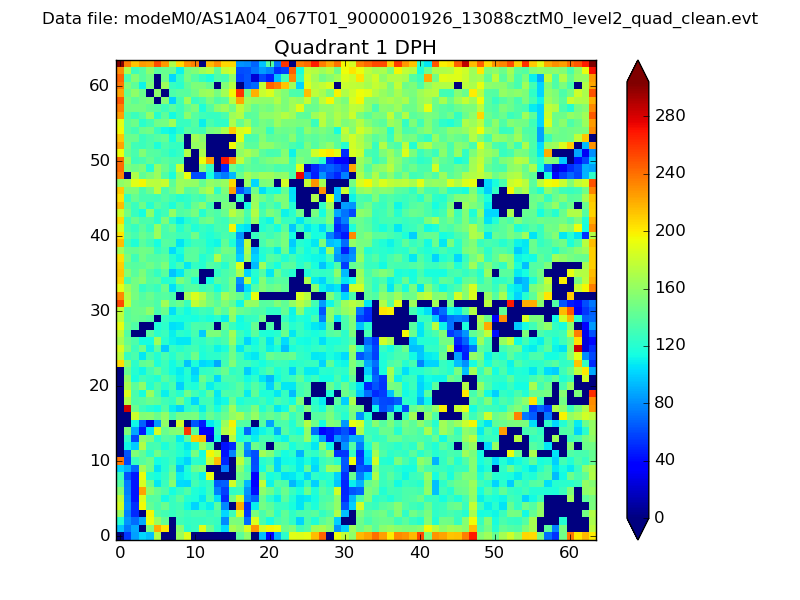 |
Quadrant B |
|---|---|---|---|
| Quadrant D | 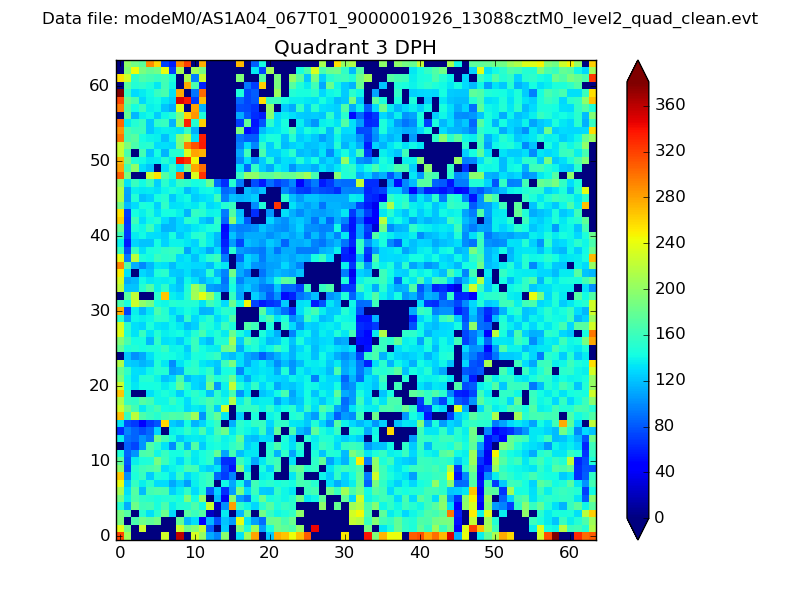 |
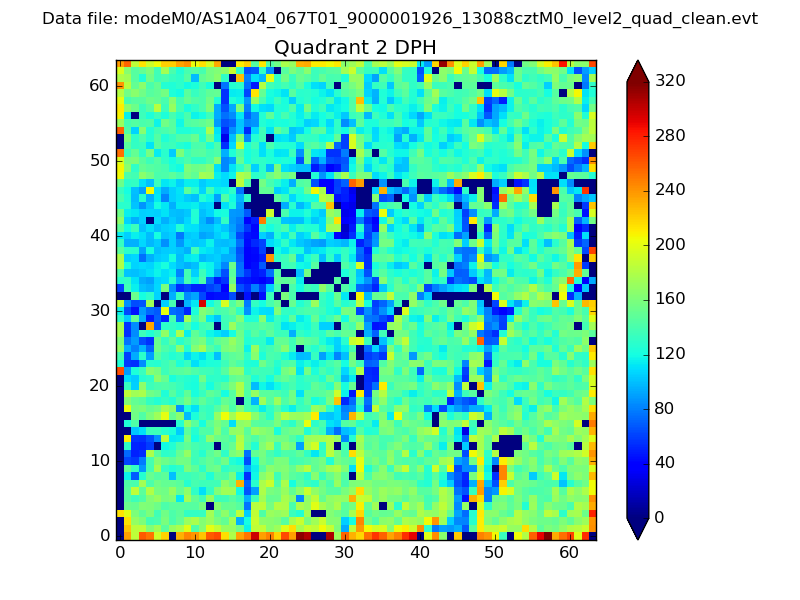 |
Quadrant C |
| Plot type | Count rate plots | Images |
|---|---|---|
| Comparison with Poisson distribution Blue bars denote a histogram of data divided into 1 sec bins. Red curve is a Poisson curve with rate = median count rate of data. |
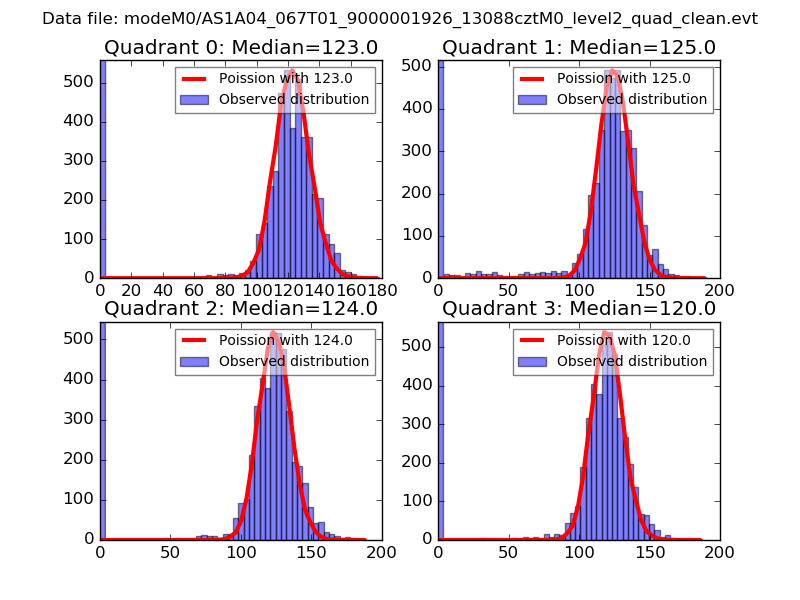 |
 |
| Quadrant-wise count rates Data is divided into 100 sec bins |
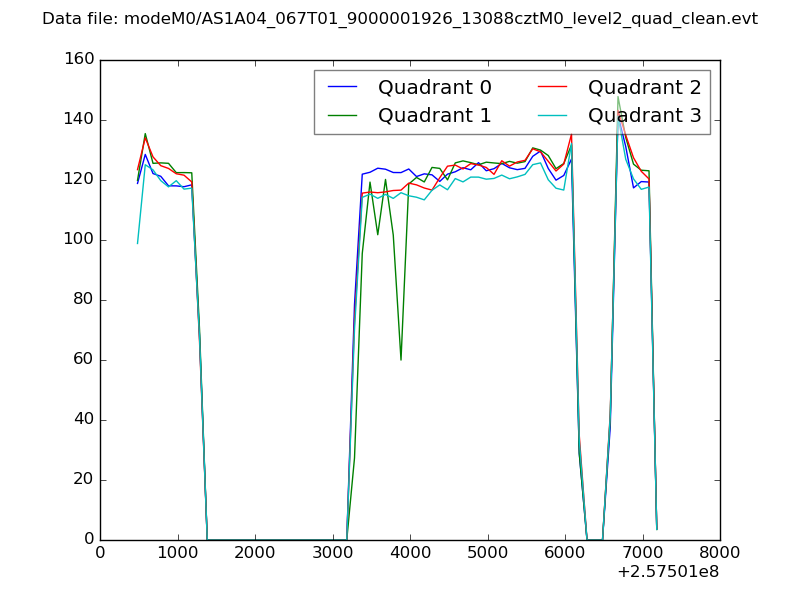 |
|
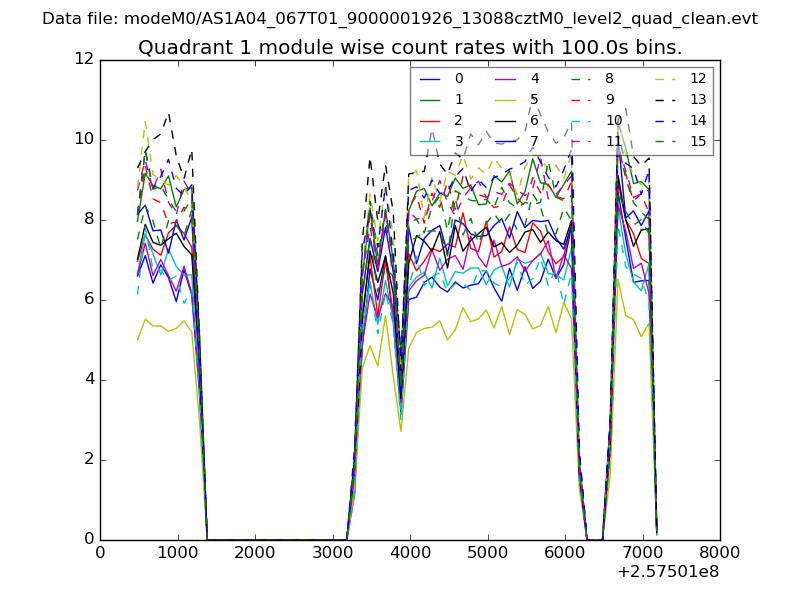
| Module-wise count rates for Quadrant A Data is divided into 100 sec bins |
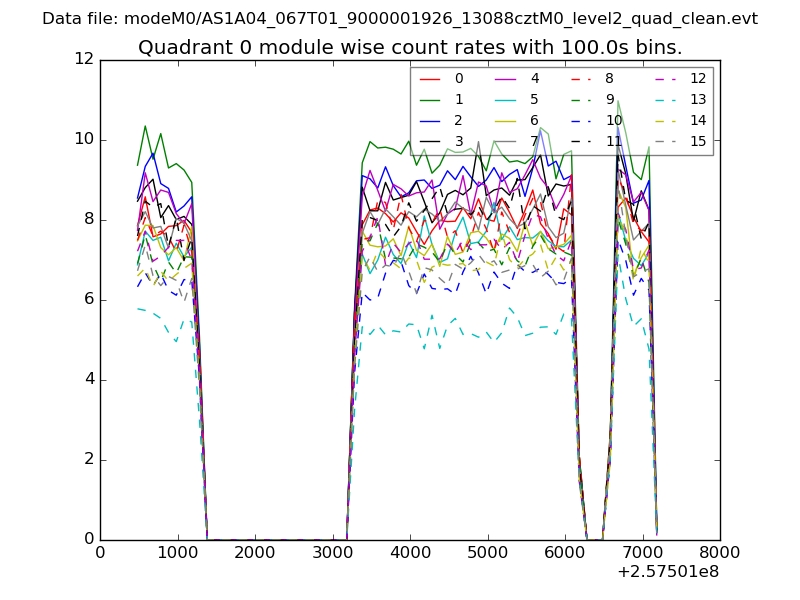 |
 |
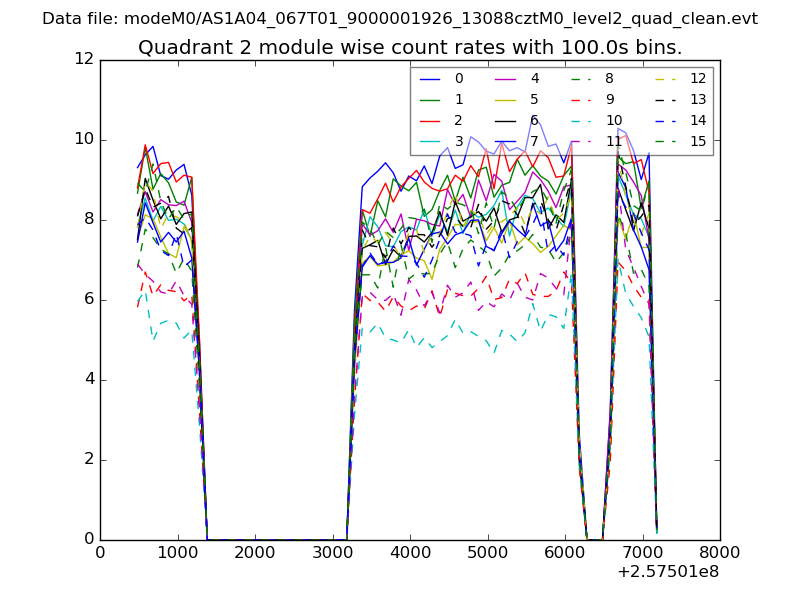
| Module-wise count rates for Quadrant B Data is divided into 100 sec bins |
 |
 |
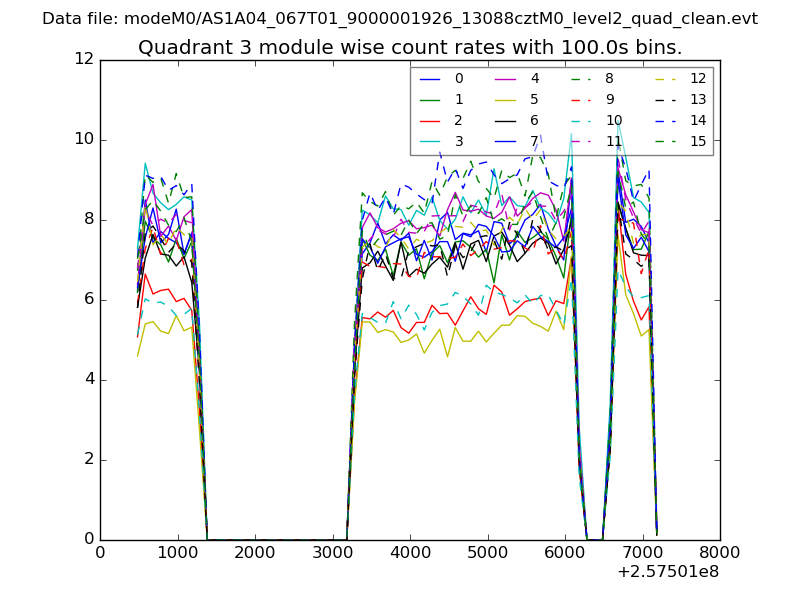
| Module-wise count rates for Quadrant C Data is divided into 100 sec bins |
 |
 |
| Module-wise count rates for Quadrant D Data is divided into 100 sec bins |
 |
 |
| Parameter | Plot |
|---|---|
| CZT HV Monitor | 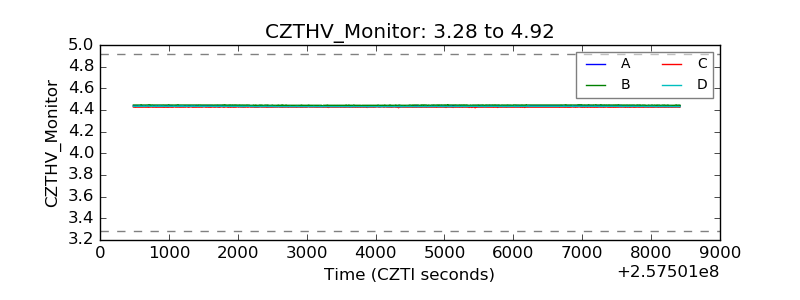 |
| D_VDD | 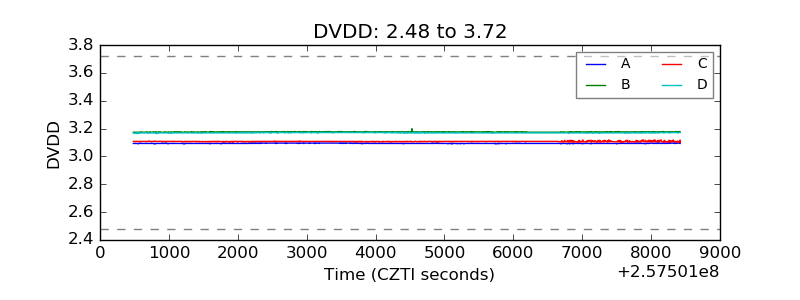 |
| Temperature 1 | 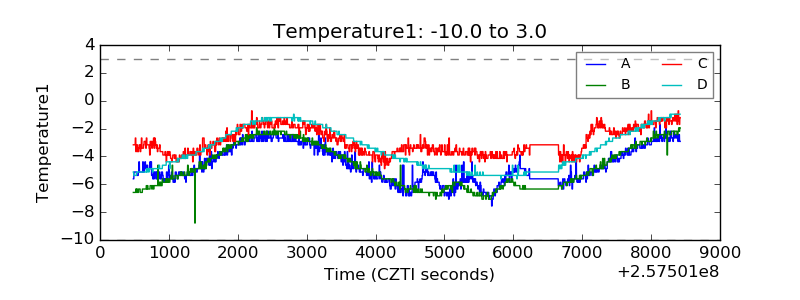 |
| Veto HV Monitor | 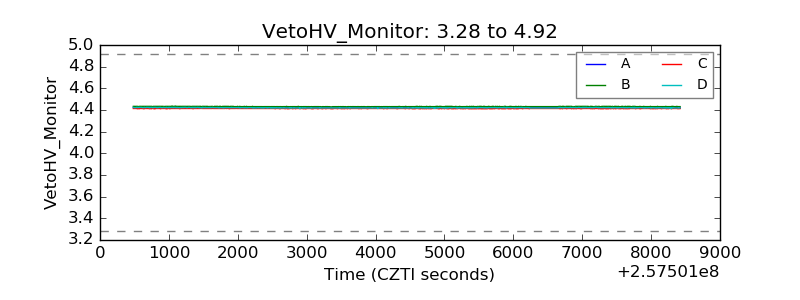 |
| Veto LLD | 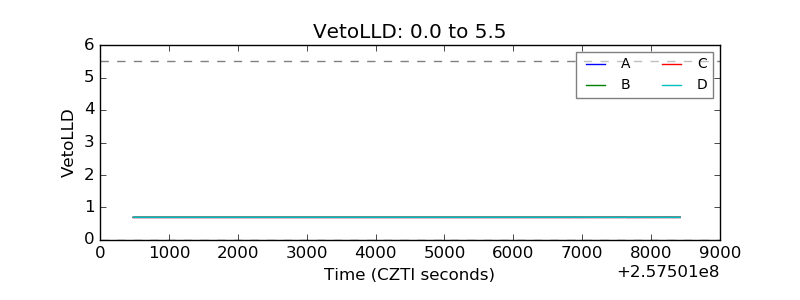 |
| Alpha Counter | 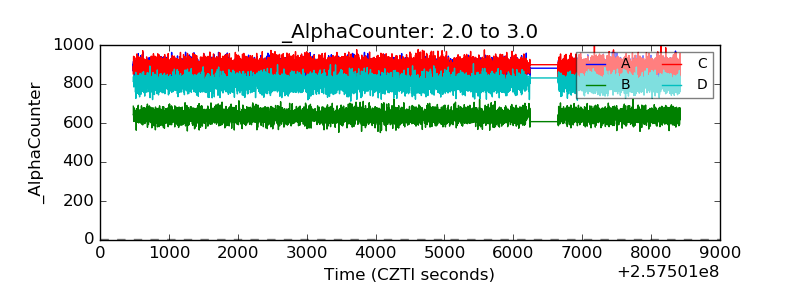 |
| _CPM_Rate | 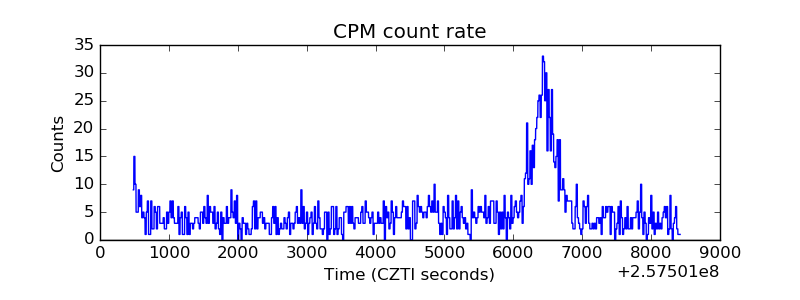 |
| CZT Counter | 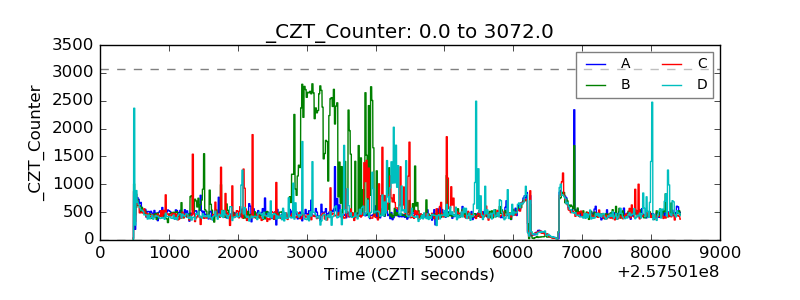 |
| +2.5 Volts monitor | 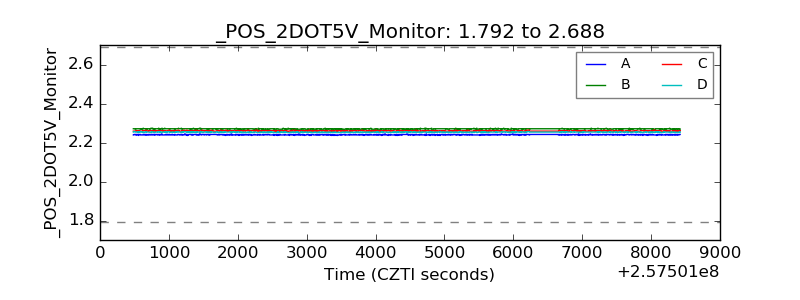 |
| +5 Volts monitor |  |
| _ROLL_ROT | 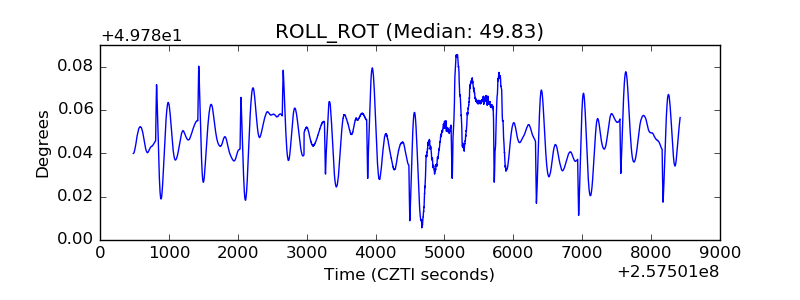 |
| _Roll_DEC | 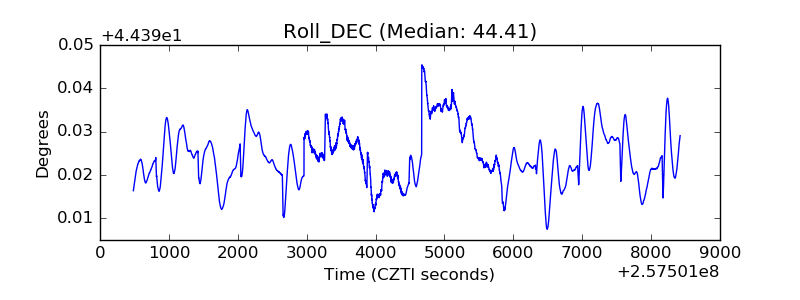 |
| _Roll_RA | 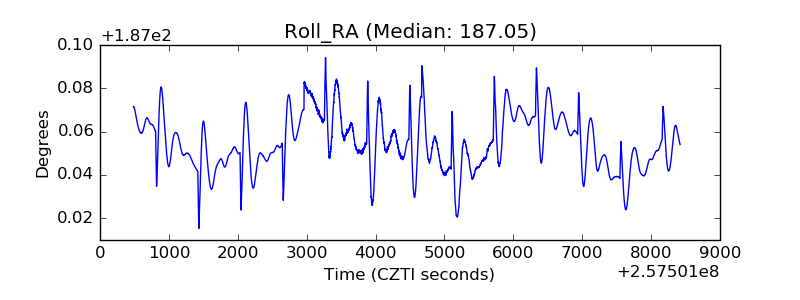 |
| Veto Counter | 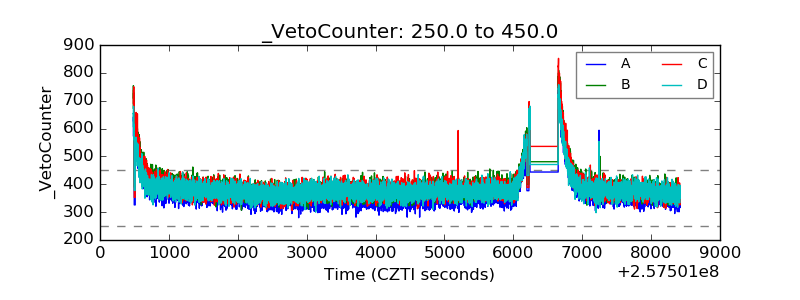 |