| Param | Original file | Final file |
|---|---|---|
| Filename | modeM0/AS1A04_067T01_9000001926_13093cztM0_level2.evt | modeM0/AS1A04_067T01_9000001926_13093cztM0_level2_quad_clean.evt |
| Size (bytes) | 230,794,560 | 36,973,440 |
| Size | 220.1 MB | 35.3 MB |
| Events in quadrant A | 1,431,758 | 231,885 |
| Events in quadrant B | 1,946,852 | 212,901 |
| Events in quadrant C | 1,872,959 | 228,611 |
| Events in quadrant D | 1,522,487 | 221,983 |
| Mode SS | |||
|---|---|---|---|
| Quadrant | BADHDUFLAG | Total packets | Discarded packets |
| A | 0 | 64 | 0 |
| B | 0 | 64 | 0 |
| C | 0 | 64 | 0 |
| D | 0 | 64 | 0 |
| Mode M0 | |||
|---|---|---|---|
| Quadrant | BADHDUFLAG | Total packets | Discarded packets |
| A | 0 | 6344 | 0 |
| B | 0 | 7881 | 0 |
| C | 0 | 7767 | 0 |
| D | 0 | 6705 | 0 |
| Quadrant | Total seconds | Saturated seconds | Saturation percentage |
|---|---|---|---|
| A | 3139 | 3 | 0.095572% |
| B | 3139 | 258 | 8.219178% |
| C | 3139 | 123 | 3.918445% |
| D | 3139 | 14 | 0.446002% |
Noise dominated data is calculated using 1-second bins in cleaned event files. If a bin has >2000 counts, and if more than 50% of those come from <1% of pixels, then it is considered to be noise-dominated and hence unusable.
| Quadrant | # 1 sec bins | Bins with >0 counts | Bins with >2000 counts | High rate bins dominated by noise | Noise dominated (total time) | Noise dominated (detector-on time) | Marked lightcurve |
|---|---|---|---|---|---|---|---|
| A | 3140 | 3140 | 0 | 0 | 0.00% | 0.00% | 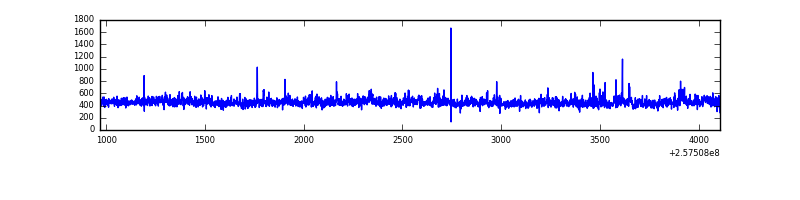 |
| B | 3140 | 3140 | 120 | 120 | 3.82% | 3.82% |  |
| C | 3140 | 3140 | 98 | 98 | 3.12% | 3.12% | 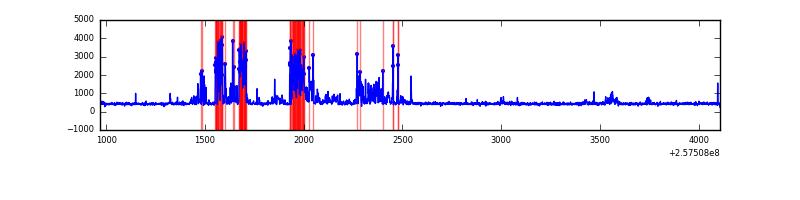 |
| D | 3140 | 3140 | 12 | 12 | 0.38% | 0.38% | 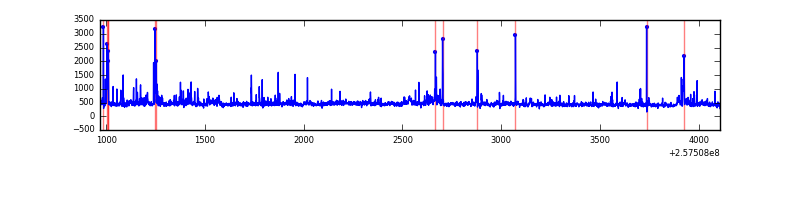 |
Top three noisy pixels from each quadrant. If the there are fewer than three noisy pixels in the level2.evt file, extra rows are filled as -1
| Pixel properties | Quadrant properties | ||||||
|---|---|---|---|---|---|---|---|
| Quadrant | DetID | PixID | Counts | Sigma | Mean | Median | Sigma |
| A | 12 | 189 | 53581 | 740.58 | 346 | 339 | 71.9 |
| A | 8 | 15 | 16737 | 228.09 | 346 | 339 | 71.9 |
| A | 5 | 16 | 10467 | 140.88 | 346 | 339 | 71.9 |
| B | 4 | 239 | 512188 | 8097.86 | 327 | 319 | 63.2 |
| B | 3 | 64 | 80674 | 1271.23 | 327 | 319 | 63.2 |
| B | 3 | 209 | 26965 | 421.54 | 327 | 319 | 63.2 |
| C | 15 | 208 | 554584 | 7025.76 | 334 | 336 | 78.9 |
| C | 14 | 234 | 5281 | 62.68 | 334 | 336 | 78.9 |
| C | 8 | 128 | 5061 | 59.9 | 334 | 336 | 78.9 |
| D | 1 | 52 | 208025 | 2473.78 | 338 | 327 | 84.0 |
| D | 2 | 234 | 22533 | 264.48 | 338 | 327 | 84.0 |
| D | 13 | 172 | 7396 | 84.19 | 338 | 327 | 84.0 |
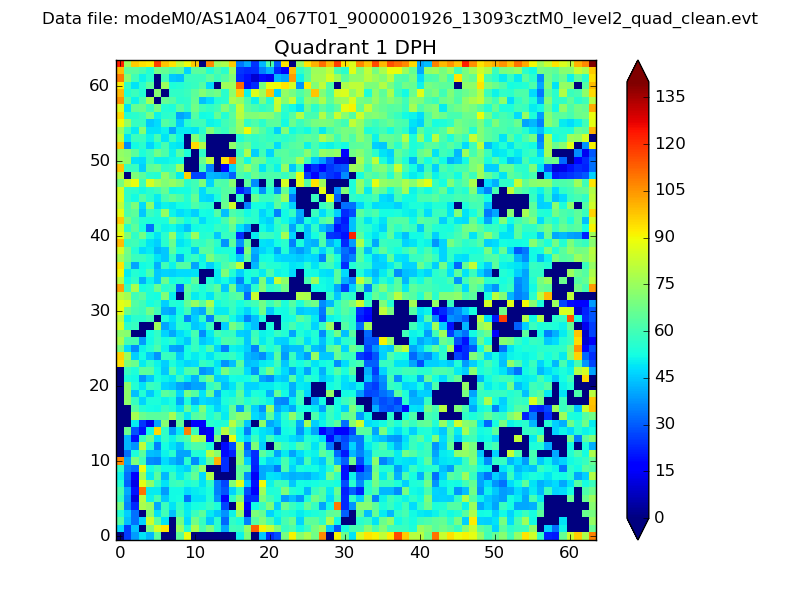
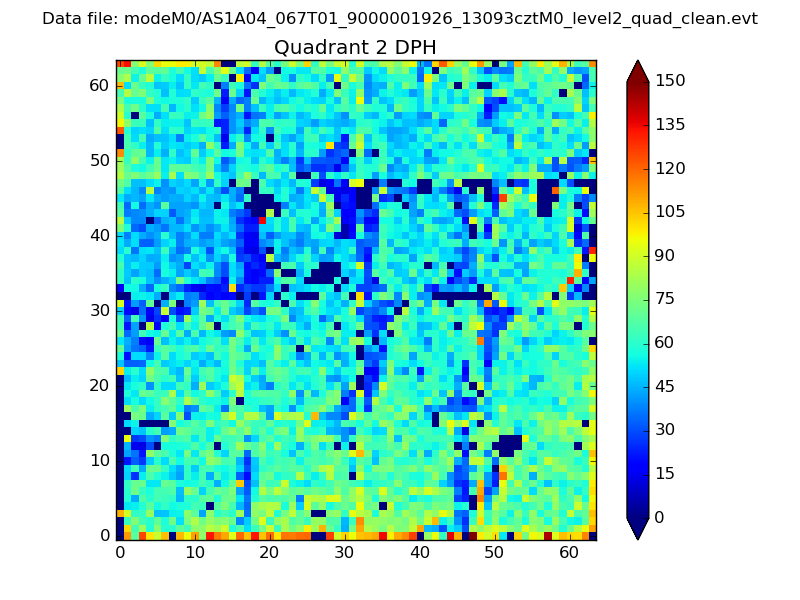
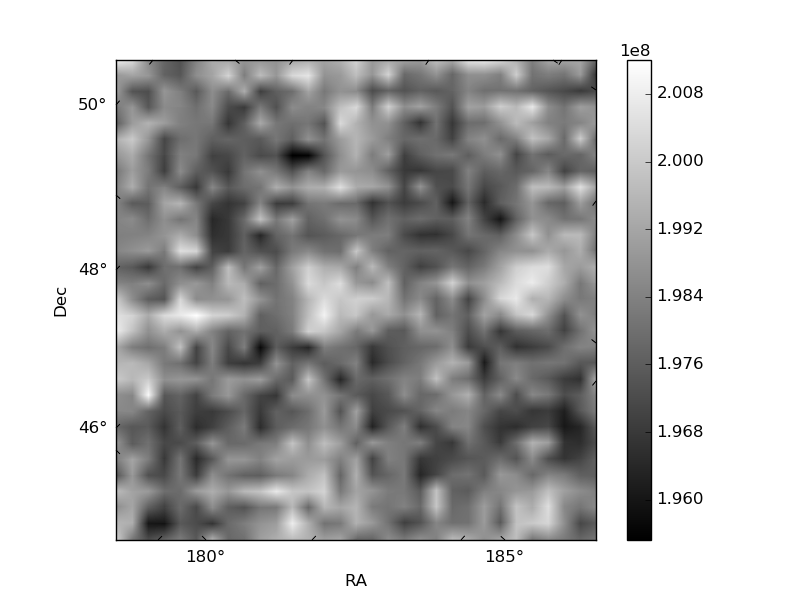
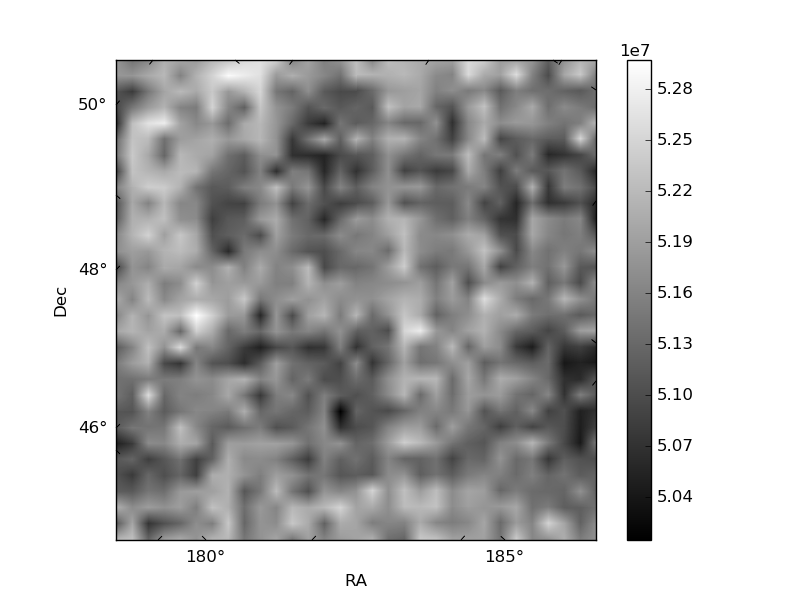
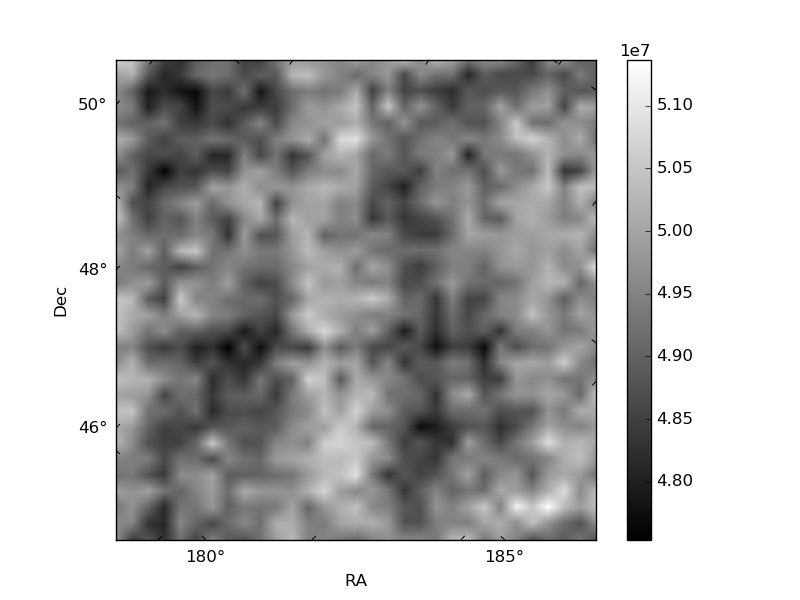
Histogram calculated using DETX and DETY for each event in the final _common_clean file
| Quadrant A | 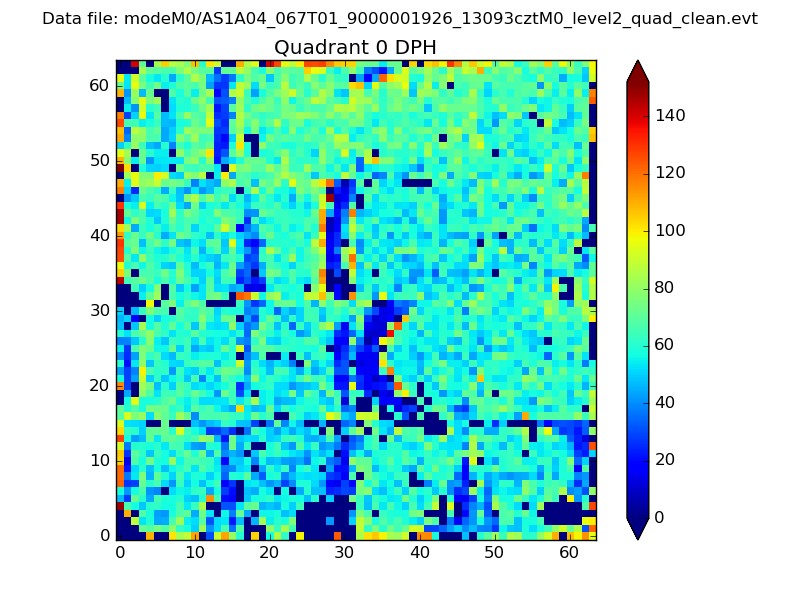 |
 |
Quadrant B |
|---|---|---|---|
| Quadrant D | 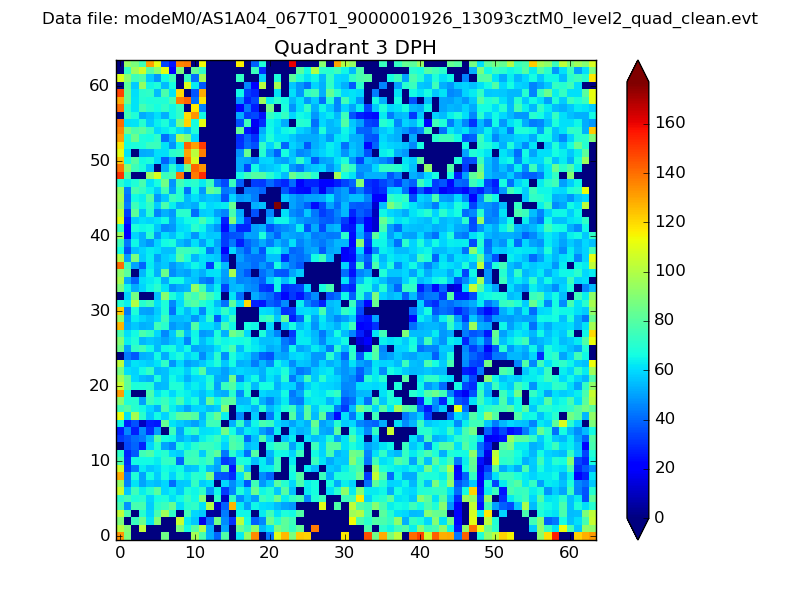 |
 |
Quadrant C |
| Plot type | Count rate plots | Images |
|---|---|---|
| Comparison with Poisson distribution Blue bars denote a histogram of data divided into 1 sec bins. Red curve is a Poisson curve with rate = median count rate of data. |
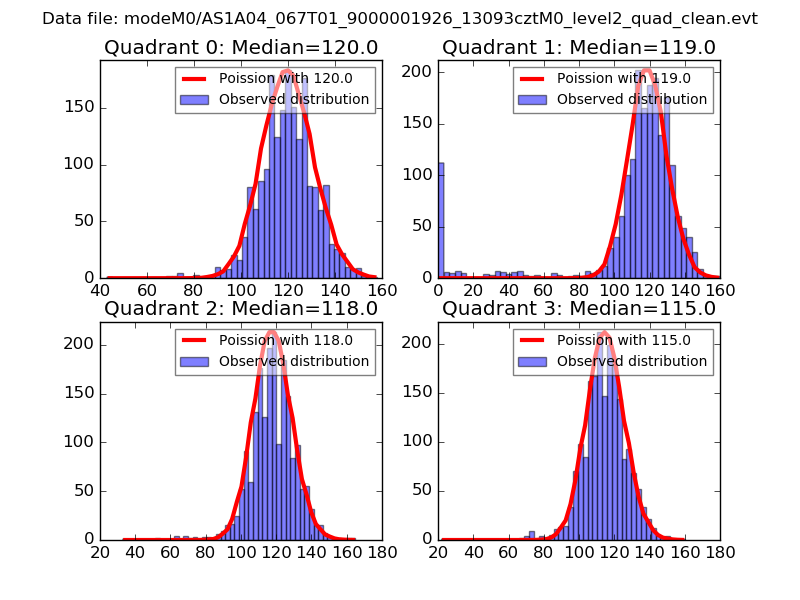 |
 |
| Quadrant-wise count rates Data is divided into 100 sec bins |
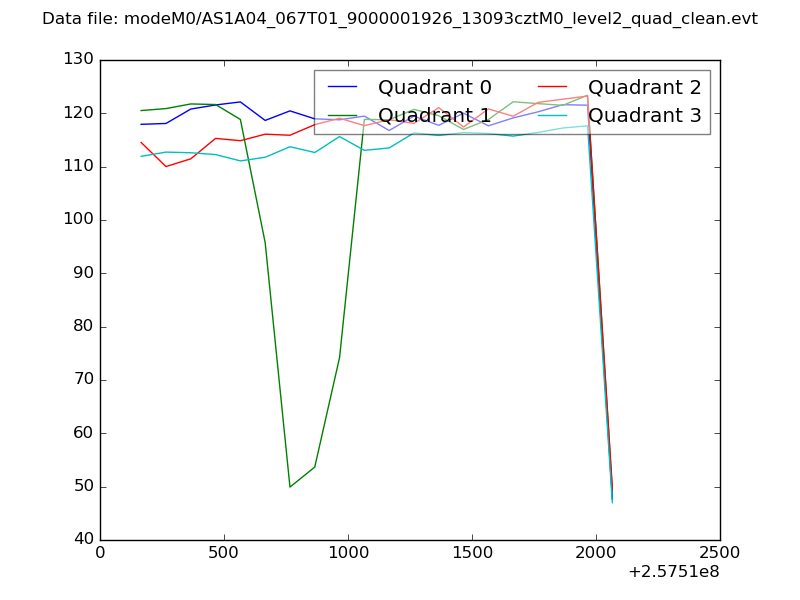 |
|
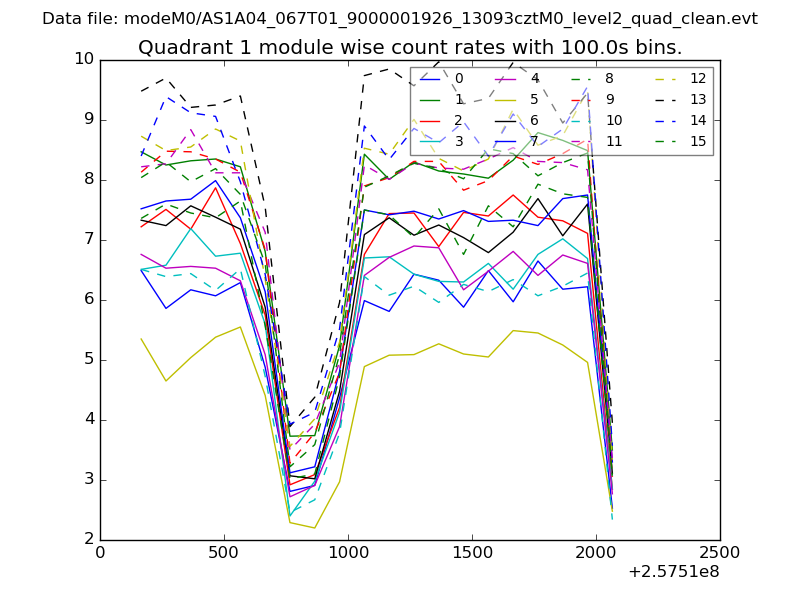
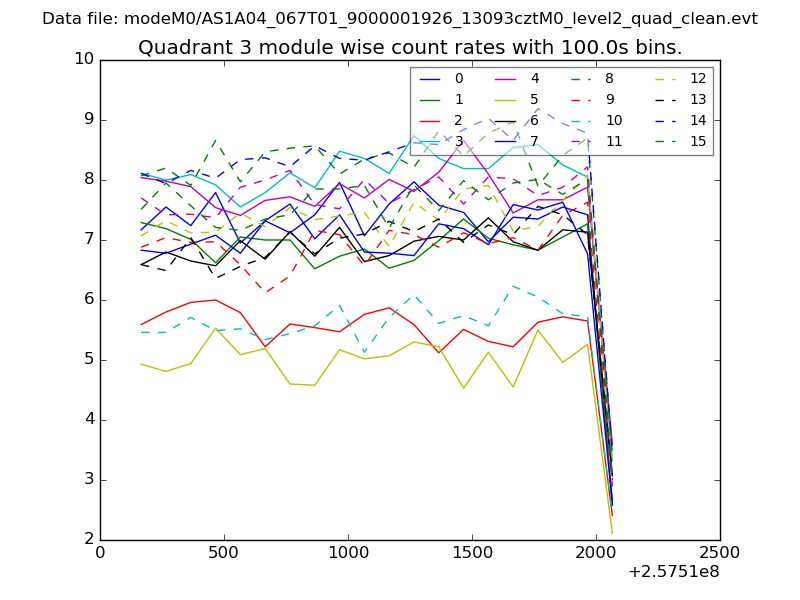
| Module-wise count rates for Quadrant A Data is divided into 100 sec bins |
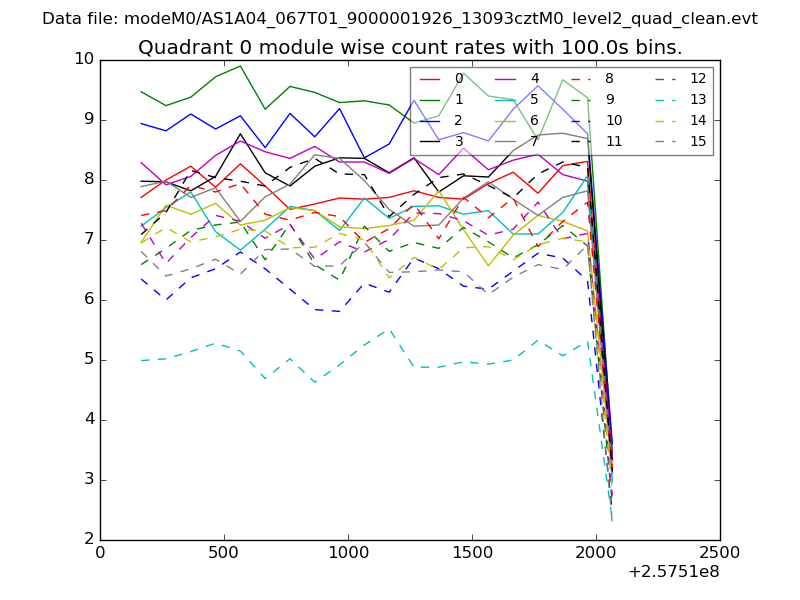 |
 |
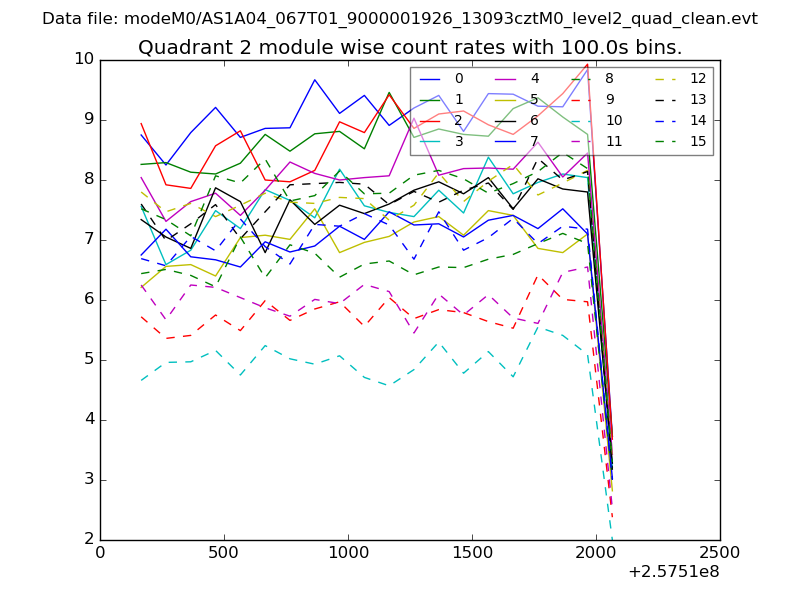
| Module-wise count rates for Quadrant B Data is divided into 100 sec bins |
 |
 |
| Module-wise count rates for Quadrant C Data is divided into 100 sec bins |
 |
 |
| Module-wise count rates for Quadrant D Data is divided into 100 sec bins |
 |
 |
| Parameter | Plot |
|---|---|
| CZT HV Monitor | 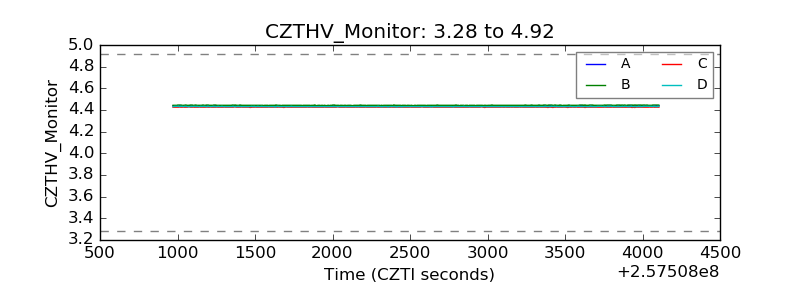 |
| D_VDD | 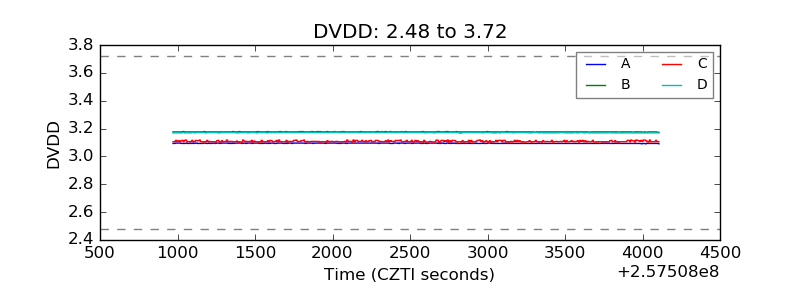 |
| Temperature 1 | 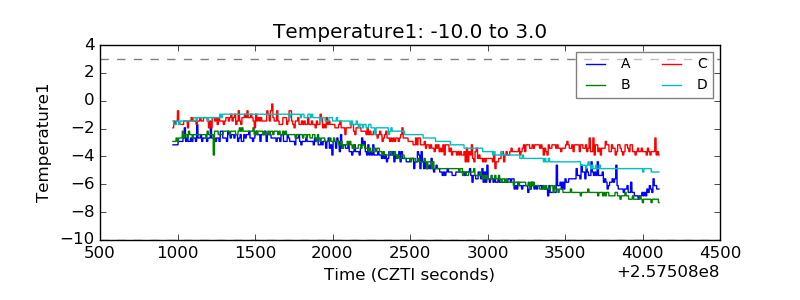 |
| Veto HV Monitor | 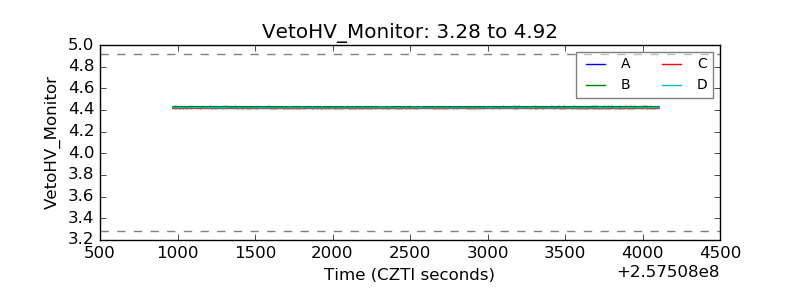 |
| Veto LLD | 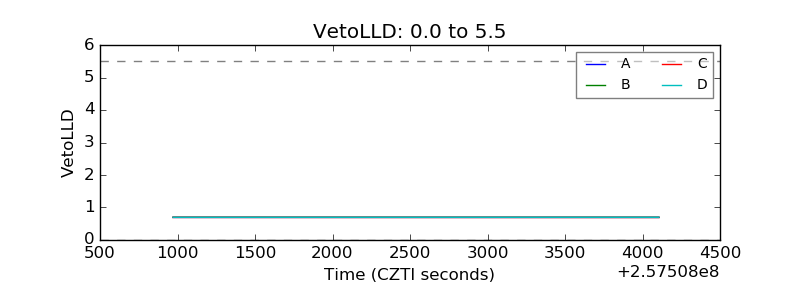 |
| Alpha Counter | 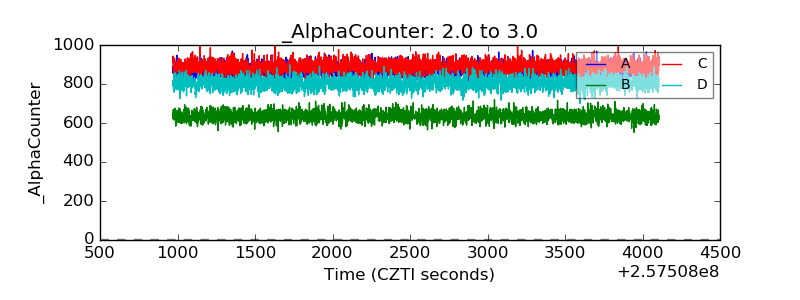 |
| _CPM_Rate | 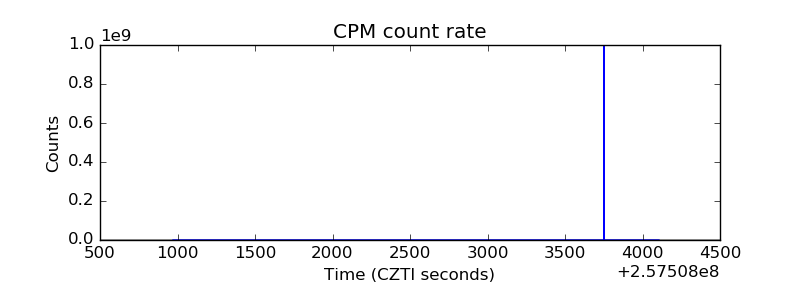 |
| CZT Counter | 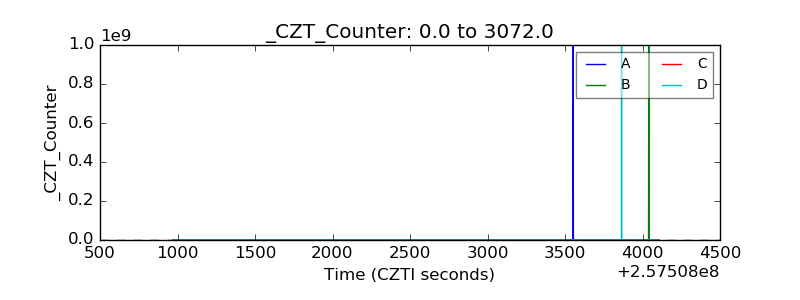 |
| +2.5 Volts monitor |  |
| +5 Volts monitor |  |
| _ROLL_ROT | 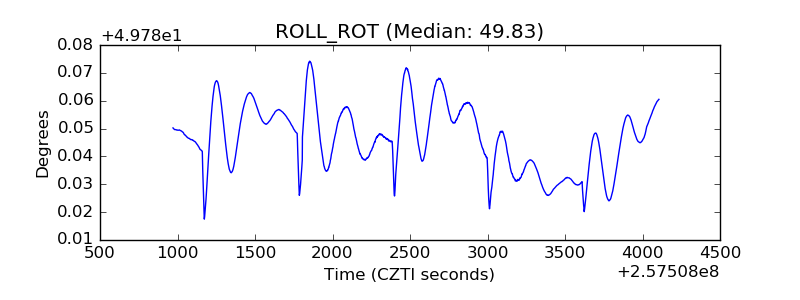 |
| _Roll_DEC | 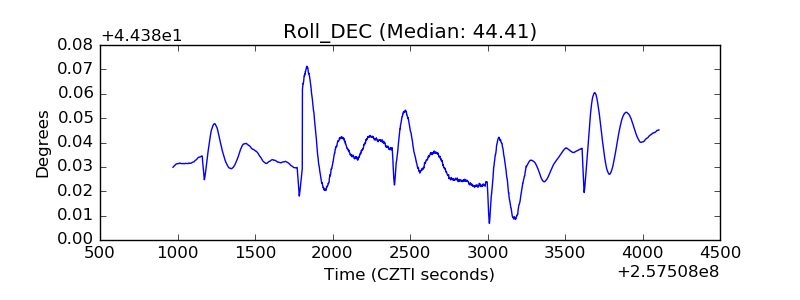 |
| _Roll_RA | 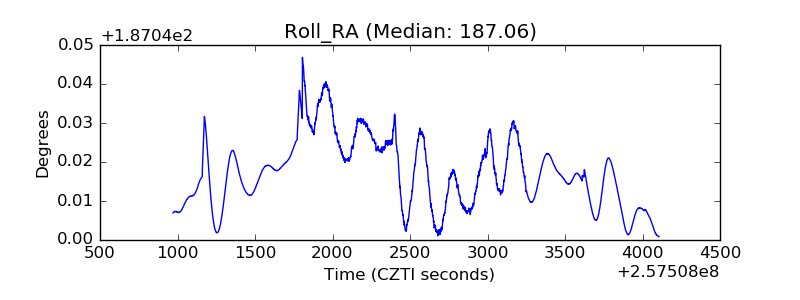 |
| Veto Counter | 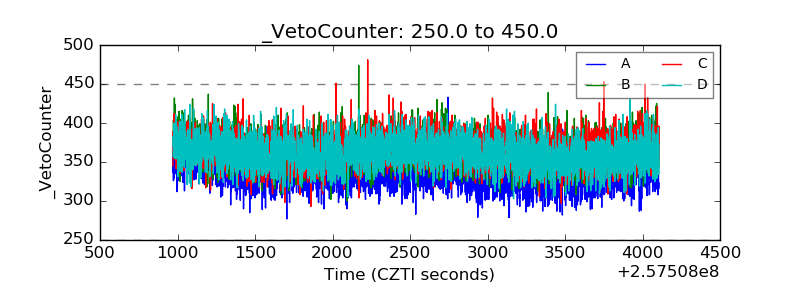 |