| Param | Original file | Final file |
|---|---|---|
| Filename | modeM0/AS1A04_176T02_9000001924cztM0_level2.fits | modeM0/AS1A04_176T02_9000001924cztM0_level2_quad_clean.evt |
| Size (bytes) | 310,155,840 | 262,846,080 |
| Size | 295.8 MB | 250.7 MB |
| Events in quadrant A | 2,015,024 | 1,666,380 |
| Events in quadrant B | 1,606,052 | 1,341,634 |
| Events in quadrant C | 2,002,136 | 1,596,977 |
| Events in quadrant D | 1,318,790 | 914,009 |
| Mode M9 | |||
|---|---|---|---|
| Quadrant | BADHDUFLAG | Total packets | Discarded packets |
| A | 0 | 48 | 0 |
| B | 0 | 48 | 0 |
| C | 0 | 48 | 0 |
| D | 0 | 48 | 0 |
| Mode M0 | |||
|---|---|---|---|
| Quadrant | BADHDUFLAG | Total packets | Discarded packets |
| A | 0 | 77640 | 0 |
| B | 0 | 132936 | 0 |
| C | 0 | 73545 | 0 |
| D | 0 | 180209 | 0 |
| Mode SS | |||
|---|---|---|---|
| Quadrant | BADHDUFLAG | Total packets | Discarded packets |
| A | 0 | 724 | 0 |
| B | 0 | 724 | 0 |
| C | 0 | 724 | 0 |
| D | 0 | 724 | 0 |
| Quadrant | Total seconds | Saturated seconds | Saturation percentage |
|---|---|---|---|
| A | 35515 | 803 | 2.261016% |
| B | 35517 | 9407 | 26.485908% |
| C | 35517 | 402 | 1.131852% |
| D | 35515 | 14482 | 40.777136% |
Noise dominated data is calculated using 1-second bins in cleaned event files. If a bin has >2000 counts, and if more than 50% of those come from <1% of pixels, then it is considered to be noise-dominated and hence unusable.
| Quadrant | # 1 sec bins | Bins with >0 counts | Bins with >2000 counts | High rate bins dominated by noise | Noise dominated (total time) | Noise dominated (detector-on time) | Marked lightcurve |
|---|---|---|---|---|---|---|---|
| A | 40372 | 35504 | 0 | 0 | 0.00% | 0.00% |  |
| B | 40372 | 34096 | 0 | 0 | 0.00% | 0.00% |  |
| C | 40372 | 35517 | 0 | 0 | 0.00% | 0.00% |  |
| D | 40372 | 35428 | 0 | 0 | 0.00% | 0.00% |  |
Top three noisy pixels from each quadrant. If the there are fewer than three noisy pixels in the level2.evt file, extra rows are filled as -1
| Pixel properties | Quadrant properties | ||||||
|---|---|---|---|---|---|---|---|
| Quadrant | DetID | PixID | Counts | Sigma | Mean | Median | Sigma |
| A | 0 | 29 | 1928 | 10.97 | 524 | 491 | 131.0 |
| A | 7 | 110 | 1661 | 8.93 | 524 | 491 | 131.0 |
| A | 9 | 19 | 1513 | 7.8 | 524 | 491 | 131.0 |
| B | 2 | 9 | 1341 | 10.86 | 424 | 403 | 86.4 |
| B | 14 | 254 | 1130 | 8.41 | 424 | 403 | 86.4 |
| B | 5 | 128 | 1077 | 7.8 | 424 | 403 | 86.4 |
| C | 12 | 241 | 1372 | 6.38 | 529 | 490 | 138.1 |
| C | 9 | 188 | 1359 | 6.29 | 529 | 490 | 138.1 |
| C | 7 | 111 | 1332 | 6.1 | 529 | 490 | 138.1 |
| D | 10 | 189 | 938 | 5.93 | 376 | 344 | 100.2 |
| D | 6 | 231 | 932 | 5.87 | 376 | 344 | 100.2 |
| D | 4 | 160 | 908 | 5.63 | 376 | 344 | 100.2 |
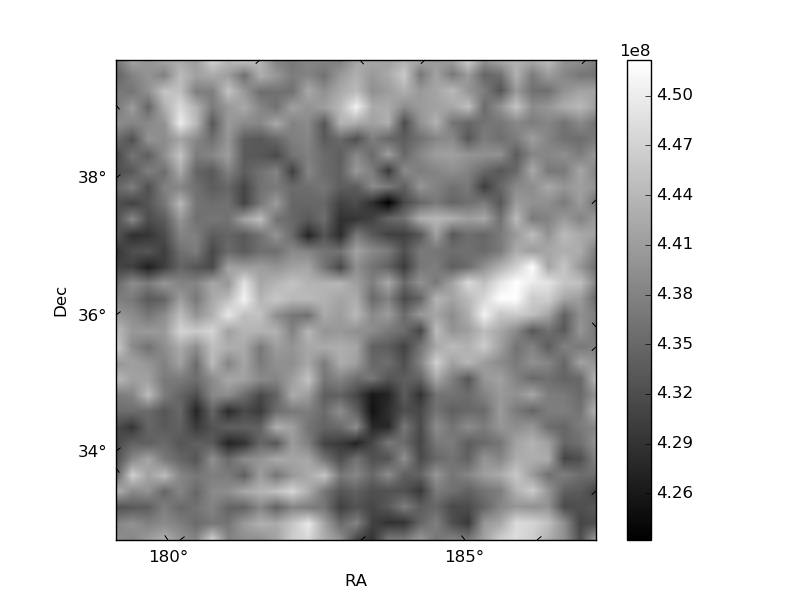
Histogram calculated using DETX and DETY for each event in the final _common_clean file
| Quadrant A | 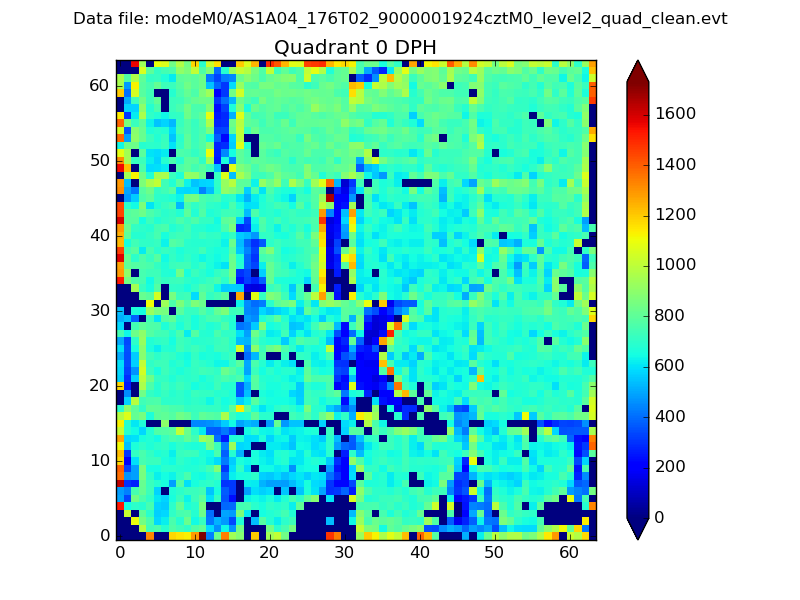 |
 |
Quadrant B |
|---|---|---|---|
| Quadrant D |  |
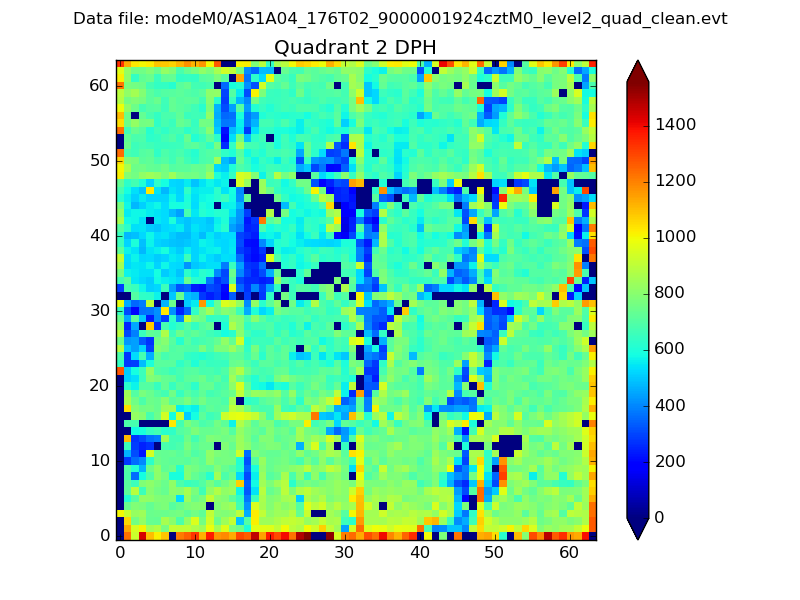 |
Quadrant C |
| Plot type | Count rate plots | Images |
|---|---|---|
| Comparison with Poisson distribution Blue bars denote a histogram of data divided into 1 sec bins. Red curve is a Poisson curve with rate = median count rate of data. |
 |
 |
| Quadrant-wise count rates Data is divided into 100 sec bins |
 |
|
| Module-wise count rates for Quadrant A Data is divided into 100 sec bins |
 |
 |
| Module-wise count rates for Quadrant B Data is divided into 100 sec bins |
 |
 |
| Module-wise count rates for Quadrant C Data is divided into 100 sec bins |
 |
 |
| Module-wise count rates for Quadrant D Data is divided into 100 sec bins |
 |
 |
| Parameter | Plot |
|---|---|
| CZT HV Monitor |  |
| D_VDD | 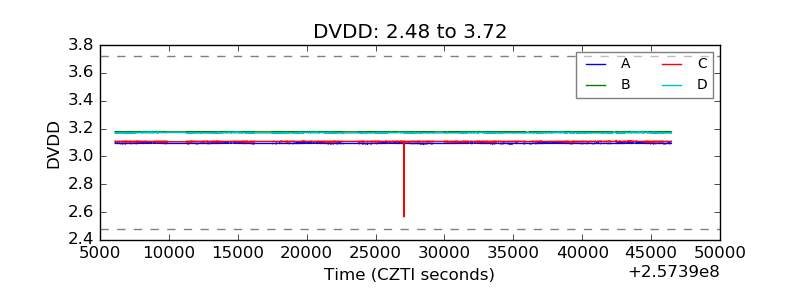 |
| Temperature 1 |  |
| Veto HV Monitor |  |
| Veto LLD |  |
| Alpha Counter |  |
| _CPM_Rate | 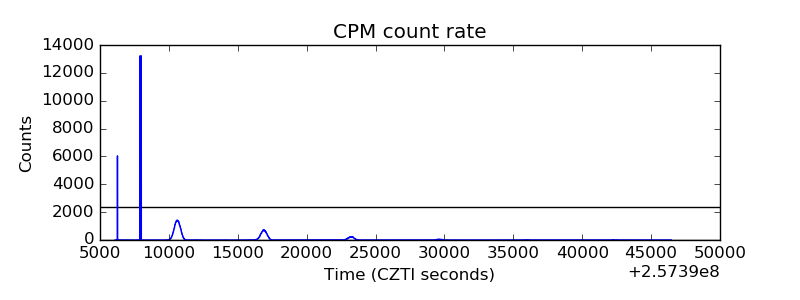 |
| CZT Counter |  |
| +2.5 Volts monitor | 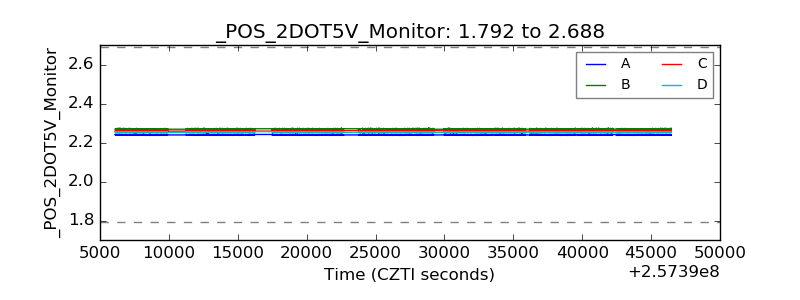 |
| +5 Volts monitor |  |
| _ROLL_ROT |  |
| _Roll_DEC |  |
| _Roll_RA | 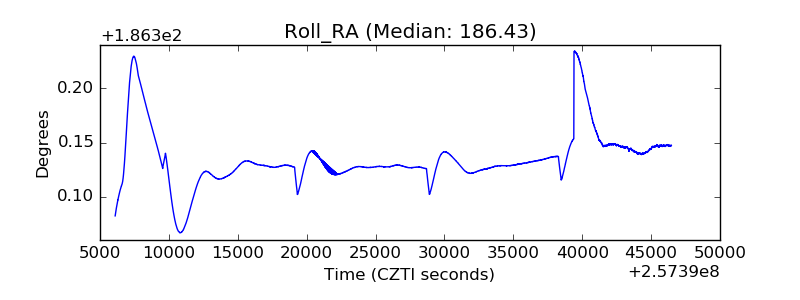 |
| Veto Counter |  |