| Param | Original file | Final file |
|---|---|---|
| Filename | modeM0/AS1A04_176T02_9000001924_13069cztM0_level2.evt | modeM0/AS1A04_176T02_9000001924_13069cztM0_level2_quad_clean.evt |
| Size (bytes) | 27,457,920 | 8,510,400 |
| Size | 26.2 MB | 8.1 MB |
| Events in quadrant A | 196,441 | 53,912 |
| Events in quadrant B | 207,787 | 56,367 |
| Events in quadrant C | 181,050 | 56,635 |
| Events in quadrant D | 214,846 | 53,593 |
| Mode M0 | |||
|---|---|---|---|
| Quadrant | BADHDUFLAG | Total packets | Discarded packets |
| A | 0 | 840 | 1 |
| B | 0 | 876 | 0 |
| C | 0 | 824 | 0 |
| D | 0 | 863 | 0 |
| Mode SS | |||
|---|---|---|---|
| Quadrant | BADHDUFLAG | Total packets | Discarded packets |
| A | 0 | 8 | 0 |
| B | 0 | 8 | 0 |
| C | 0 | 8 | 0 |
| D | 0 | 8 | 0 |
| Quadrant | Total seconds | Saturated seconds | Saturation percentage |
|---|---|---|---|
| A | 411 | 0 | 0.000000% |
| B | 411 | 6 | 1.459854% |
| C | 411 | 0 | 0.000000% |
| D | 411 | 0 | 0.000000% |
Noise dominated data is calculated using 1-second bins in cleaned event files. If a bin has >2000 counts, and if more than 50% of those come from <1% of pixels, then it is considered to be noise-dominated and hence unusable.
| Quadrant | # 1 sec bins | Bins with >0 counts | Bins with >2000 counts | High rate bins dominated by noise | Noise dominated (total time) | Noise dominated (detector-on time) | Marked lightcurve |
|---|---|---|---|---|---|---|---|
| A | 412 | 412 | 0 | 0 | 0.00% | 0.00% |  |
| B | 412 | 412 | 3 | 3 | 0.73% | 0.73% |  |
| C | 412 | 412 | 0 | 0 | 0.00% | 0.00% |  |
| D | 412 | 412 | 1 | 1 | 0.24% | 0.24% |  |
Top three noisy pixels from each quadrant. If the there are fewer than three noisy pixels in the level2.evt file, extra rows are filled as -1
| Pixel properties | Quadrant properties | ||||||
|---|---|---|---|---|---|---|---|
| Quadrant | DetID | PixID | Counts | Sigma | Mean | Median | Sigma |
| A | 12 | 189 | 9722 | 832.0 | 47 | 46 | 11.6 |
| A | 1 | 162 | 2094 | 176.1 | 47 | 46 | 11.6 |
| A | 1 | 178 | 893 | 72.83 | 47 | 46 | 11.6 |
| B | 4 | 239 | 17986 | 1594.3 | 47 | 46 | 11.3 |
| B | 0 | 219 | 2810 | 245.63 | 47 | 46 | 11.3 |
| B | 0 | 214 | 1369 | 117.57 | 47 | 46 | 11.3 |
| C | 13 | 61 | 353 | 23.48 | 46 | 46 | 13.1 |
| C | 3 | 202 | 150 | 7.95 | 46 | 46 | 13.1 |
| C | 1 | 5 | 134 | 6.73 | 46 | 46 | 13.1 |
| D | 1 | 52 | 28567 | 2194.96 | 45 | 44 | 13.0 |
| D | 10 | 157 | 13959 | 1070.82 | 45 | 44 | 13.0 |
| D | 2 | 234 | 1410 | 105.12 | 45 | 44 | 13.0 |
Histogram calculated using DETX and DETY for each event in the final _common_clean file
| Quadrant A |  |
 |
Quadrant B |
|---|---|---|---|
| Quadrant D |  |
 |
Quadrant C |
| Plot type | Count rate plots | Images |
|---|---|---|
| Comparison with Poisson distribution Blue bars denote a histogram of data divided into 1 sec bins. Red curve is a Poisson curve with rate = median count rate of data. |
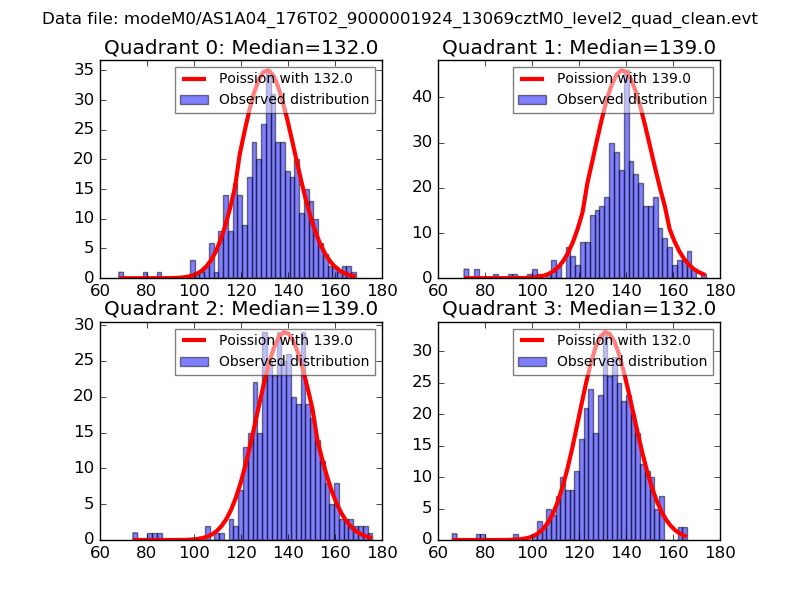 |
 |
| Quadrant-wise count rates Data is divided into 100 sec bins |
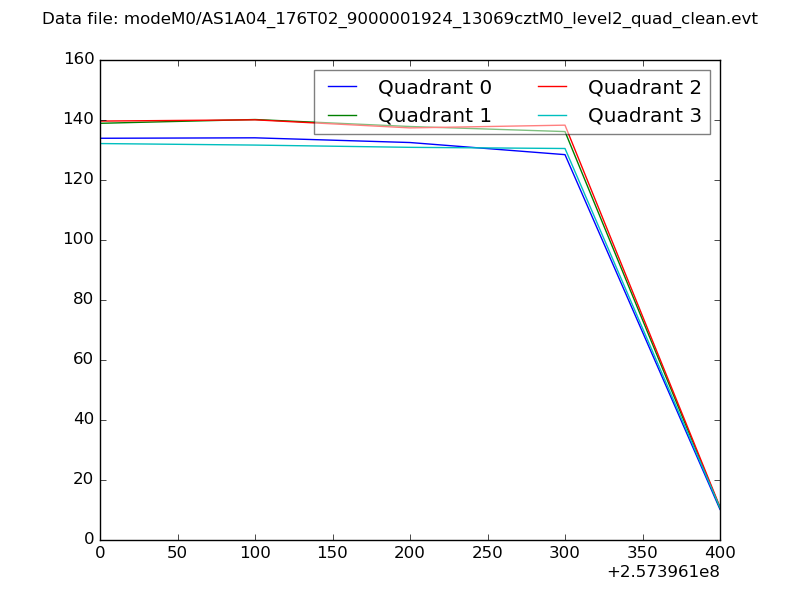 |
|
| Module-wise count rates for Quadrant A Data is divided into 100 sec bins |
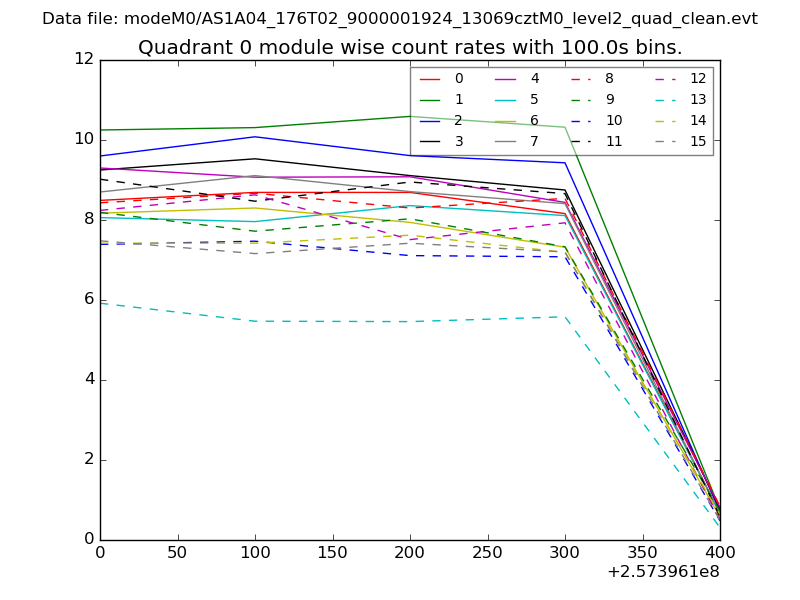 |
 |
| Module-wise count rates for Quadrant B Data is divided into 100 sec bins |
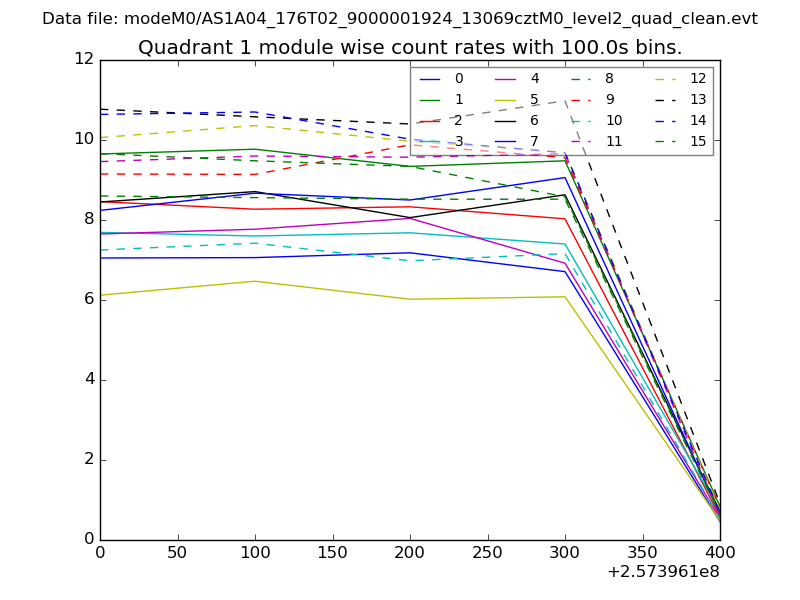 |
 |
| Module-wise count rates for Quadrant C Data is divided into 100 sec bins |
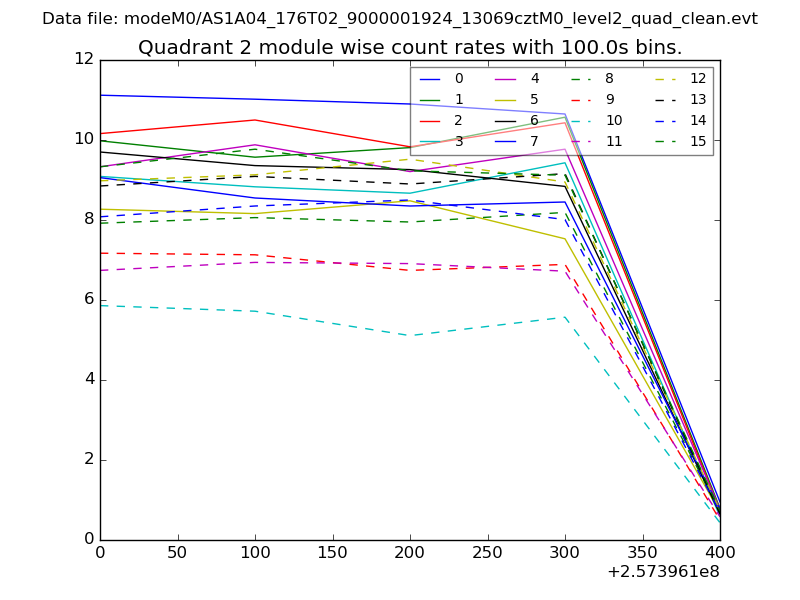 |
 |
| Module-wise count rates for Quadrant D Data is divided into 100 sec bins |
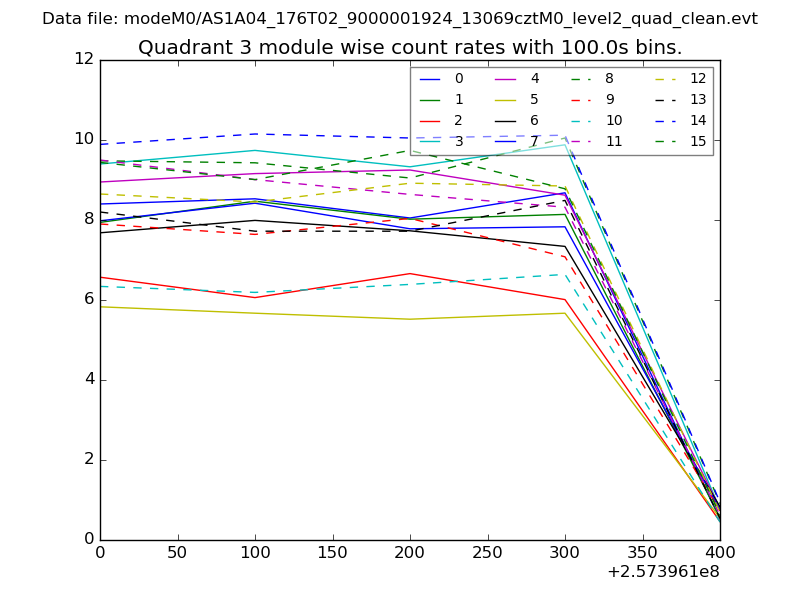 |
 |
| Parameter | Plot |
|---|---|
| CZT HV Monitor | 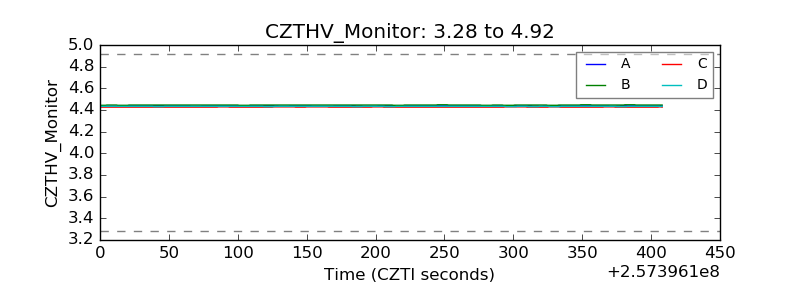 |
| D_VDD |  |
| Temperature 1 |  |
| Veto HV Monitor |  |
| Veto LLD |  |
| Alpha Counter | 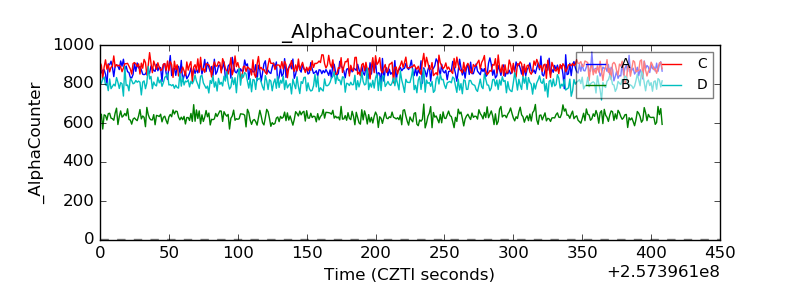 |
| _CPM_Rate | 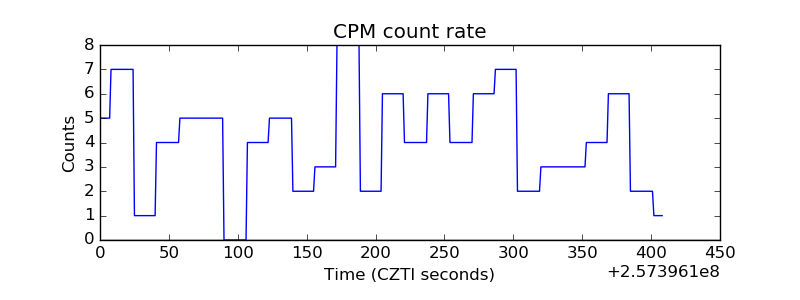 |
| CZT Counter |  |
| +2.5 Volts monitor |  |
| +5 Volts monitor |  |
| _ROLL_ROT | 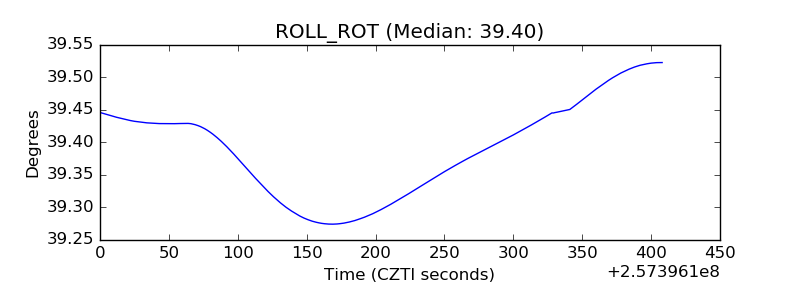 |
| _Roll_DEC |  |
| _Roll_RA |  |
| Veto Counter | 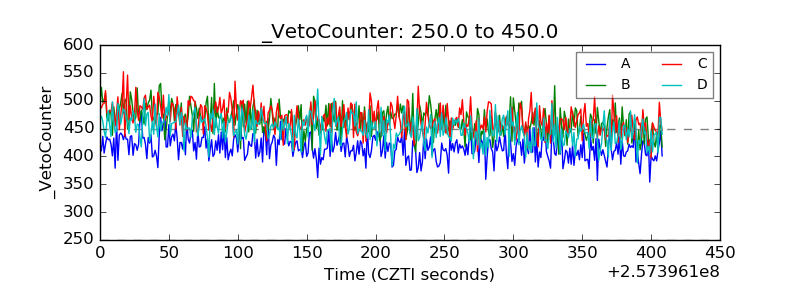 |