| Param | Original file | Final file |
|---|---|---|
| Filename | modeM0/AS1A04_176T02_9000001924_13071cztM0_level2.evt | modeM0/AS1A04_176T02_9000001924_13071cztM0_level2_quad_clean.evt |
| Size (bytes) | 1,248,131,520 | 120,245,760 |
| Size | 1.2 GB | 114.7 MB |
| Events in quadrant A | 5,452,328 | 797,630 |
| Events in quadrant B | 12,450,040 | 701,768 |
| Events in quadrant C | 4,973,455 | 808,161 |
| Events in quadrant D | 14,209,417 | 598,326 |
| Mode M9 | |||
|---|---|---|---|
| Quadrant | BADHDUFLAG | Total packets | Discarded packets |
| A | 0 | 25 | 0 |
| B | 0 | 25 | 0 |
| C | 0 | 25 | 0 |
| D | 0 | 25 | 0 |
| Mode M0 | |||
|---|---|---|---|
| Quadrant | BADHDUFLAG | Total packets | Discarded packets |
| A | 0 | 22599 | 6 |
| B | 0 | 43982 | 2 |
| C | 0 | 21829 | 2 |
| D | 0 | 49111 | 6 |
| Mode SS | |||
|---|---|---|---|
| Quadrant | BADHDUFLAG | Total packets | Discarded packets |
| A | 0 | 216 | 0 |
| B | 0 | 216 | 0 |
| C | 0 | 216 | 0 |
| D | 0 | 216 | 0 |
| Quadrant | Total seconds | Saturated seconds | Saturation percentage |
|---|---|---|---|
| A | 10597 | 90 | 0.849297% |
| B | 10599 | 3492 | 32.946504% |
| C | 10599 | 35 | 0.330220% |
| D | 10597 | 3544 | 33.443427% |
Noise dominated data is calculated using 1-second bins in cleaned event files. If a bin has >2000 counts, and if more than 50% of those come from <1% of pixels, then it is considered to be noise-dominated and hence unusable.
| Quadrant | # 1 sec bins | Bins with >0 counts | Bins with >2000 counts | High rate bins dominated by noise | Noise dominated (total time) | Noise dominated (detector-on time) | Marked lightcurve |
|---|---|---|---|---|---|---|---|
| A | 13160 | 10601 | 12 | 12 | 0.09% | 0.11% | 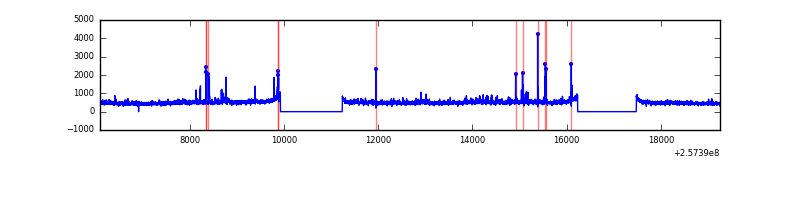 |
| B | 13160 | 10601 | 2719 | 2719 | 20.66% | 25.65% | 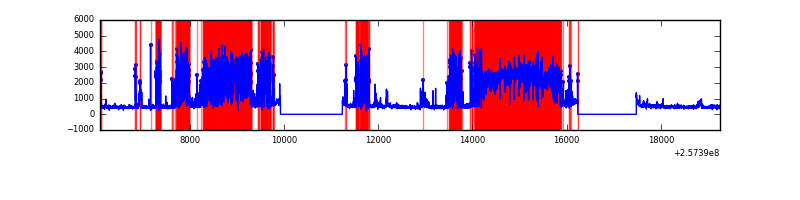 |
| C | 13160 | 10602 | 1 | 1 | 0.01% | 0.01% | 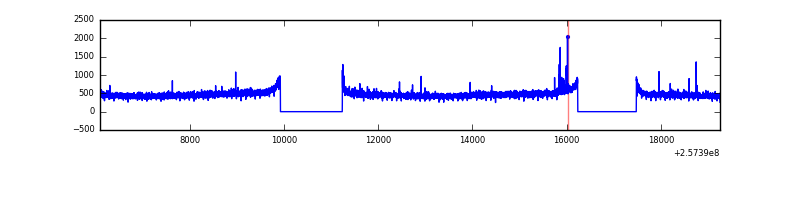 |
| D | 13160 | 10600 | 3494 | 3494 | 26.55% | 32.96% | 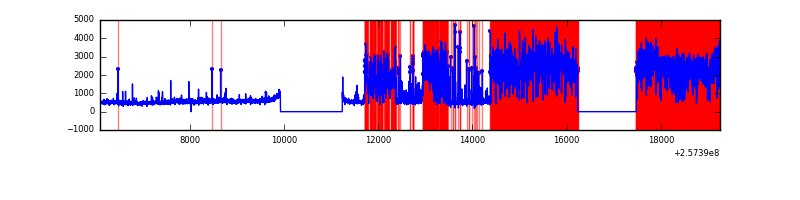 |
Top three noisy pixels from each quadrant. If the there are fewer than three noisy pixels in the level2.evt file, extra rows are filled as -1
| Pixel properties | Quadrant properties | ||||||
|---|---|---|---|---|---|---|---|
| Quadrant | DetID | PixID | Counts | Sigma | Mean | Median | Sigma |
| A | 12 | 189 | 197181 | 748.09 | 1311 | 1286 | 261.9 |
| A | 15 | 223 | 67101 | 251.34 | 1311 | 1286 | 261.9 |
| A | 1 | 162 | 39841 | 147.23 | 1311 | 1286 | 261.9 |
| B | 4 | 239 | 5919372 | 29921.63 | 1056 | 1029 | 197.8 |
| B | 0 | 85 | 2210901 | 11172.55 | 1056 | 1029 | 197.8 |
| B | 0 | 219 | 139142 | 698.26 | 1056 | 1029 | 197.8 |
| C | 15 | 208 | 19958 | 64.52 | 1264 | 1270 | 289.6 |
| C | 14 | 234 | 17305 | 55.36 | 1264 | 1270 | 289.6 |
| C | 12 | 4 | 9310 | 27.76 | 1264 | 1270 | 289.6 |
| D | 1 | 52 | 9759962 | 38068.31 | 1081 | 1054 | 256.4 |
| D | 10 | 157 | 259441 | 1007.94 | 1081 | 1054 | 256.4 |
| D | 2 | 14 | 35201 | 133.2 | 1081 | 1054 | 256.4 |
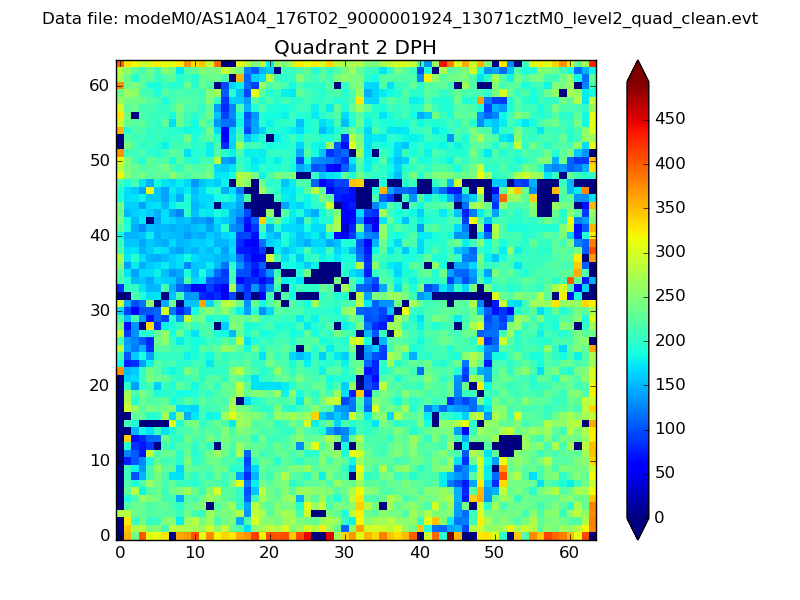
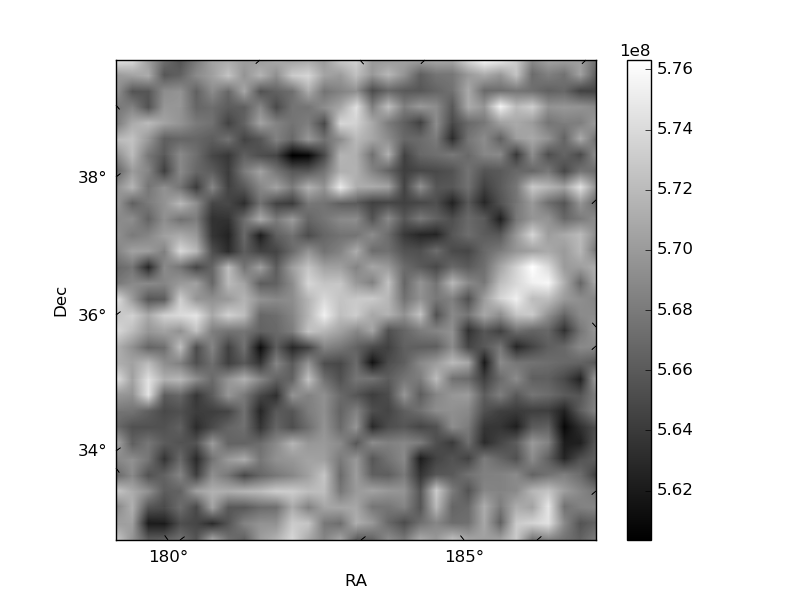
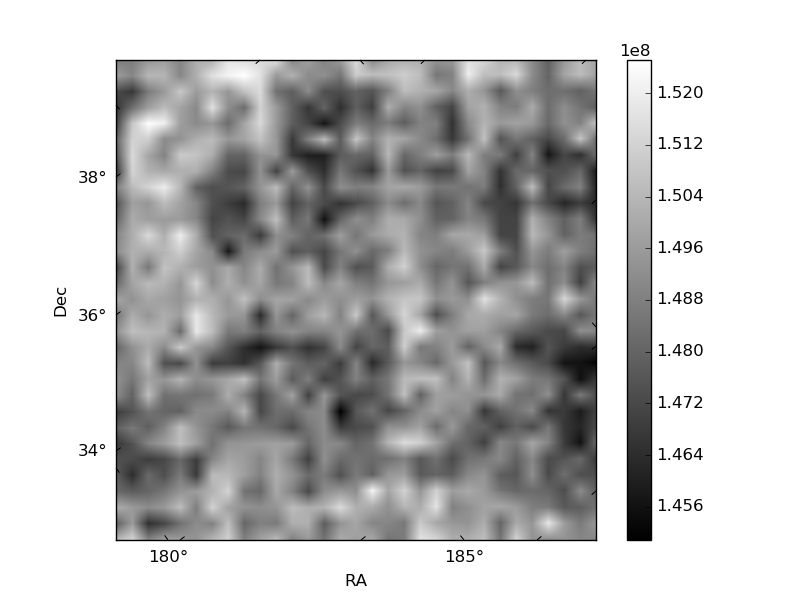
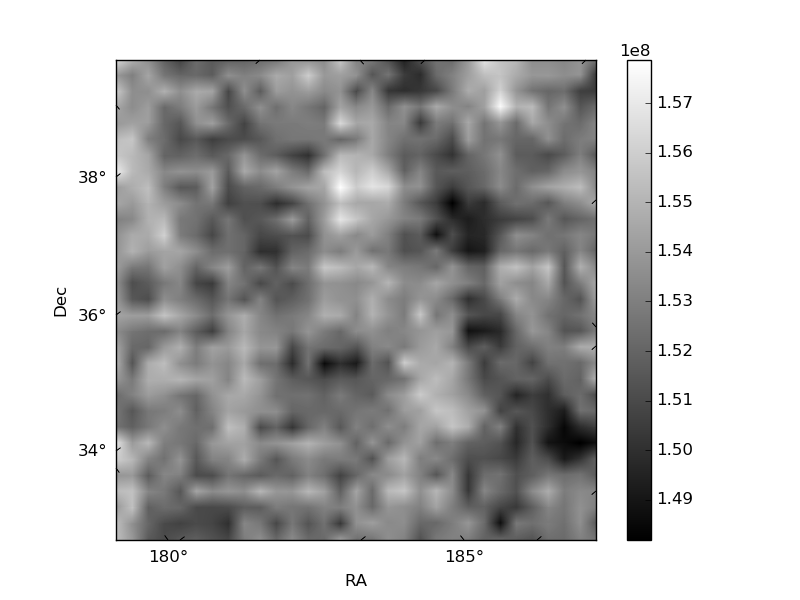
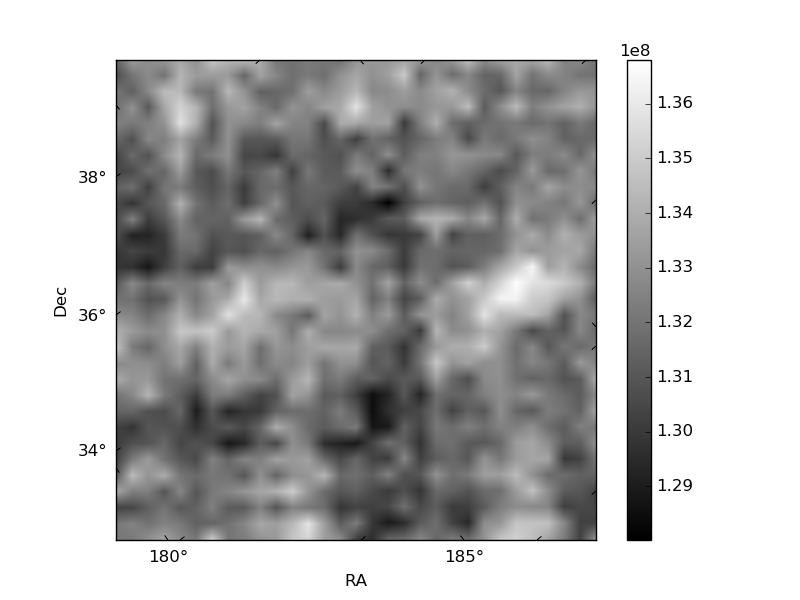
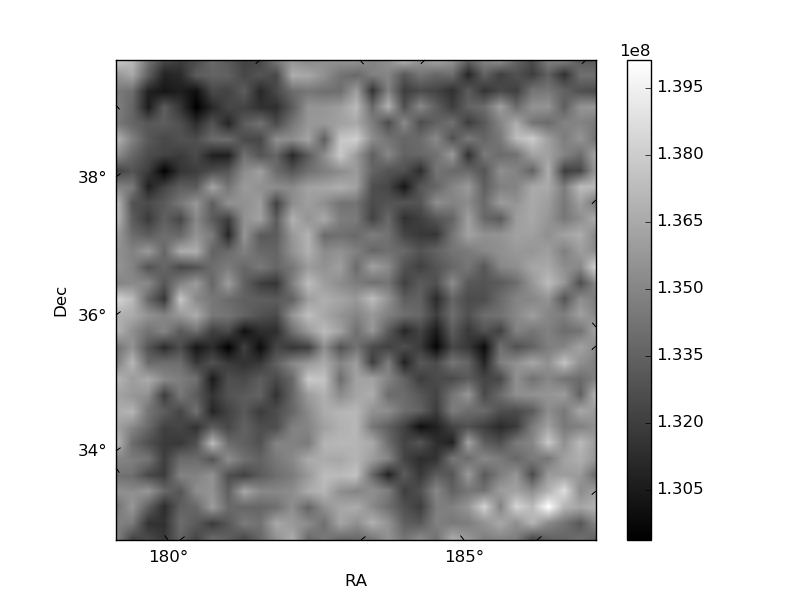
Histogram calculated using DETX and DETY for each event in the final _common_clean file
| Quadrant A | 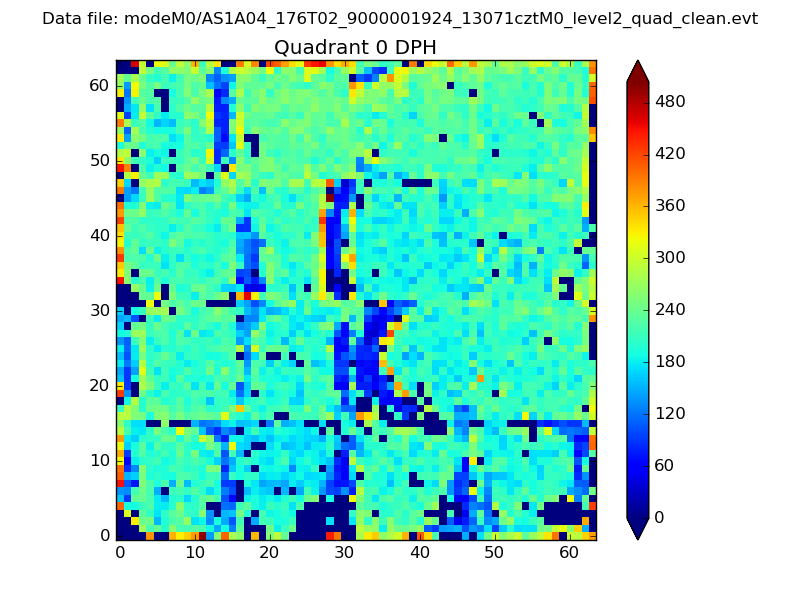 |
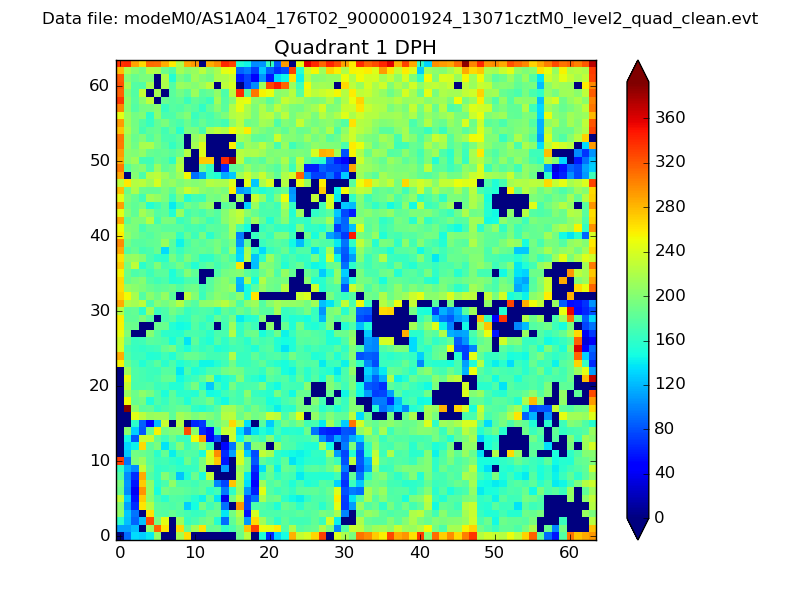 |
Quadrant B |
|---|---|---|---|
| Quadrant D | 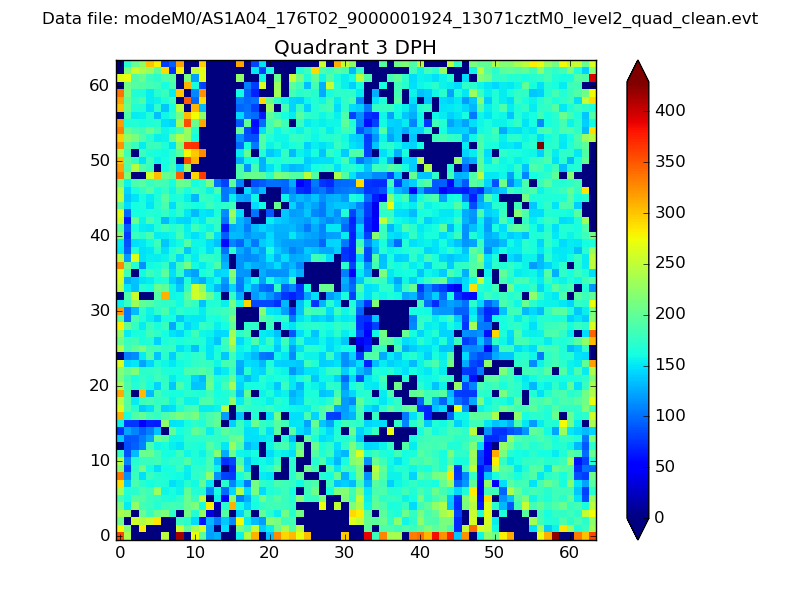 |
 |
Quadrant C |
| Plot type | Count rate plots | Images |
|---|---|---|
| Comparison with Poisson distribution Blue bars denote a histogram of data divided into 1 sec bins. Red curve is a Poisson curve with rate = median count rate of data. |
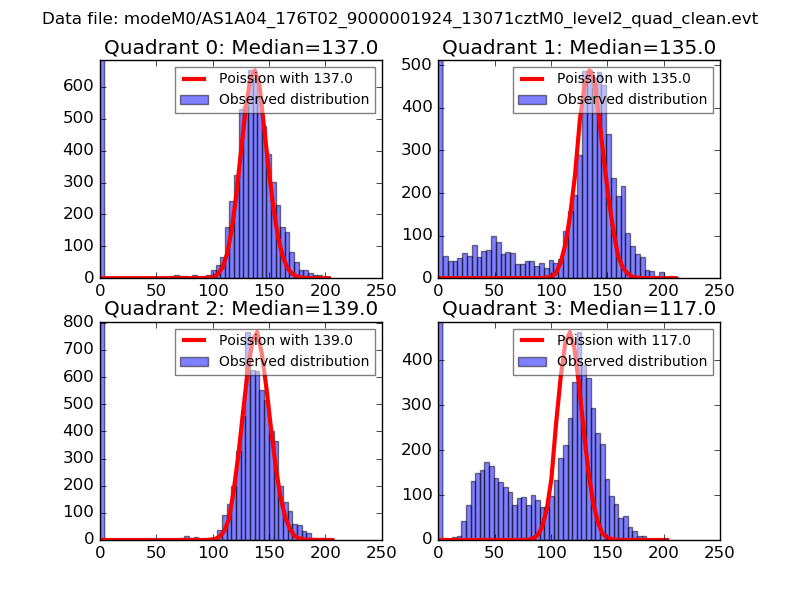 |
 |
| Quadrant-wise count rates Data is divided into 100 sec bins |
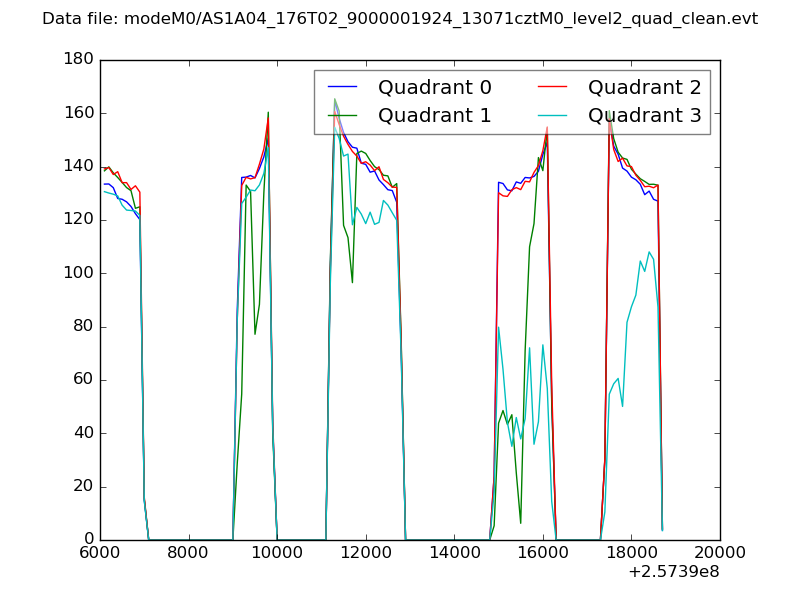 |
|
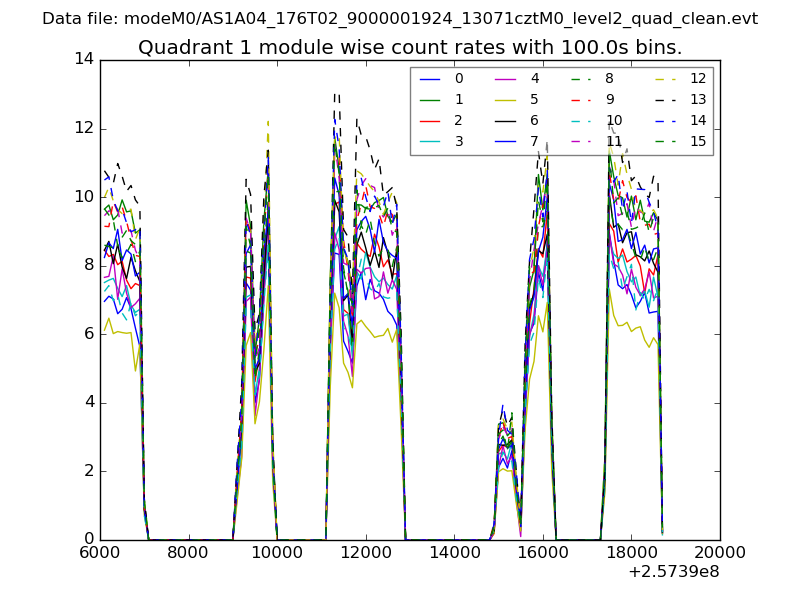
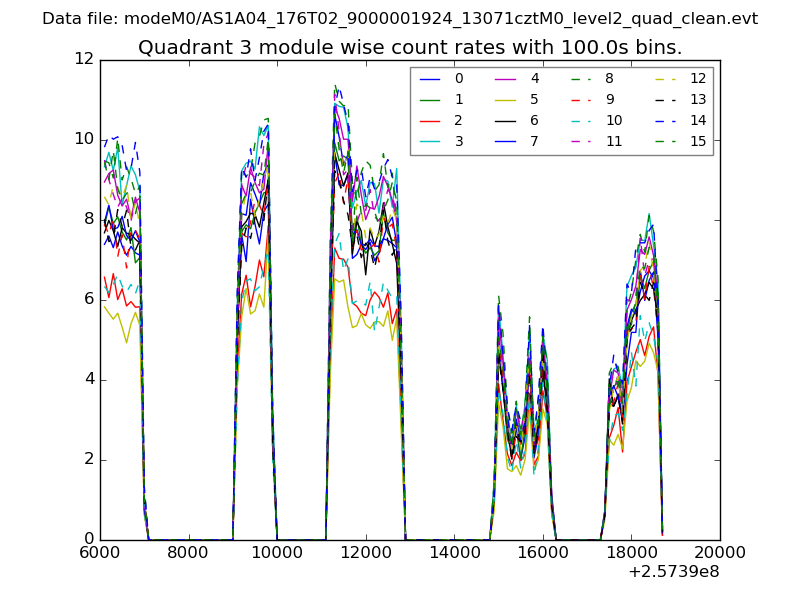
| Module-wise count rates for Quadrant A Data is divided into 100 sec bins |
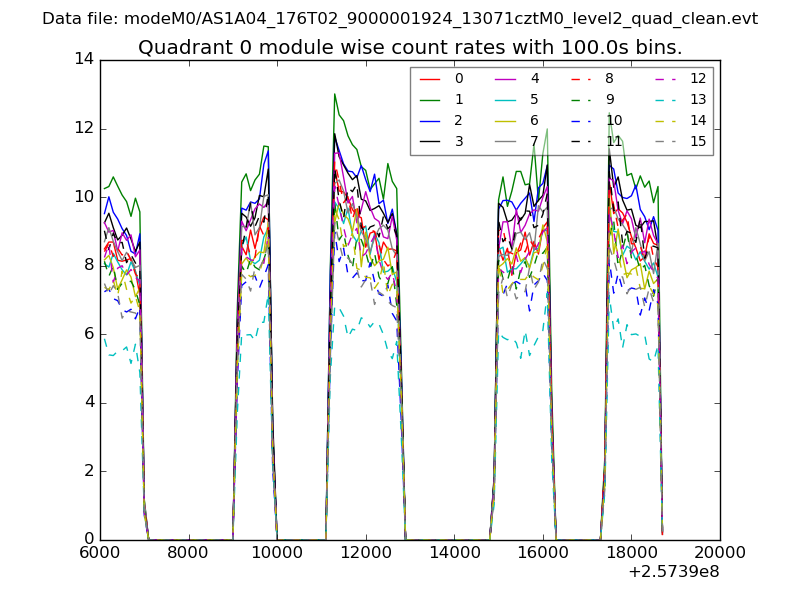 |
 |
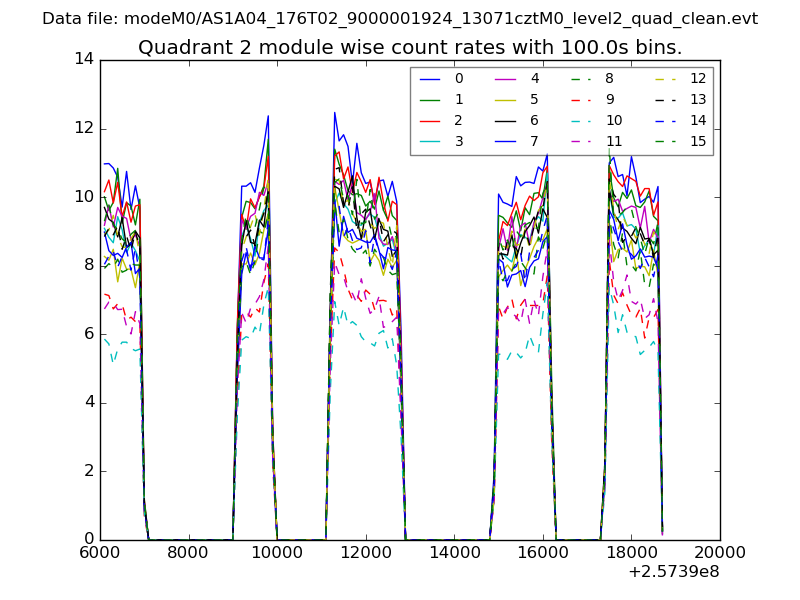
| Module-wise count rates for Quadrant B Data is divided into 100 sec bins |
 |
 |
| Module-wise count rates for Quadrant C Data is divided into 100 sec bins |
 |
 |
| Module-wise count rates for Quadrant D Data is divided into 100 sec bins |
 |
 |
| Parameter | Plot |
|---|---|
| CZT HV Monitor | 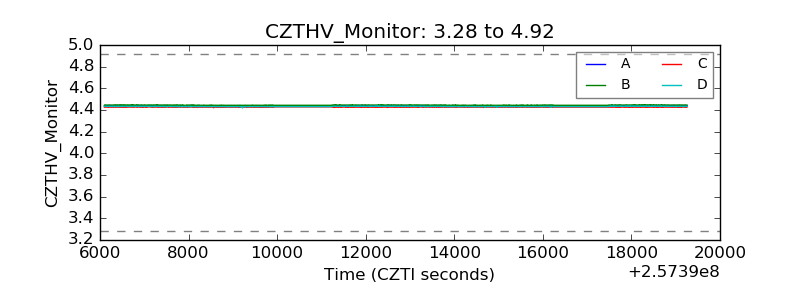 |
| D_VDD | 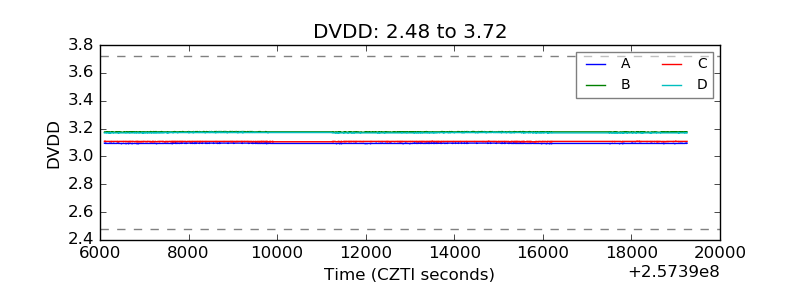 |
| Temperature 1 | 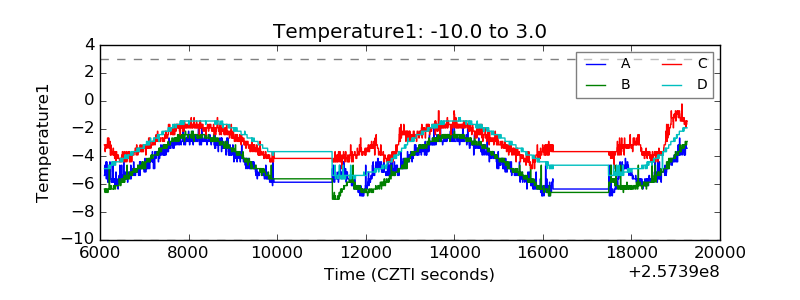 |
| Veto HV Monitor | 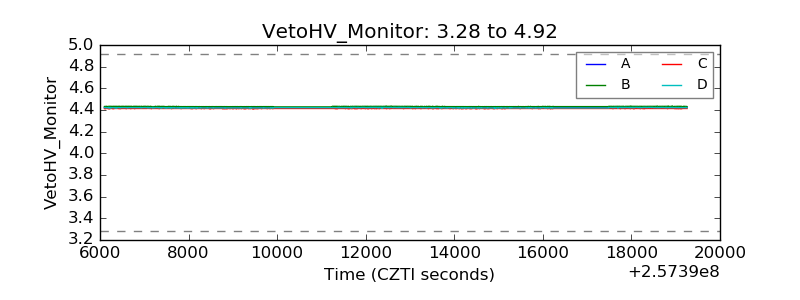 |
| Veto LLD | 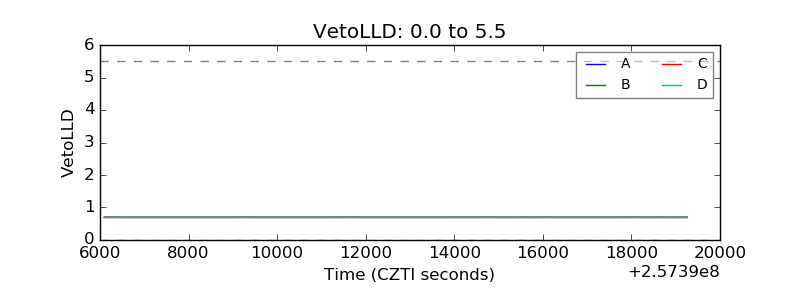 |
| Alpha Counter | 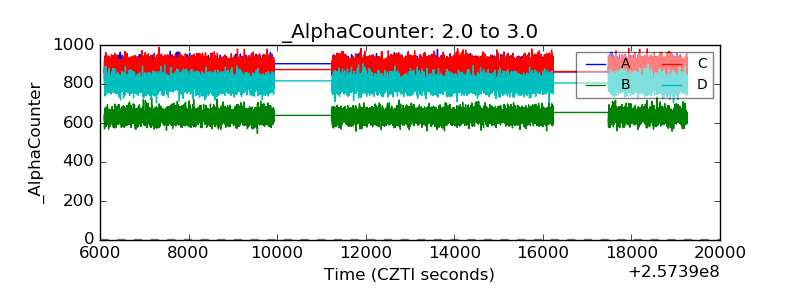 |
| _CPM_Rate | 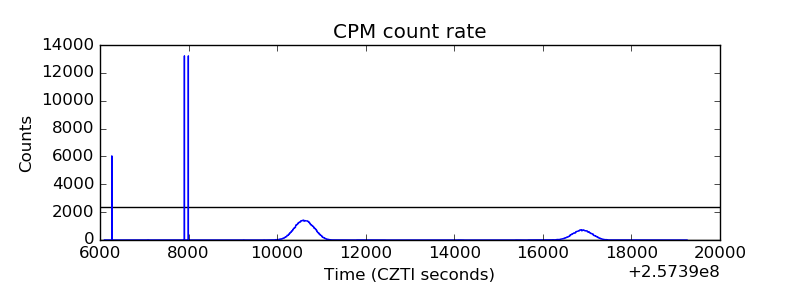 |
| CZT Counter | 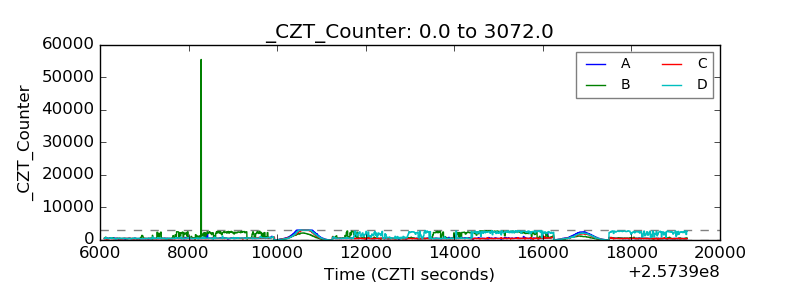 |
| +2.5 Volts monitor | 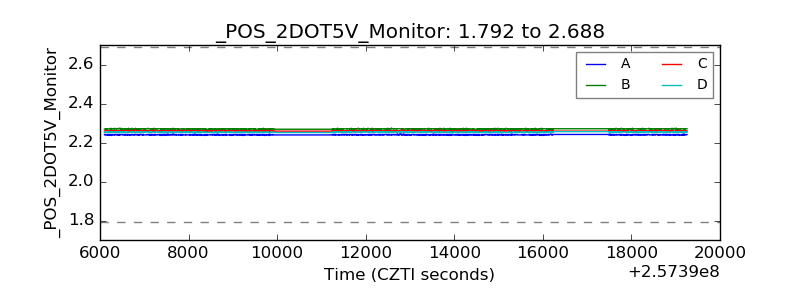 |
| +5 Volts monitor | 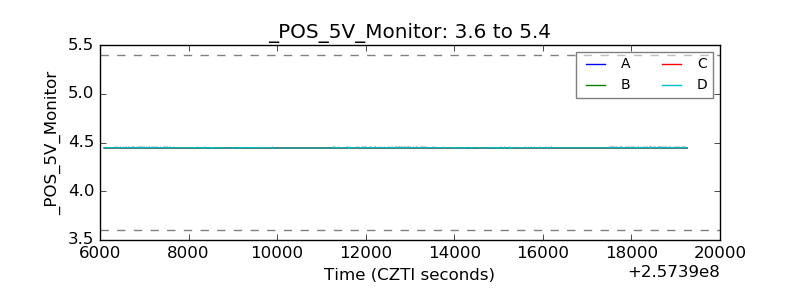 |
| _ROLL_ROT | 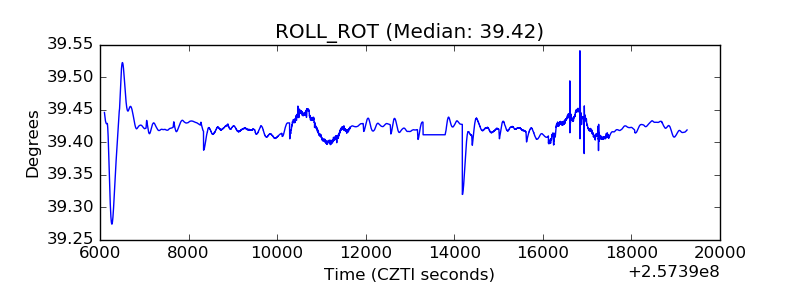 |
| _Roll_DEC | 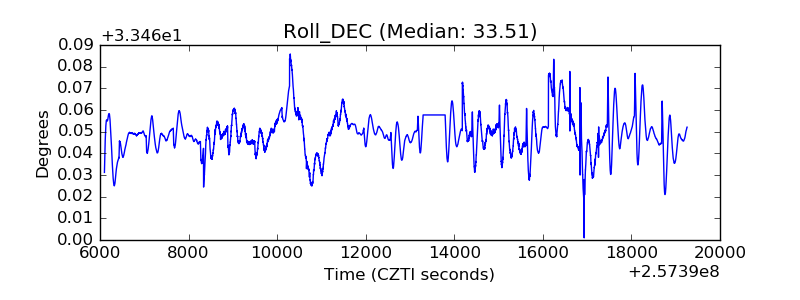 |
| _Roll_RA | 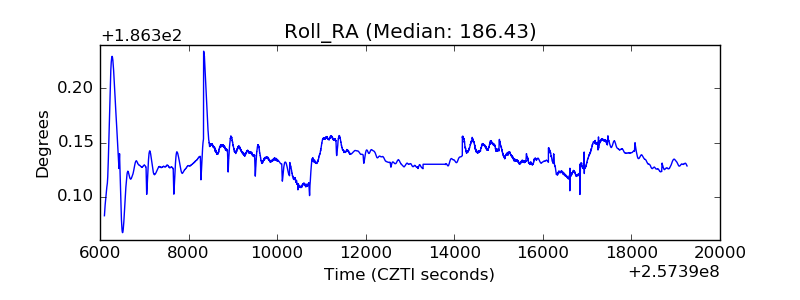 |
| Veto Counter | 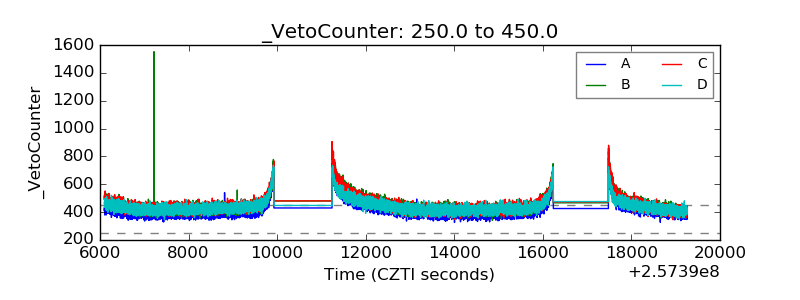 |