| Param | Original file | Final file |
|---|---|---|
| Filename | modeM0/AS1A04_176T02_9000001924_13073cztM0_level2.evt | modeM0/AS1A04_176T02_9000001924_13073cztM0_level2_quad_clean.evt |
| Size (bytes) | 2,793,208,320 | 226,105,920 |
| Size | 2.6 GB | 215.6 MB |
| Events in quadrant A | 10,890,215 | 1,534,226 |
| Events in quadrant B | 21,605,553 | 1,401,303 |
| Events in quadrant C | 9,925,650 | 1,543,979 |
| Events in quadrant D | 40,755,664 | 912,872 |
| Mode M9 | |||
|---|---|---|---|
| Quadrant | BADHDUFLAG | Total packets | Discarded packets |
| A | 0 | 42 | 0 |
| B | 0 | 42 | 0 |
| C | 0 | 42 | 0 |
| D | 0 | 42 | 0 |
| Mode M0 | |||
|---|---|---|---|
| Quadrant | BADHDUFLAG | Total packets | Discarded packets |
| A | 0 | 45365 | 5 |
| B | 0 | 78043 | 4 |
| C | 0 | 43703 | 4 |
| D | 0 | 135127 | 4 |
| Mode SS | |||
|---|---|---|---|
| Quadrant | BADHDUFLAG | Total packets | Discarded packets |
| A | 0 | 432 | 0 |
| B | 0 | 432 | 0 |
| C | 0 | 432 | 0 |
| D | 0 | 432 | 0 |
| Quadrant | Total seconds | Saturated seconds | Saturation percentage |
|---|---|---|---|
| A | 21062 | 305 | 1.448106% |
| B | 21062 | 5162 | 24.508594% |
| C | 21062 | 152 | 0.721679% |
| D | 21062 | 13219 | 62.762321% |
Noise dominated data is calculated using 1-second bins in cleaned event files. If a bin has >2000 counts, and if more than 50% of those come from <1% of pixels, then it is considered to be noise-dominated and hence unusable.
| Quadrant | # 1 sec bins | Bins with >0 counts | Bins with >2000 counts | High rate bins dominated by noise | Noise dominated (total time) | Noise dominated (detector-on time) | Marked lightcurve |
|---|---|---|---|---|---|---|---|
| A | 25388 | 21067 | 39 | 39 | 0.15% | 0.19% | 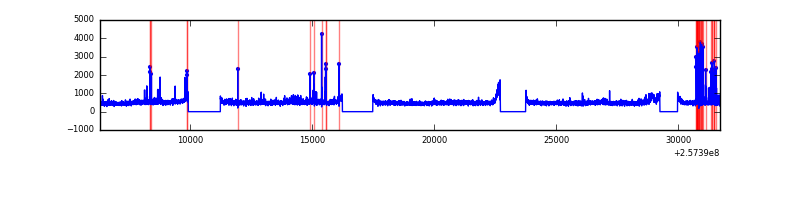 |
| B | 25388 | 21066 | 3851 | 3851 | 15.17% | 18.28% | 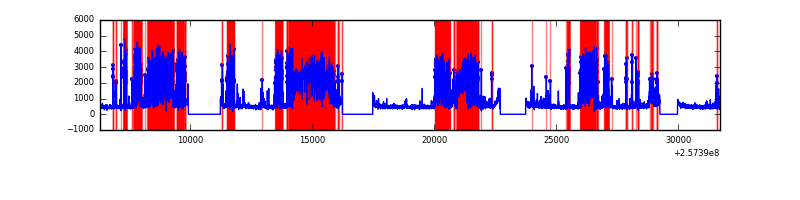 |
| C | 25388 | 21067 | 10 | 10 | 0.04% | 0.05% | 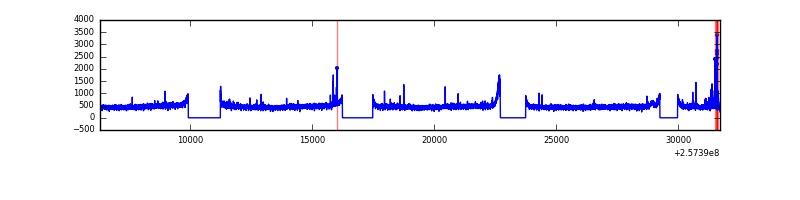 |
| D | 25388 | 21065 | 12847 | 12847 | 50.60% | 60.99% | 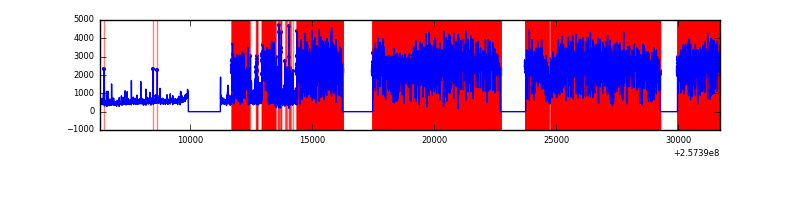 |
Top three noisy pixels from each quadrant. If the there are fewer than three noisy pixels in the level2.evt file, extra rows are filled as -1
| Pixel properties | Quadrant properties | ||||||
|---|---|---|---|---|---|---|---|
| Quadrant | DetID | PixID | Counts | Sigma | Mean | Median | Sigma |
| A | 12 | 189 | 368936 | 703.06 | 2603 | 2549 | 521.1 |
| A | 15 | 223 | 198346 | 375.72 | 2603 | 2549 | 521.1 |
| A | 15 | 239 | 101562 | 190.0 | 2603 | 2549 | 521.1 |
| B | 4 | 239 | 8847945 | 20929.77 | 2256 | 2200 | 422.6 |
| B | 0 | 85 | 3529267 | 8345.33 | 2256 | 2200 | 422.6 |
| B | 0 | 219 | 155714 | 363.23 | 2256 | 2200 | 422.6 |
| C | 15 | 208 | 84246 | 141.92 | 2510 | 2522 | 575.8 |
| C | 14 | 234 | 44646 | 73.15 | 2510 | 2522 | 575.8 |
| C | 13 | 61 | 18110 | 27.07 | 2510 | 2522 | 575.8 |
| D | 1 | 52 | 33491618 | 81794.03 | 1731 | 1688 | 409.4 |
| D | 10 | 157 | 300655 | 730.18 | 1731 | 1688 | 409.4 |
| D | 1 | 255 | 156954 | 379.21 | 1731 | 1688 | 409.4 |
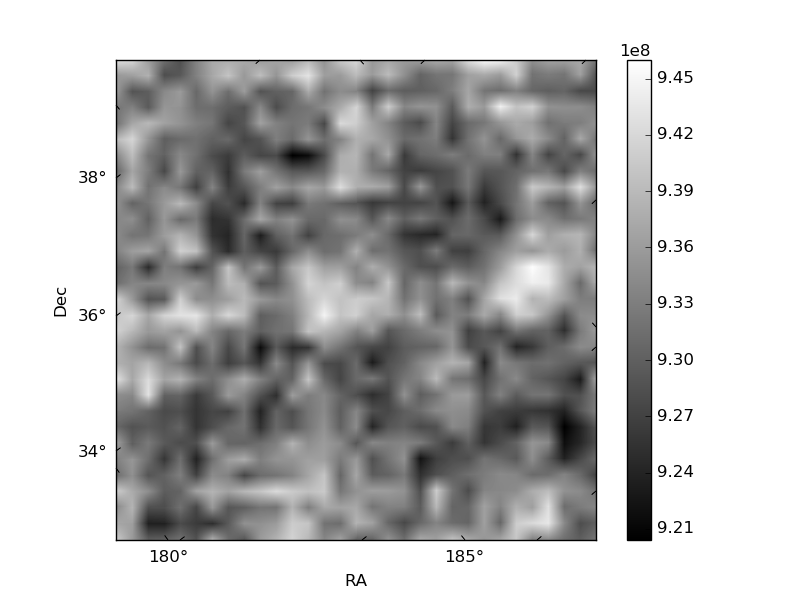
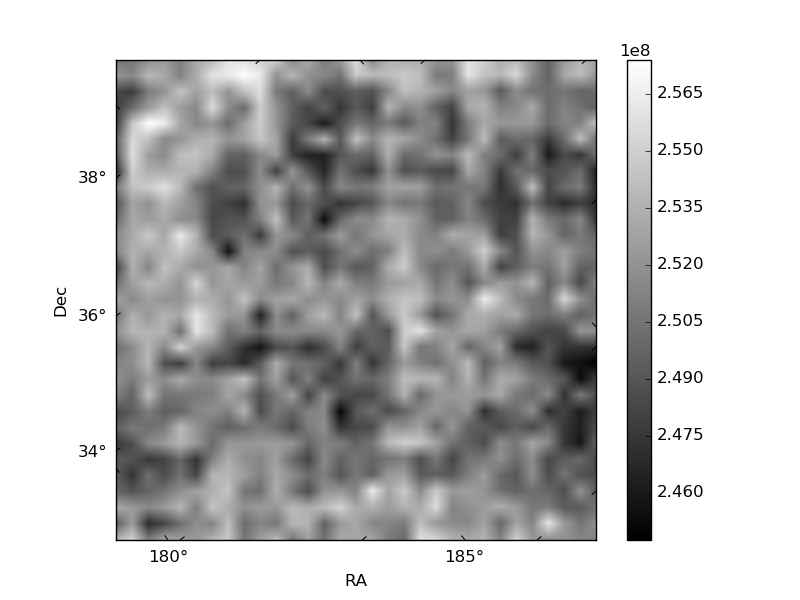
Histogram calculated using DETX and DETY for each event in the final _common_clean file
| Quadrant A | 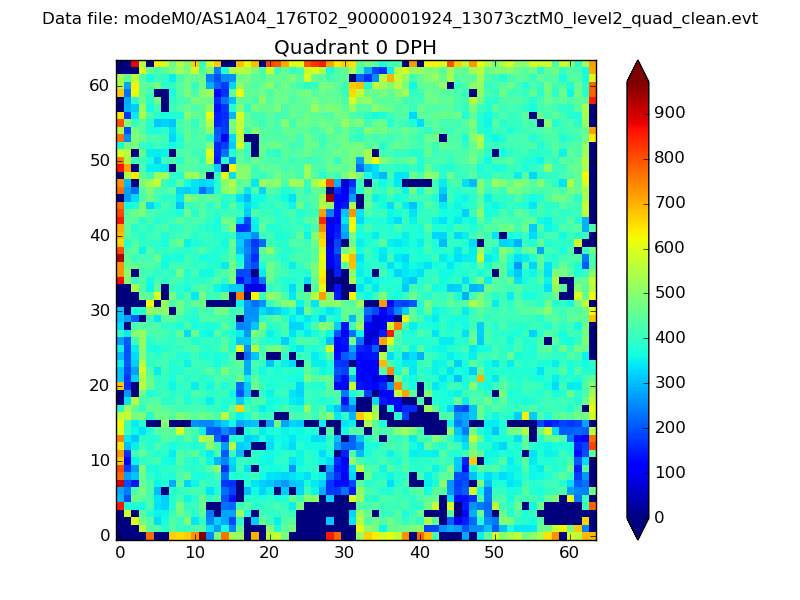 |
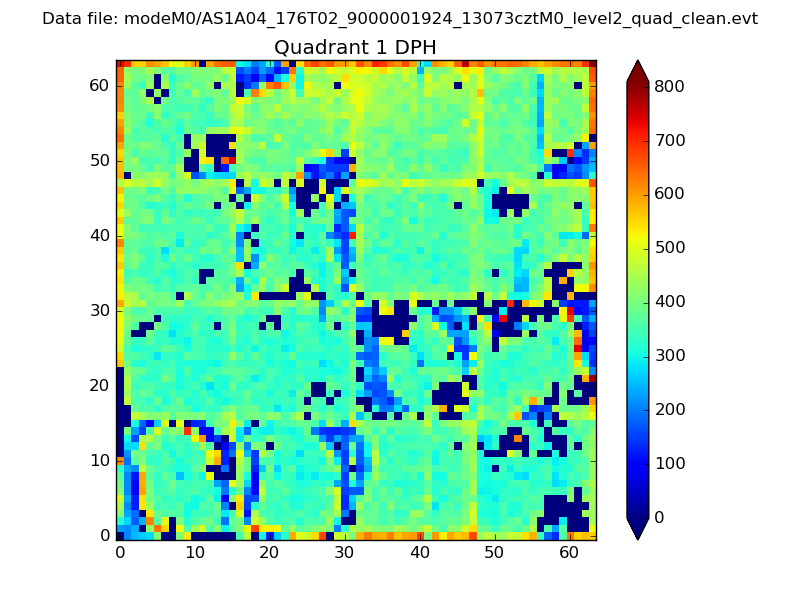 |
Quadrant B |
|---|---|---|---|
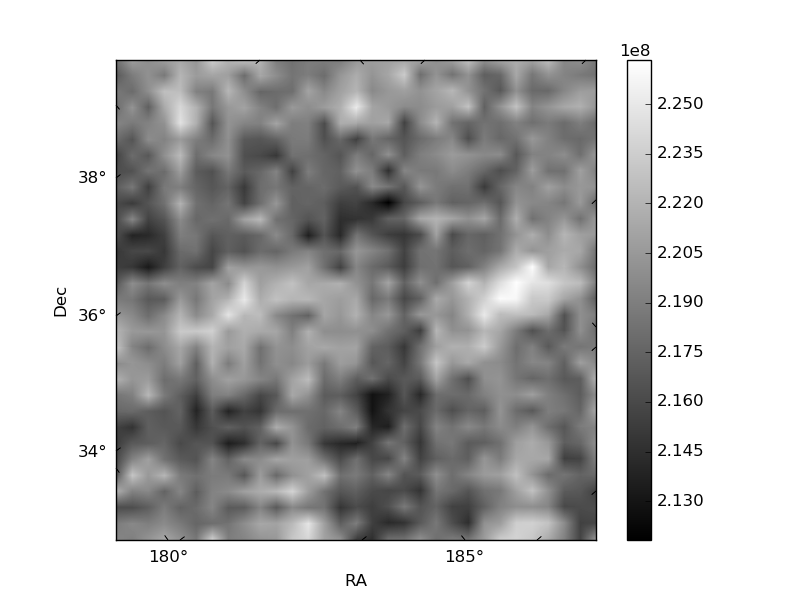
| Quadrant D | 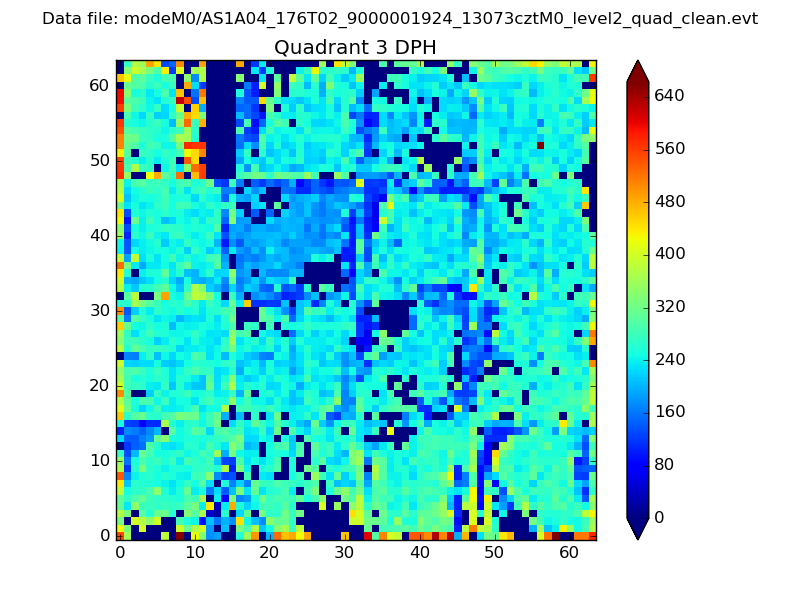 |
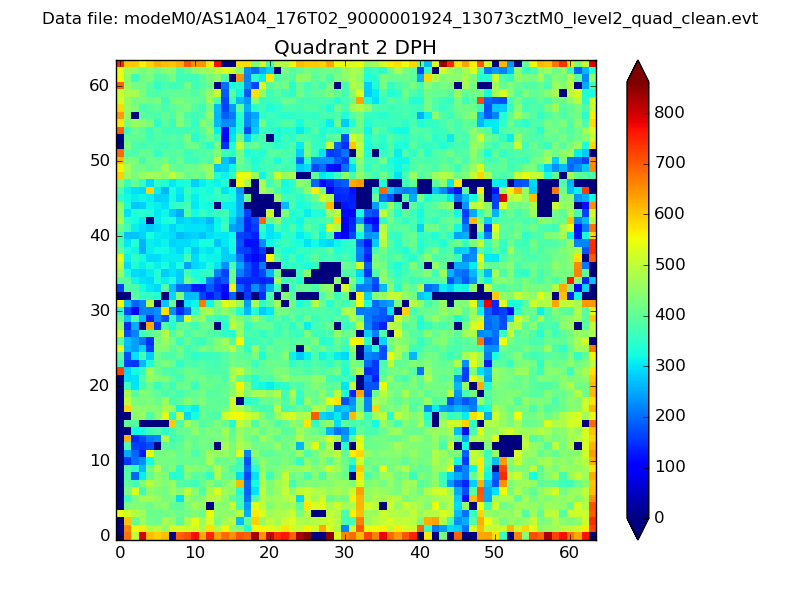 |
Quadrant C |
| Plot type | Count rate plots | Images |
|---|---|---|
| Comparison with Poisson distribution Blue bars denote a histogram of data divided into 1 sec bins. Red curve is a Poisson curve with rate = median count rate of data. |
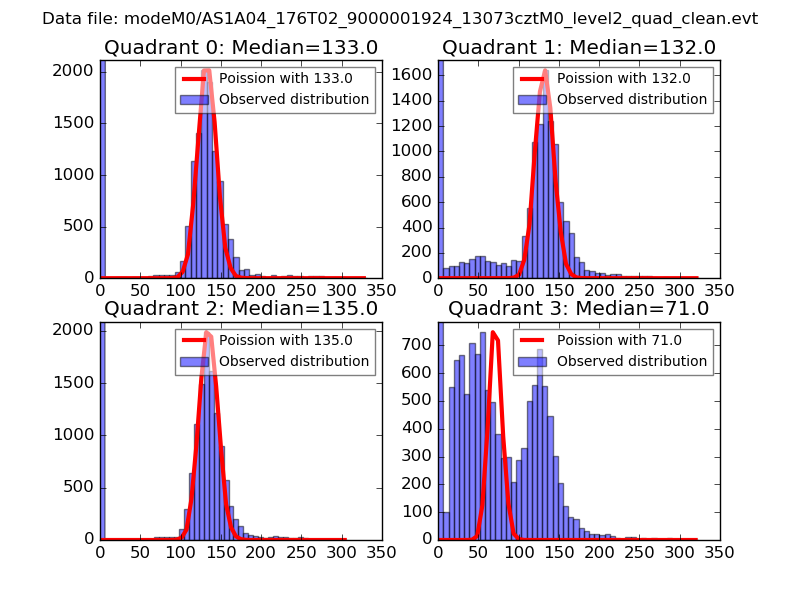 |
 |
| Quadrant-wise count rates Data is divided into 100 sec bins |
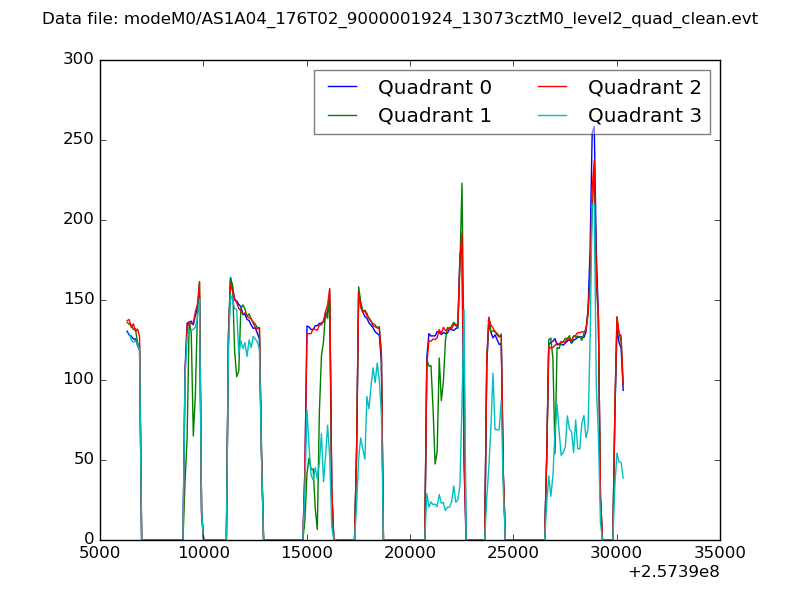 |
|
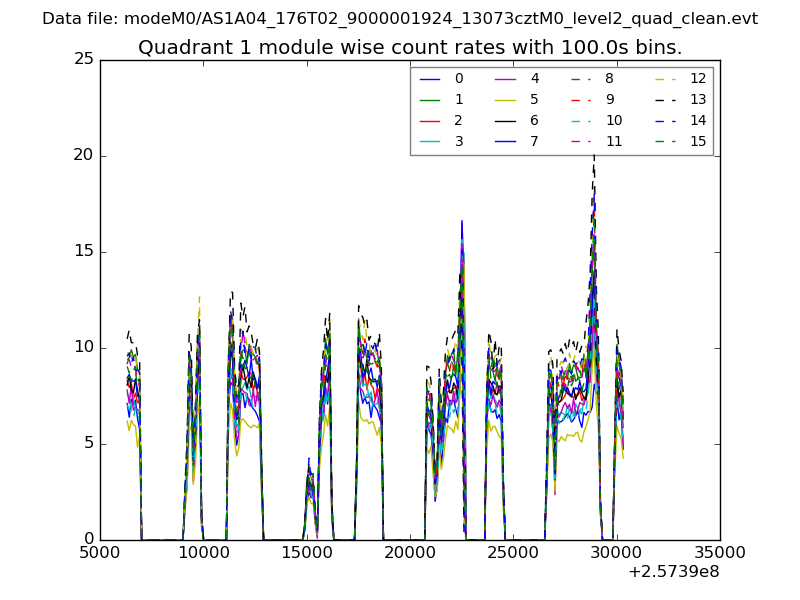
| Module-wise count rates for Quadrant A Data is divided into 100 sec bins |
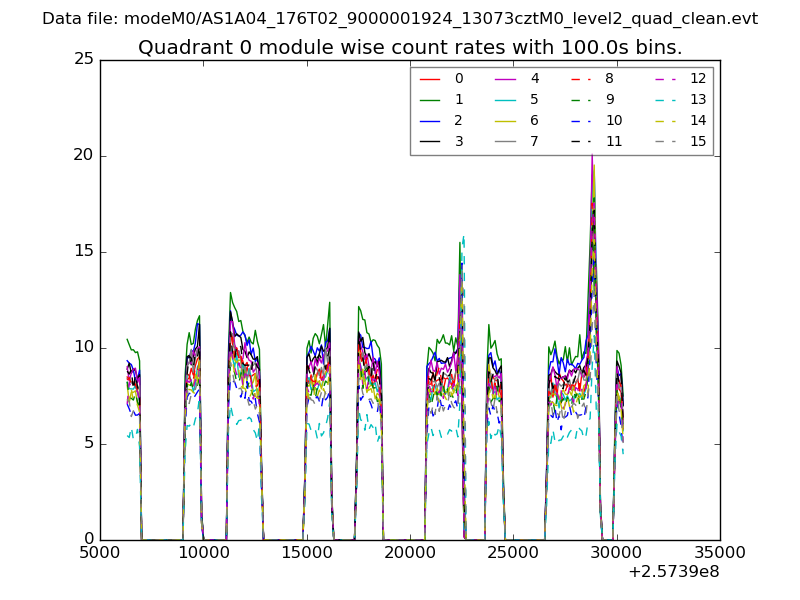 |
 |
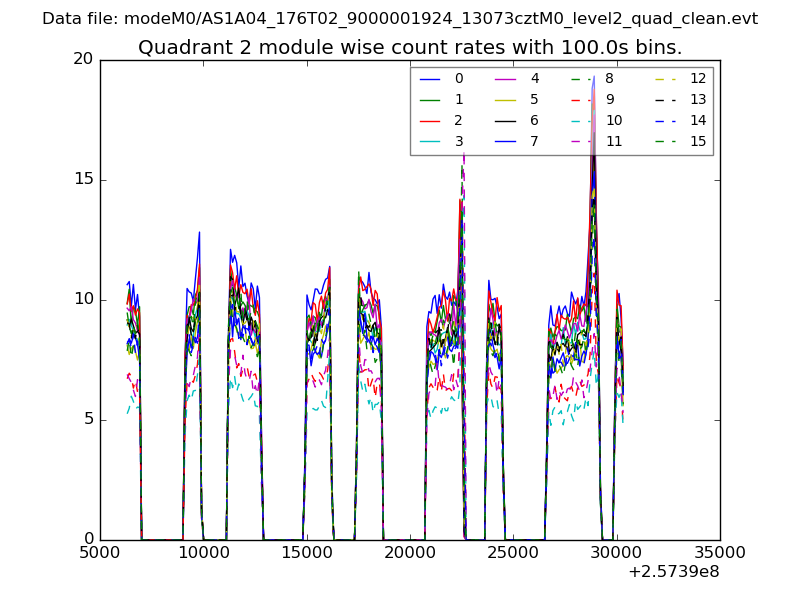
| Module-wise count rates for Quadrant B Data is divided into 100 sec bins |
 |
 |
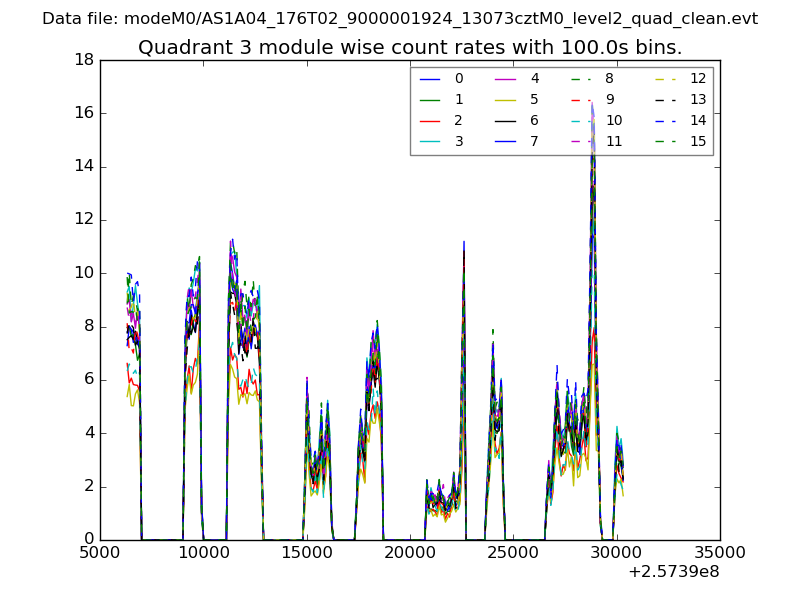
| Module-wise count rates for Quadrant C Data is divided into 100 sec bins |
 |
 |
| Module-wise count rates for Quadrant D Data is divided into 100 sec bins |
 |
 |
| Parameter | Plot |
|---|---|
| CZT HV Monitor | 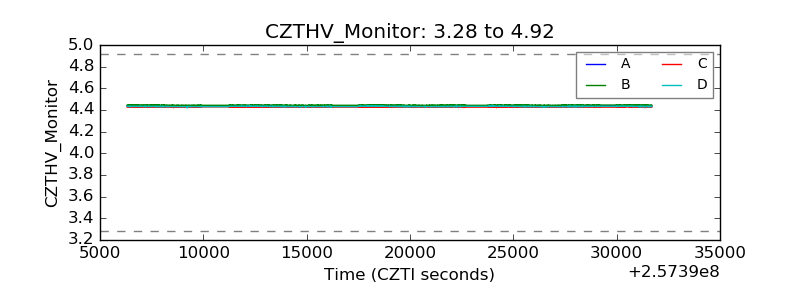 |
| D_VDD |  |
| Temperature 1 |  |
| Veto HV Monitor | 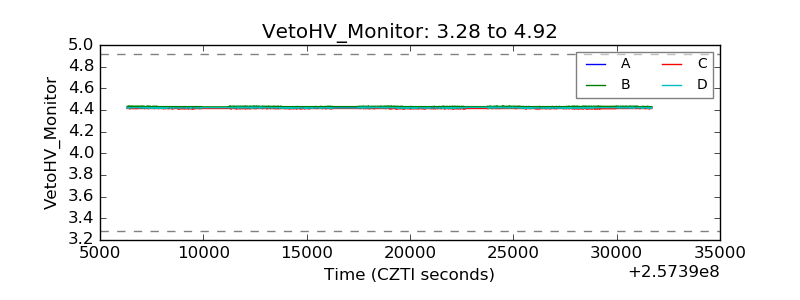 |
| Veto LLD | 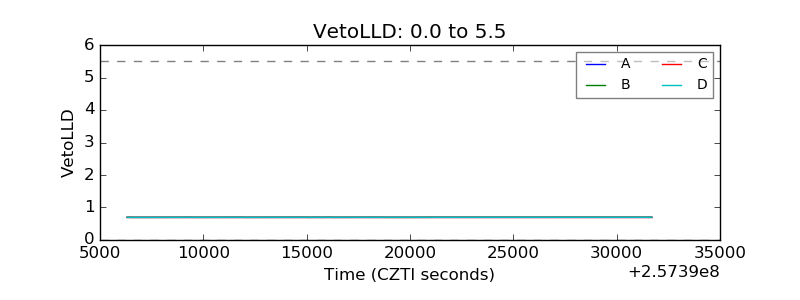 |
| Alpha Counter | 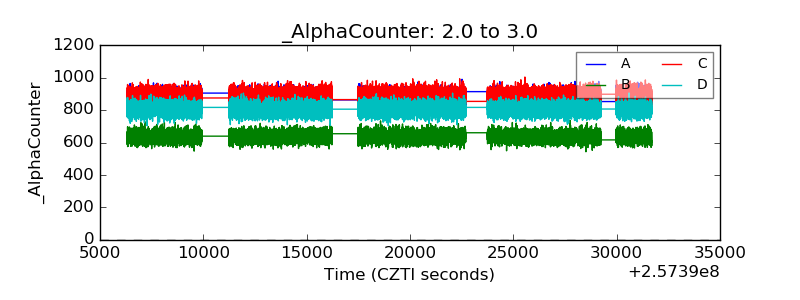 |
| _CPM_Rate | 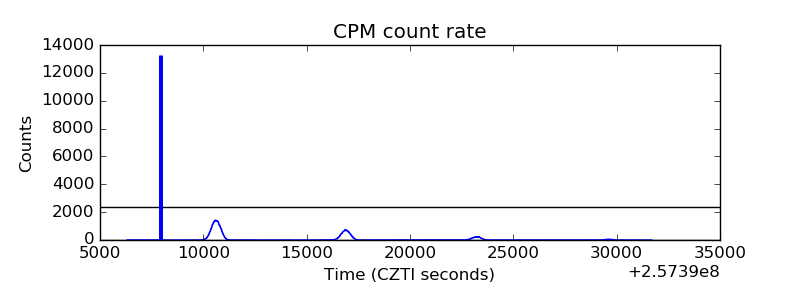 |
| CZT Counter | 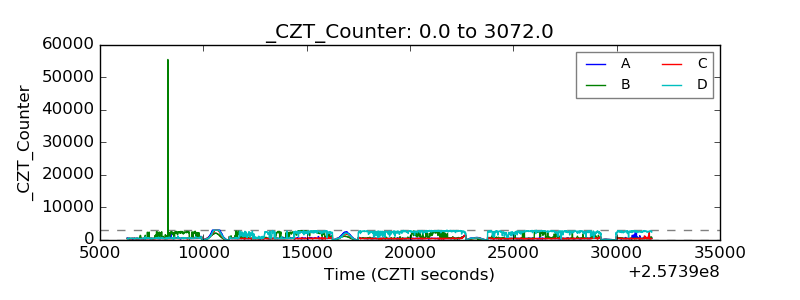 |
| +2.5 Volts monitor |  |
| +5 Volts monitor |  |
| _ROLL_ROT |  |
| _Roll_DEC | 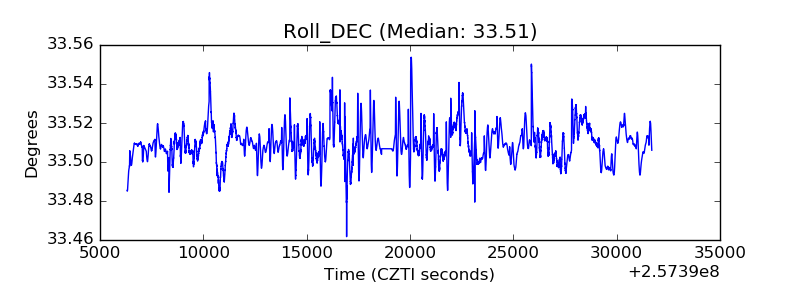 |
| _Roll_RA | 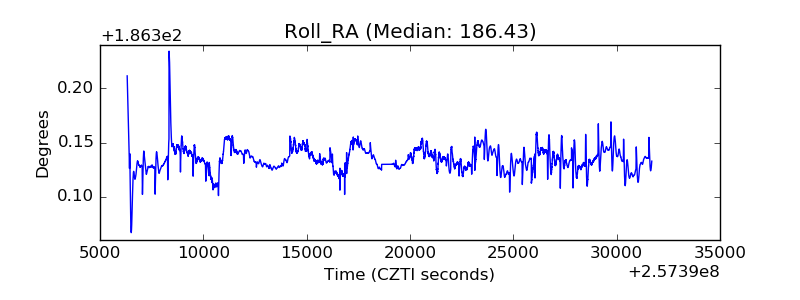 |
| Veto Counter | 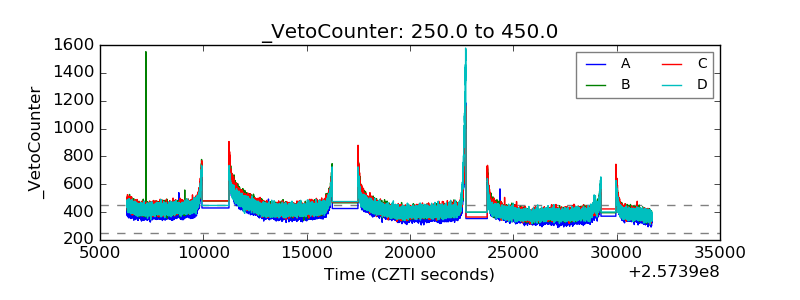 |