| Param | Original file | Final file |
|---|---|---|
| Filename | modeM0/AS1A04_176T02_9000001924_13074cztM0_level2.evt | modeM0/AS1A04_176T02_9000001924_13074cztM0_level2_quad_clean.evt |
| Size (bytes) | 752,938,560 | 78,840,000 |
| Size | 718.1 MB | 75.2 MB |
| Events in quadrant A | 3,931,986 | 480,389 |
| Events in quadrant B | 6,530,227 | 456,881 |
| Events in quadrant C | 3,610,089 | 485,913 |
| Events in quadrant D | 8,216,008 | 435,302 |
| Mode M9 | |||
|---|---|---|---|
| Quadrant | BADHDUFLAG | Total packets | Discarded packets |
| A | 0 | 4 | 0 |
| B | 0 | 4 | 0 |
| C | 0 | 4 | 0 |
| D | 0 | 5 | 0 |
| Mode M0 | |||
|---|---|---|---|
| Quadrant | BADHDUFLAG | Total packets | Discarded packets |
| A | 0 | 16726 | 3 |
| B | 0 | 24441 | 2 |
| C | 0 | 15995 | 2 |
| D | 0 | 29554 | 2 |
| Mode SS | |||
|---|---|---|---|
| Quadrant | BADHDUFLAG | Total packets | Discarded packets |
| A | 0 | 154 | 0 |
| B | 0 | 154 | 0 |
| C | 0 | 154 | 0 |
| D | 0 | 154 | 0 |
| Quadrant | Total seconds | Saturated seconds | Saturation percentage |
|---|---|---|---|
| A | 7591 | 253 | 3.332894% |
| B | 7591 | 1445 | 19.035700% |
| C | 7591 | 141 | 1.857463% |
| D | 7591 | 2065 | 27.203267% |
Noise dominated data is calculated using 1-second bins in cleaned event files. If a bin has >2000 counts, and if more than 50% of those come from <1% of pixels, then it is considered to be noise-dominated and hence unusable.
| Quadrant | # 1 sec bins | Bins with >0 counts | Bins with >2000 counts | High rate bins dominated by noise | Noise dominated (total time) | Noise dominated (detector-on time) | Marked lightcurve |
|---|---|---|---|---|---|---|---|
| A | 7877 | 7593 | 39 | 39 | 0.50% | 0.51% | 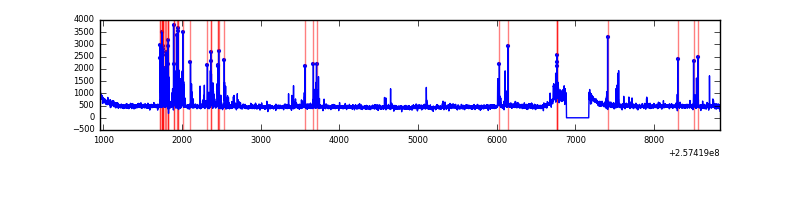 |
| B | 7876 | 7592 | 959 | 959 | 12.18% | 12.63% | 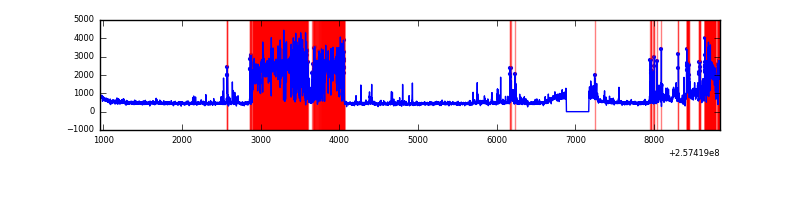 |
| C | 7877 | 7593 | 10 | 10 | 0.13% | 0.13% | 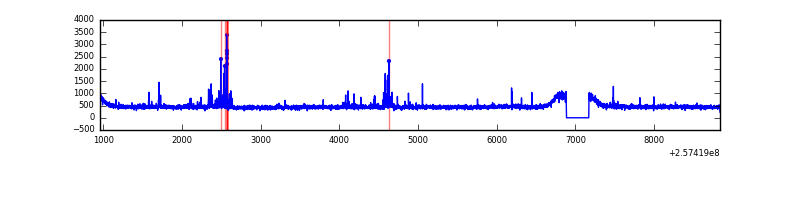 |
| D | 7877 | 7593 | 1815 | 1815 | 23.04% | 23.90% | 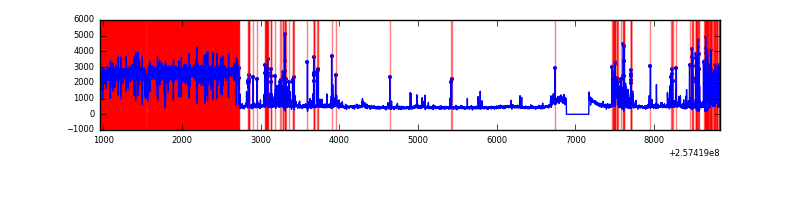 |
Top three noisy pixels from each quadrant. If the there are fewer than three noisy pixels in the level2.evt file, extra rows are filled as -1
| Pixel properties | Quadrant properties | ||||||
|---|---|---|---|---|---|---|---|
| Quadrant | DetID | PixID | Counts | Sigma | Mean | Median | Sigma |
| A | 15 | 223 | 216050 | 1154.57 | 910 | 888 | 186.4 |
| A | 15 | 239 | 102924 | 547.53 | 910 | 888 | 186.4 |
| A | 8 | 15 | 37360 | 195.71 | 910 | 888 | 186.4 |
| B | 4 | 239 | 2753034 | 17390.65 | 813 | 793 | 158.3 |
| B | 0 | 85 | 558186 | 3522.01 | 813 | 793 | 158.3 |
| B | 12 | 111 | 18539 | 112.13 | 813 | 793 | 158.3 |
| C | 15 | 208 | 114391 | 549.93 | 886 | 891 | 206.4 |
| C | 14 | 234 | 27105 | 127.01 | 886 | 891 | 206.4 |
| C | 0 | 207 | 11202 | 49.96 | 886 | 891 | 206.4 |
| D | 1 | 52 | 4942598 | 26252.28 | 774 | 751 | 188.2 |
| D | 10 | 157 | 180379 | 954.23 | 774 | 751 | 188.2 |
| D | 13 | 172 | 99886 | 526.63 | 774 | 751 | 188.2 |
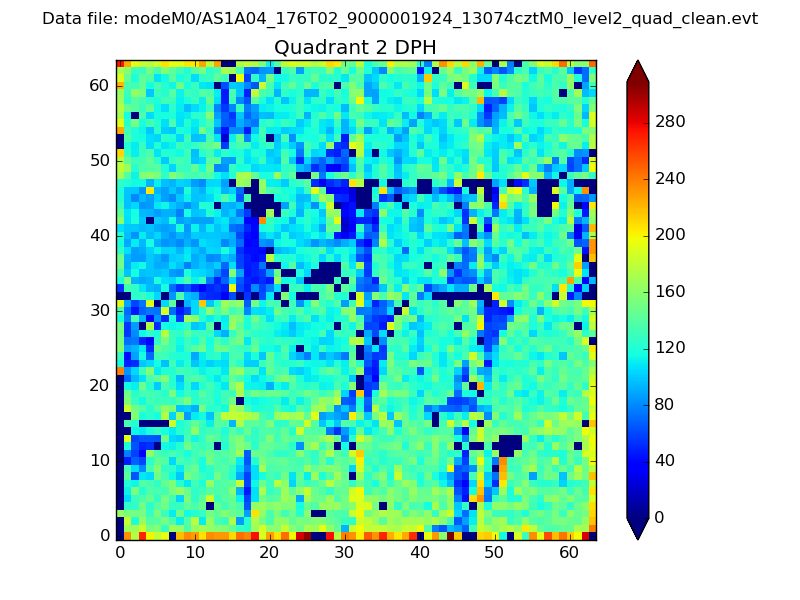
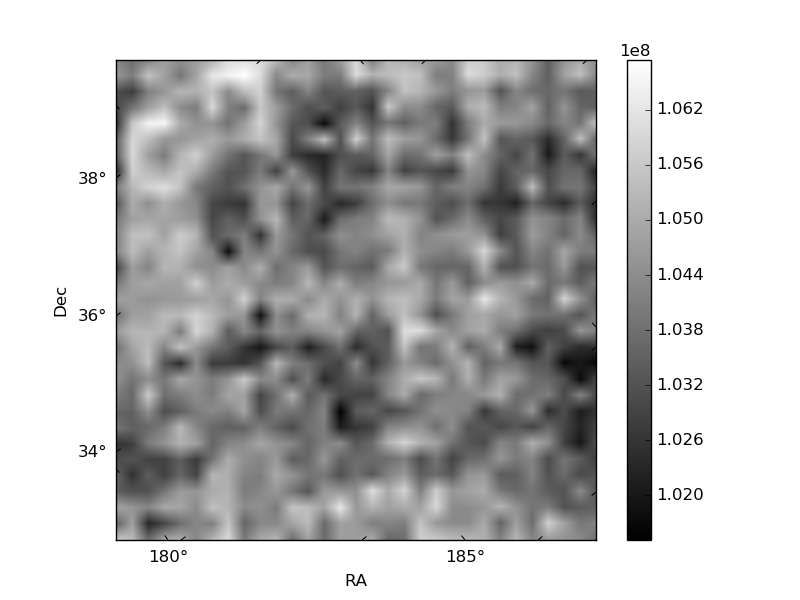
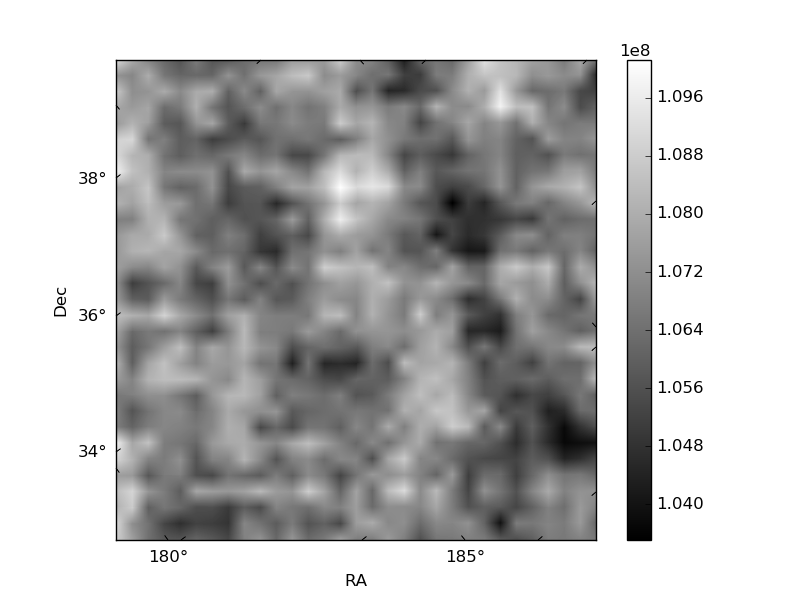
Histogram calculated using DETX and DETY for each event in the final _common_clean file
| Quadrant A | 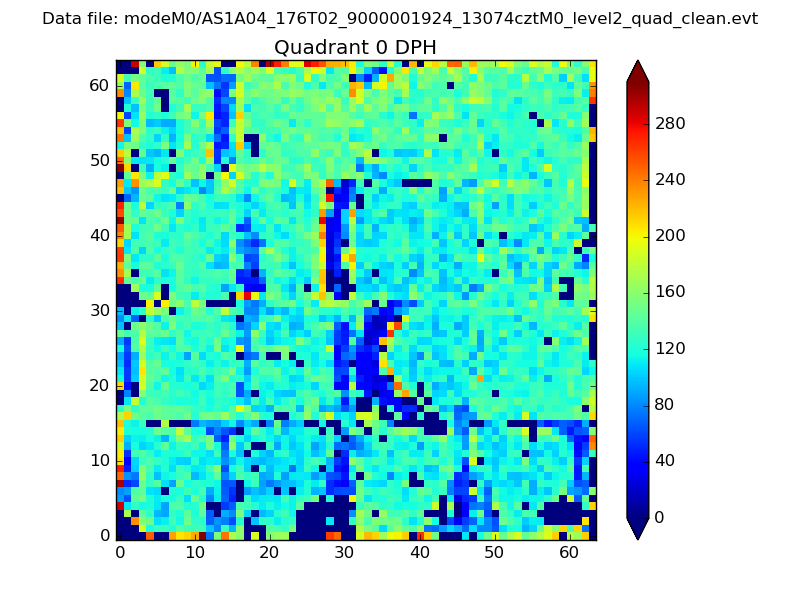 |
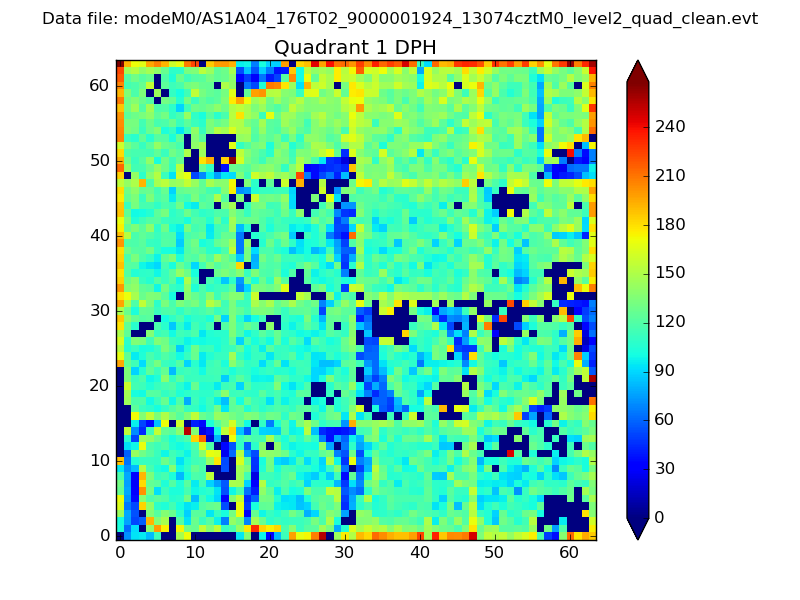 |
Quadrant B |
|---|---|---|---|
| Quadrant D | 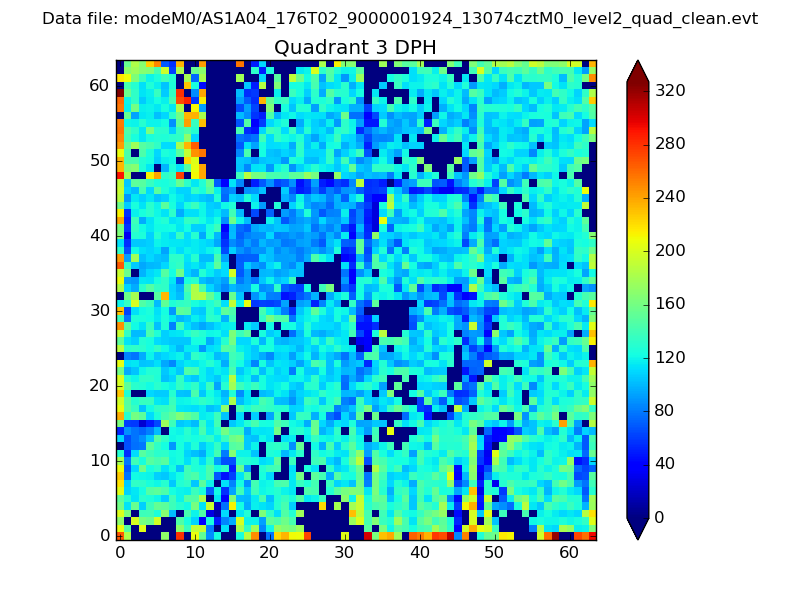 |
 |
Quadrant C |
| Plot type | Count rate plots | Images |
|---|---|---|
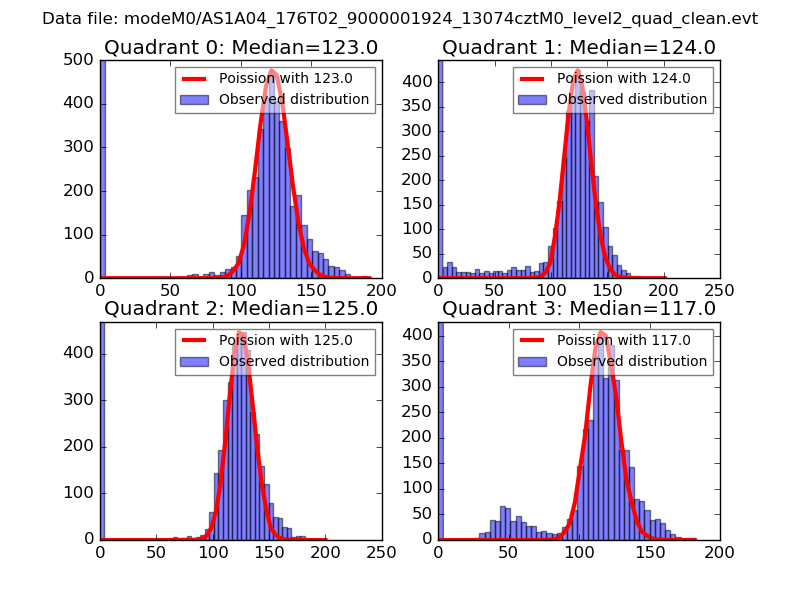
| Comparison with Poisson distribution Blue bars denote a histogram of data divided into 1 sec bins. Red curve is a Poisson curve with rate = median count rate of data. |
 |
 |
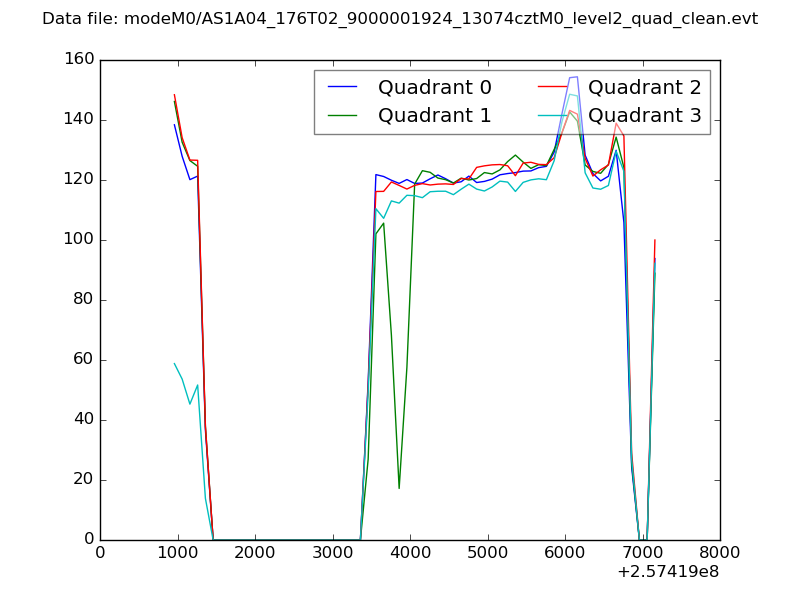
| Quadrant-wise count rates Data is divided into 100 sec bins |
 |
|
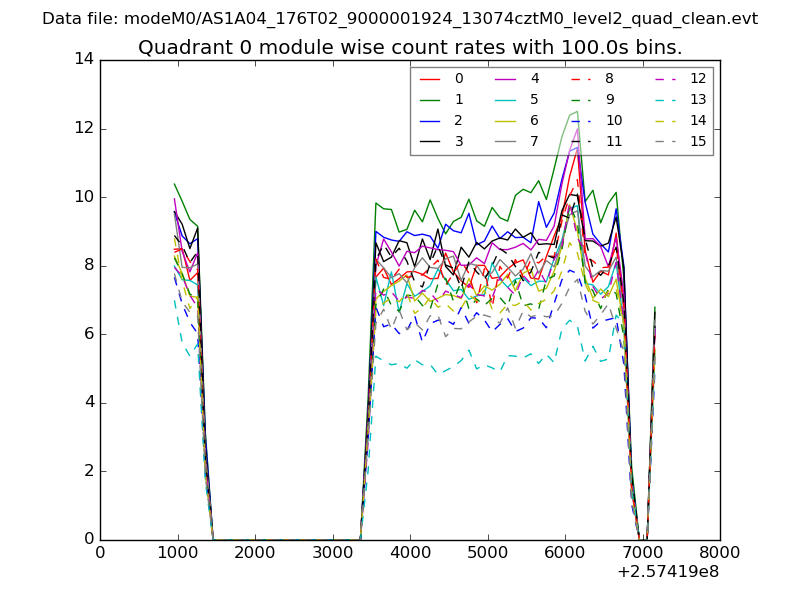
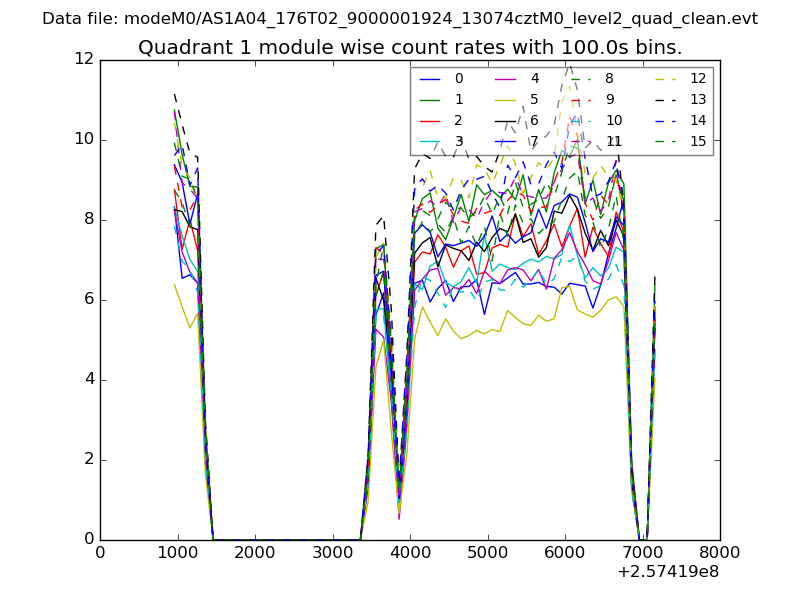
| Module-wise count rates for Quadrant A Data is divided into 100 sec bins |
 |
 |
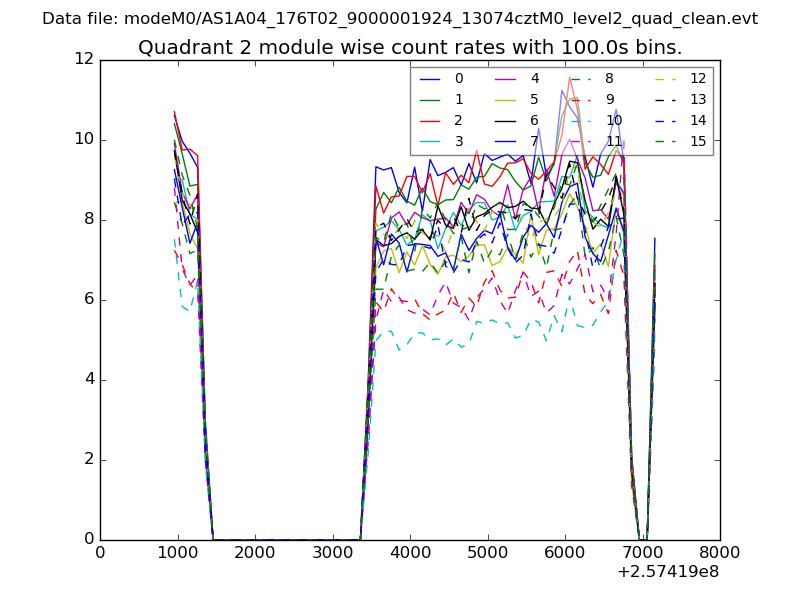
| Module-wise count rates for Quadrant B Data is divided into 100 sec bins |
 |
 |
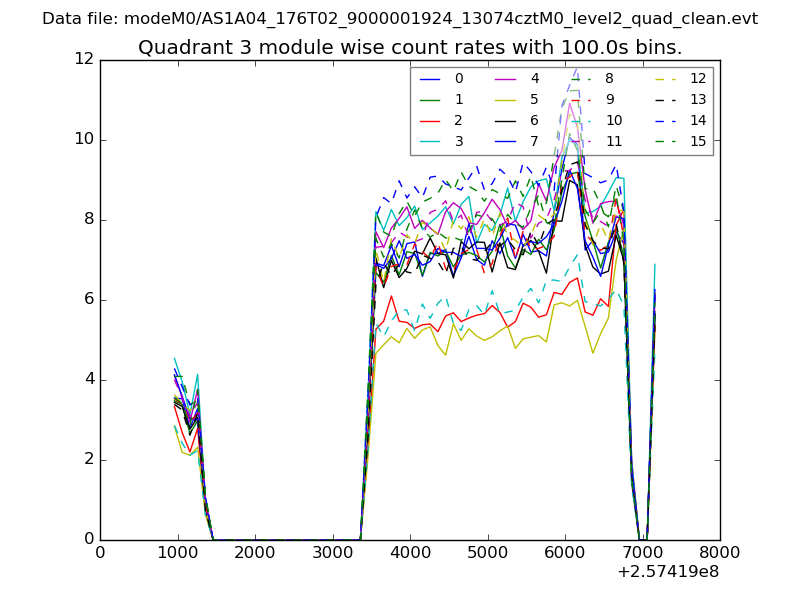
| Module-wise count rates for Quadrant C Data is divided into 100 sec bins |
 |
 |
| Module-wise count rates for Quadrant D Data is divided into 100 sec bins |
 |
 |
| Parameter | Plot |
|---|---|
| CZT HV Monitor | 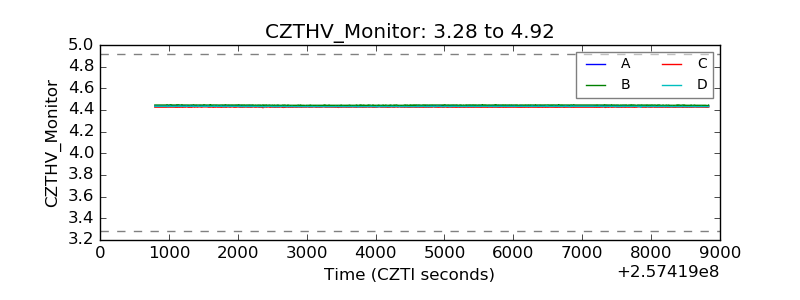 |
| D_VDD | 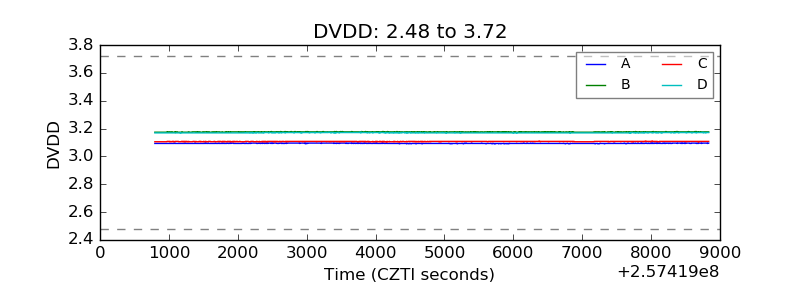 |
| Temperature 1 | 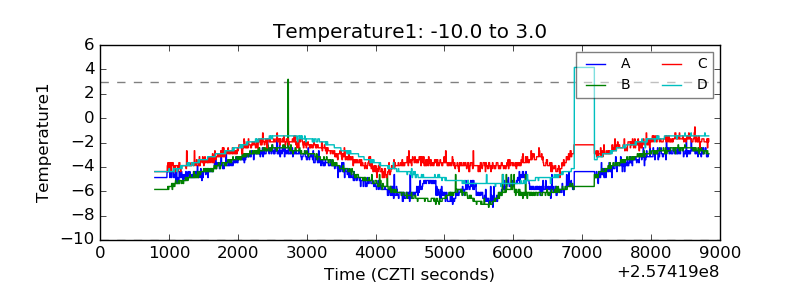 |
| Veto HV Monitor | 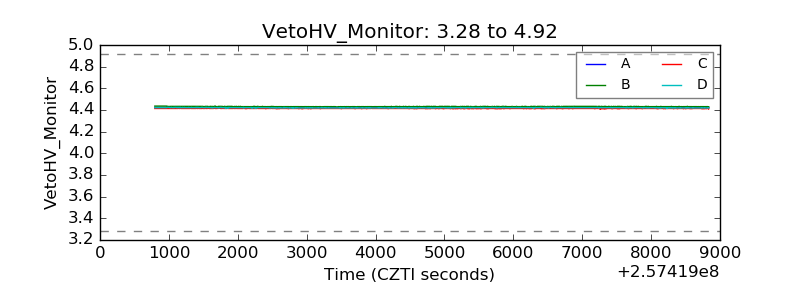 |
| Veto LLD | 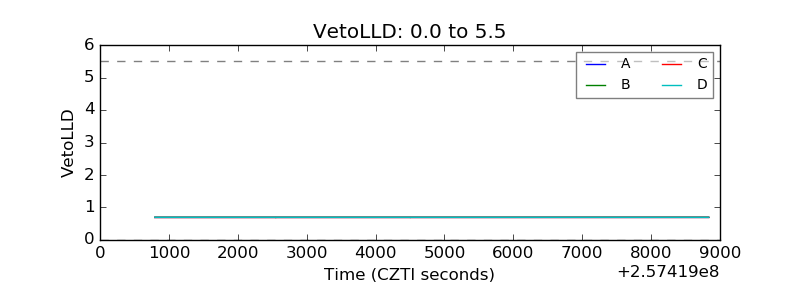 |
| Alpha Counter | 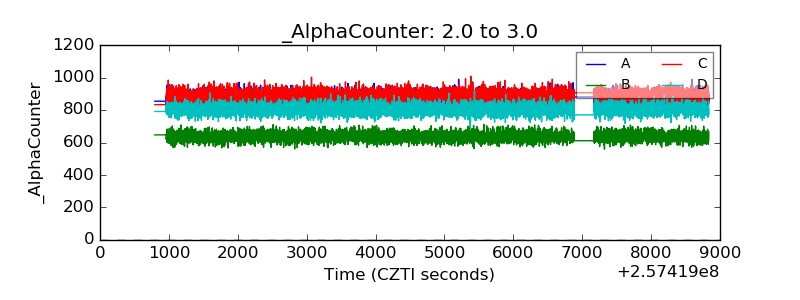 |
| _CPM_Rate | 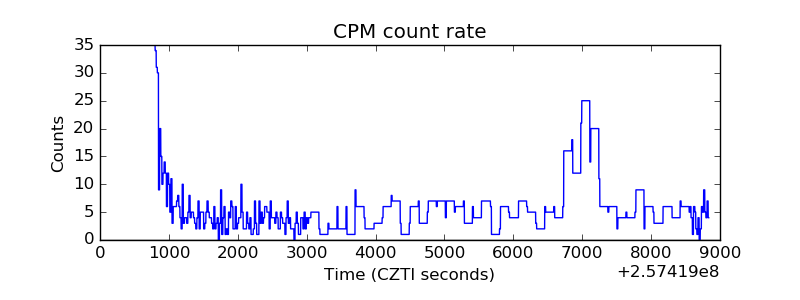 |
| CZT Counter | 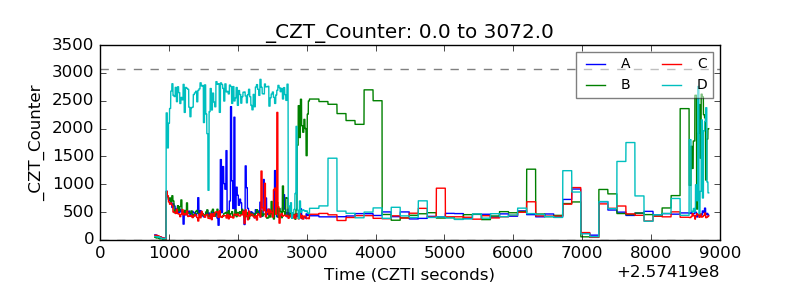 |
| +2.5 Volts monitor |  |
| +5 Volts monitor |  |
| _ROLL_ROT | 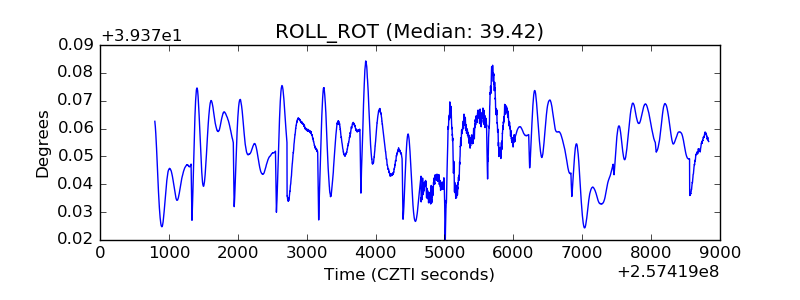 |
| _Roll_DEC | 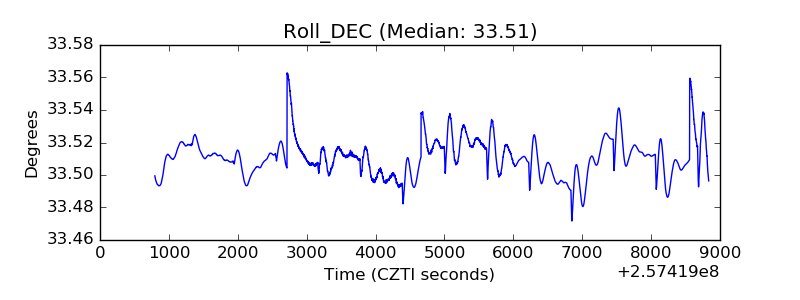 |
| _Roll_RA | 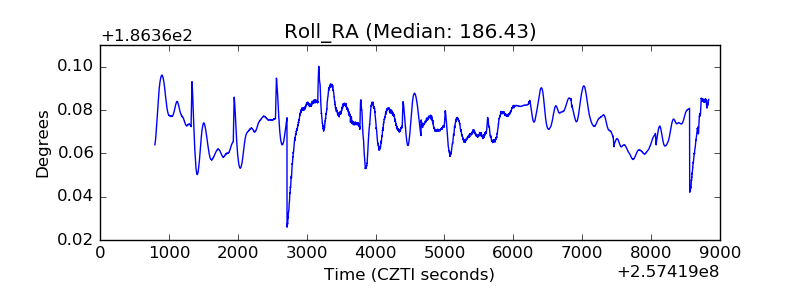 |
| Veto Counter | 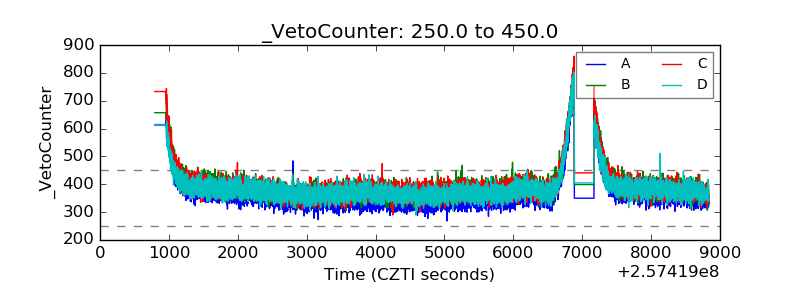 |