| Param | Original file | Final file |
|---|---|---|
| Filename | modeM0/AS1A04_176T02_9000001924_13078cztM0_level2.evt | modeM0/AS1A04_176T02_9000001924_13078cztM0_level2_quad_clean.evt |
| Size (bytes) | 470,099,520 | 45,331,200 |
| Size | 448.3 MB | 43.2 MB |
| Events in quadrant A | 2,291,039 | 290,262 |
| Events in quadrant B | 5,772,433 | 202,938 |
| Events in quadrant C | 2,036,956 | 291,988 |
| Events in quadrant D | 3,837,877 | 278,073 |
| Mode M9 | |||
|---|---|---|---|
| Quadrant | BADHDUFLAG | Total packets | Discarded packets |
| A | 0 | 3 | 0 |
| B | 0 | 3 | 0 |
| C | 0 | 3 | 0 |
| D | 0 | 3 | 0 |
| Mode M0 | |||
|---|---|---|---|
| Quadrant | BADHDUFLAG | Total packets | Discarded packets |
| A | 0 | 9767 | 1 |
| B | 0 | 20149 | 1 |
| C | 0 | 9168 | 1 |
| D | 0 | 14416 | 1 |
| Mode SS | |||
|---|---|---|---|
| Quadrant | BADHDUFLAG | Total packets | Discarded packets |
| A | 0 | 90 | 0 |
| B | 0 | 90 | 0 |
| C | 0 | 90 | 0 |
| D | 0 | 90 | 0 |
| Quadrant | Total seconds | Saturated seconds | Saturation percentage |
|---|---|---|---|
| A | 4391 | 174 | 3.962651% |
| B | 4391 | 2083 | 47.437941% |
| C | 4391 | 119 | 2.710089% |
| D | 4391 | 613 | 13.960373% |
Noise dominated data is calculated using 1-second bins in cleaned event files. If a bin has >2000 counts, and if more than 50% of those come from <1% of pixels, then it is considered to be noise-dominated and hence unusable.
| Quadrant | # 1 sec bins | Bins with >0 counts | Bins with >2000 counts | High rate bins dominated by noise | Noise dominated (total time) | Noise dominated (detector-on time) | Marked lightcurve |
|---|---|---|---|---|---|---|---|
| A | 4637 | 4394 | 18 | 18 | 0.39% | 0.41% | 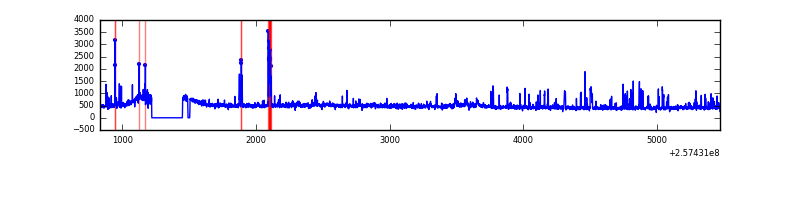 |
| B | 4637 | 4394 | 1342 | 1342 | 28.94% | 30.54% | 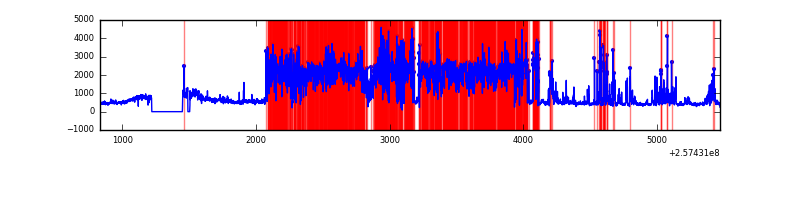 |
| C | 4637 | 4394 | 3 | 3 | 0.06% | 0.07% | 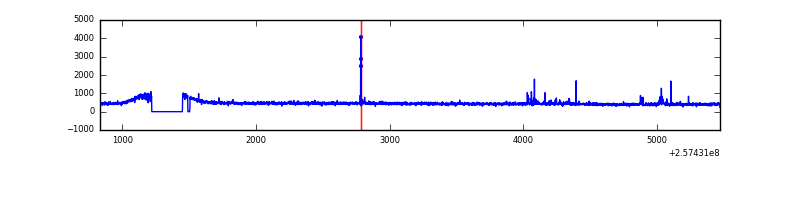 |
| D | 4637 | 4394 | 267 | 267 | 5.76% | 6.08% | 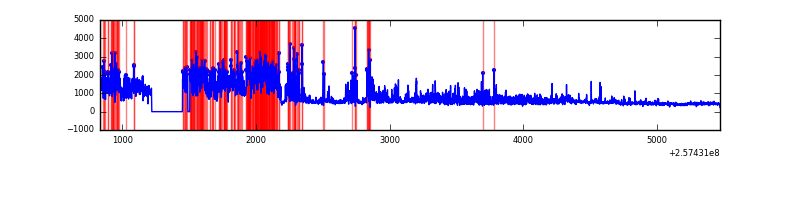 |
Top three noisy pixels from each quadrant. If the there are fewer than three noisy pixels in the level2.evt file, extra rows are filled as -1
| Pixel properties | Quadrant properties | ||||||
|---|---|---|---|---|---|---|---|
| Quadrant | DetID | PixID | Counts | Sigma | Mean | Median | Sigma |
| A | 8 | 15 | 181227 | 1683.49 | 517 | 505 | 107.3 |
| A | 15 | 223 | 53859 | 497.01 | 517 | 505 | 107.3 |
| A | 15 | 239 | 25489 | 232.74 | 517 | 505 | 107.3 |
| B | 4 | 239 | 4237424 | 62451.72 | 343 | 334 | 67.8 |
| B | 0 | 85 | 149033 | 2191.72 | 343 | 334 | 67.8 |
| B | 3 | 64 | 16134 | 232.88 | 343 | 334 | 67.8 |
| C | 15 | 208 | 35961 | 297.43 | 509 | 511 | 119.2 |
| C | 14 | 234 | 12316 | 99.05 | 509 | 511 | 119.2 |
| C | 13 | 61 | 3779 | 27.42 | 509 | 511 | 119.2 |
| D | 1 | 52 | 1489008 | 12630.93 | 484 | 468 | 117.8 |
| D | 10 | 157 | 324870 | 2752.7 | 484 | 468 | 117.8 |
| D | 14 | 34 | 101453 | 856.9 | 484 | 468 | 117.8 |
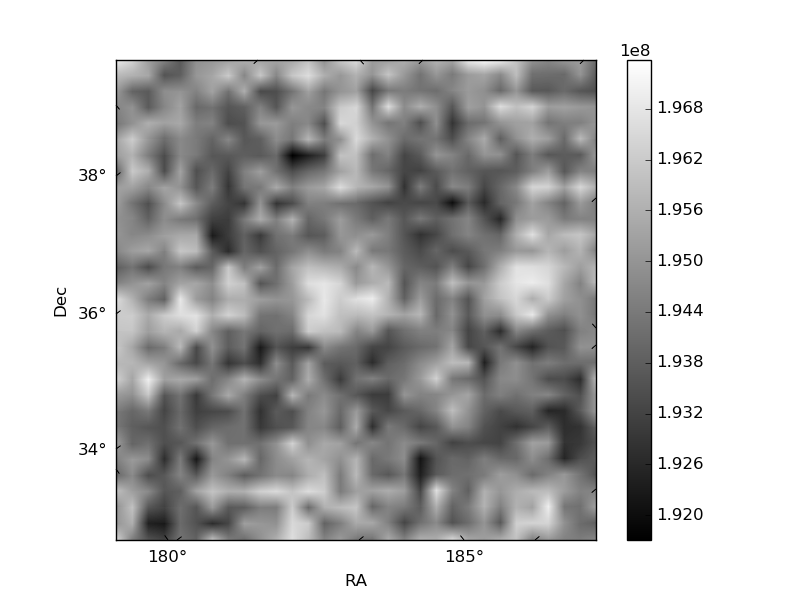
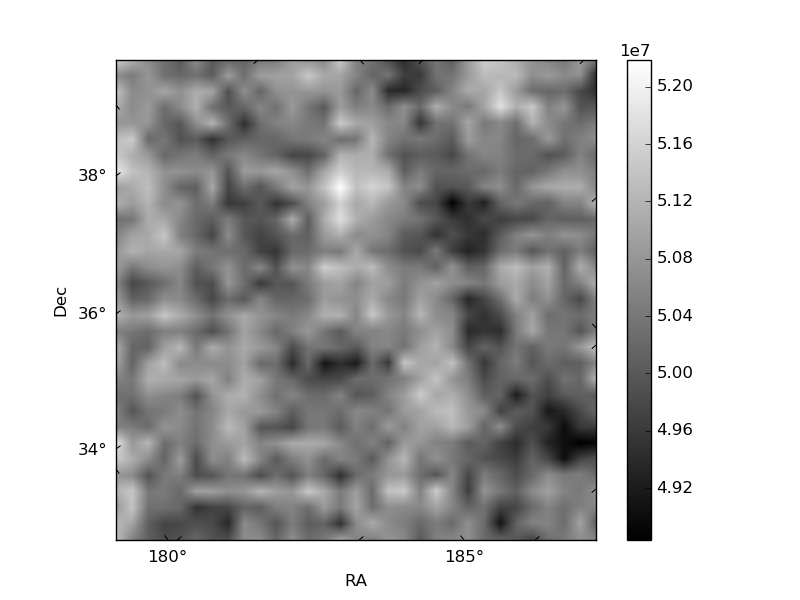
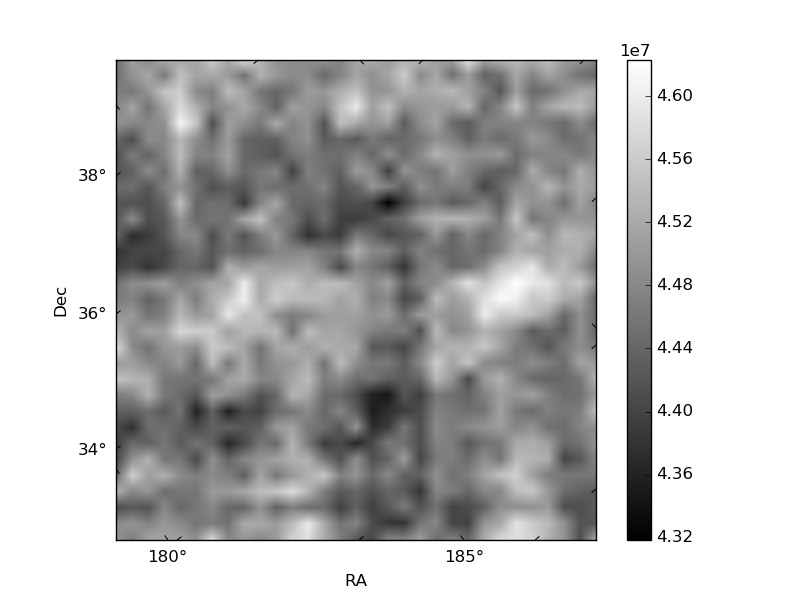
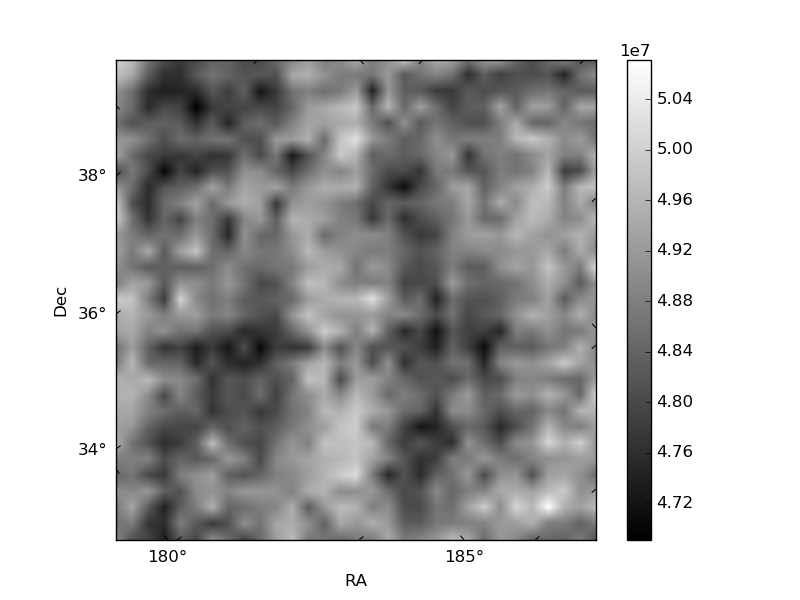
Histogram calculated using DETX and DETY for each event in the final _common_clean file
| Quadrant A | 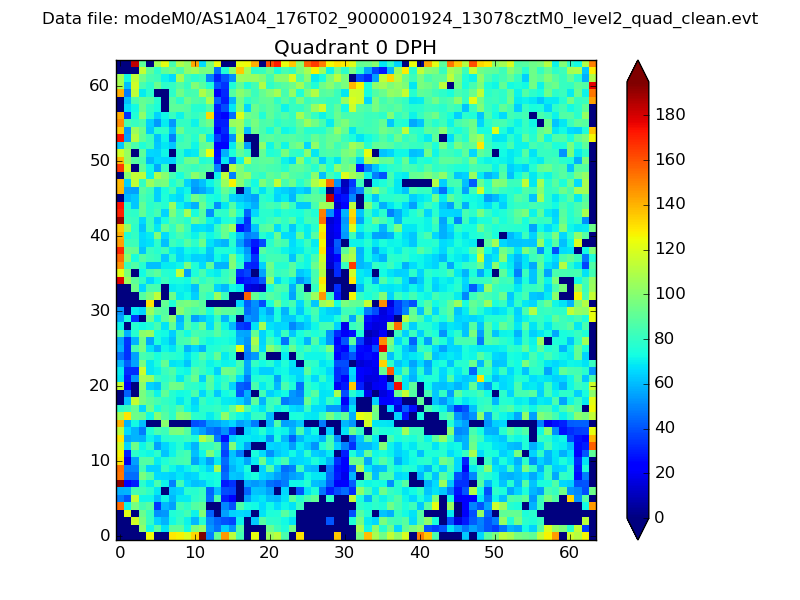 |
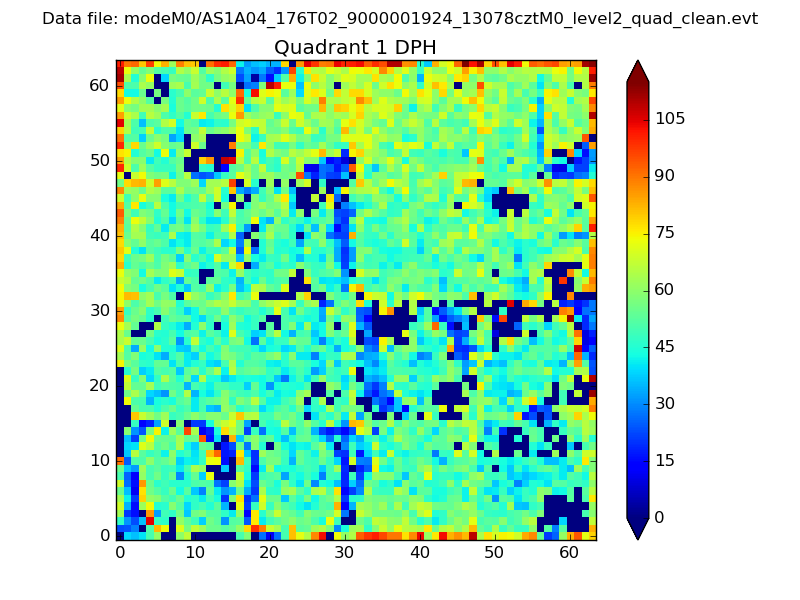 |
Quadrant B |
|---|---|---|---|
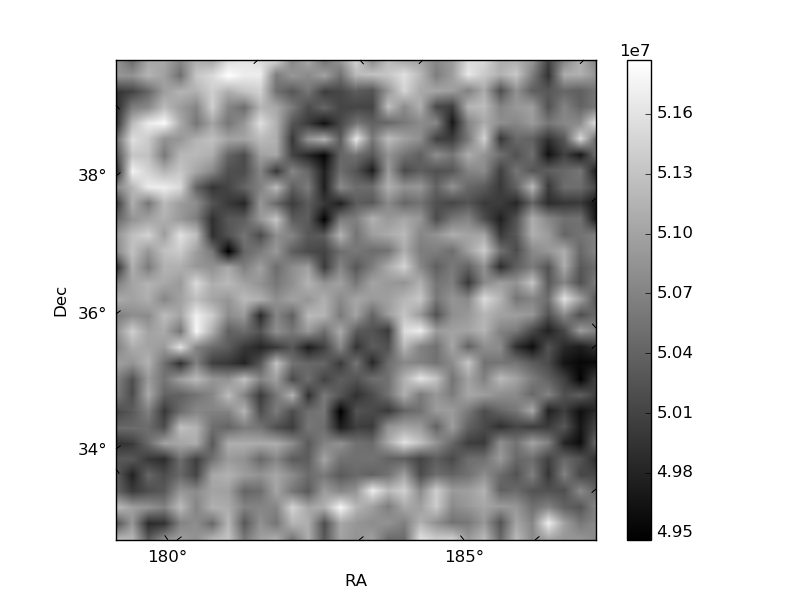
| Quadrant D | 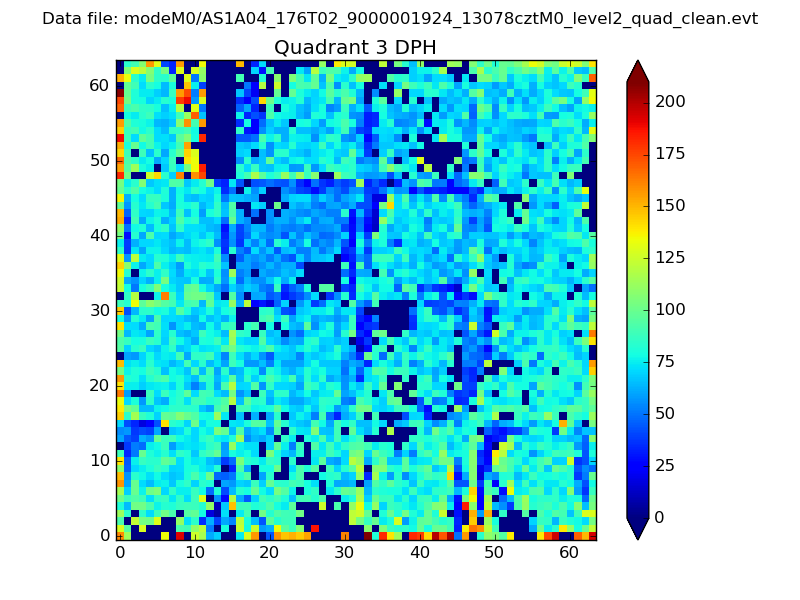 |
 |
Quadrant C |
| Plot type | Count rate plots | Images |
|---|---|---|
| Comparison with Poisson distribution Blue bars denote a histogram of data divided into 1 sec bins. Red curve is a Poisson curve with rate = median count rate of data. |
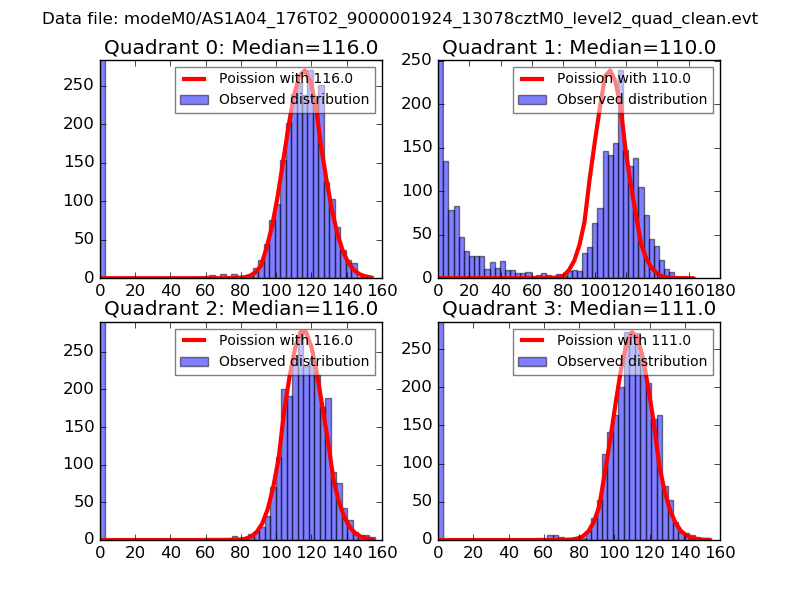 |
 |
| Quadrant-wise count rates Data is divided into 100 sec bins |
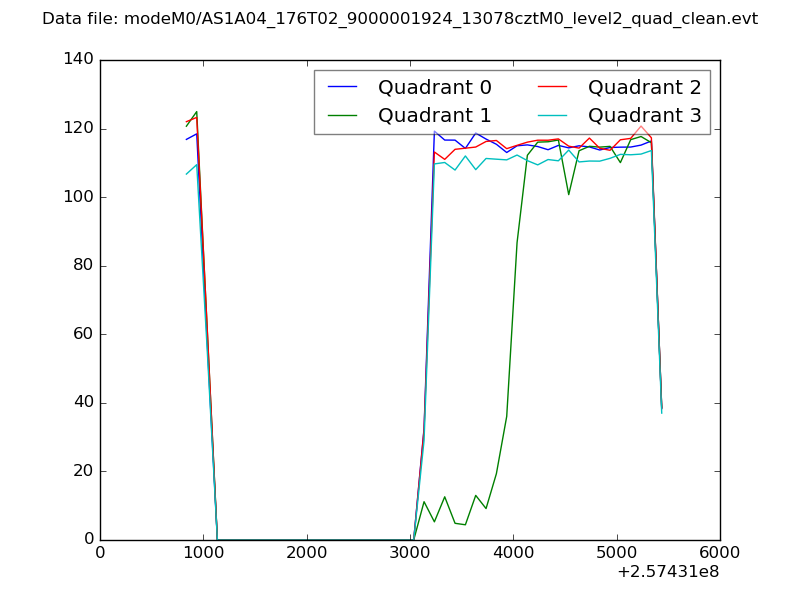 |
|
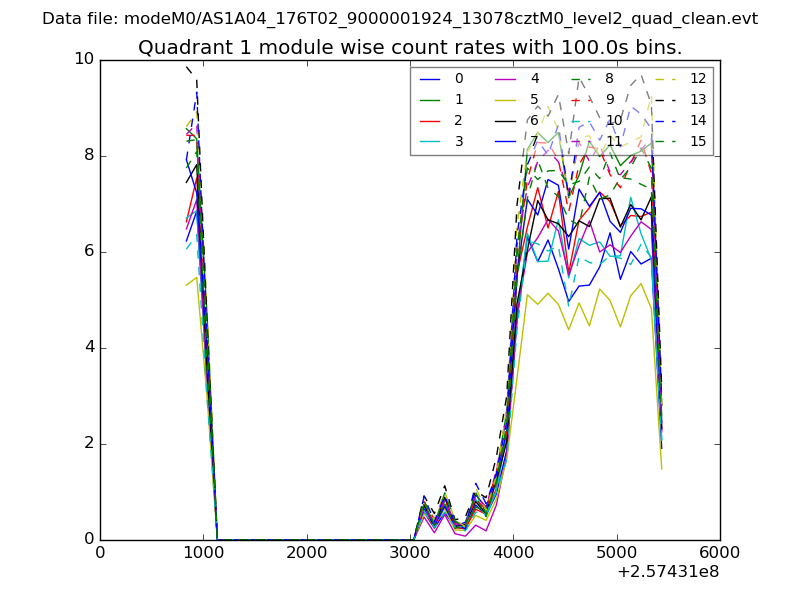
| Module-wise count rates for Quadrant A Data is divided into 100 sec bins |
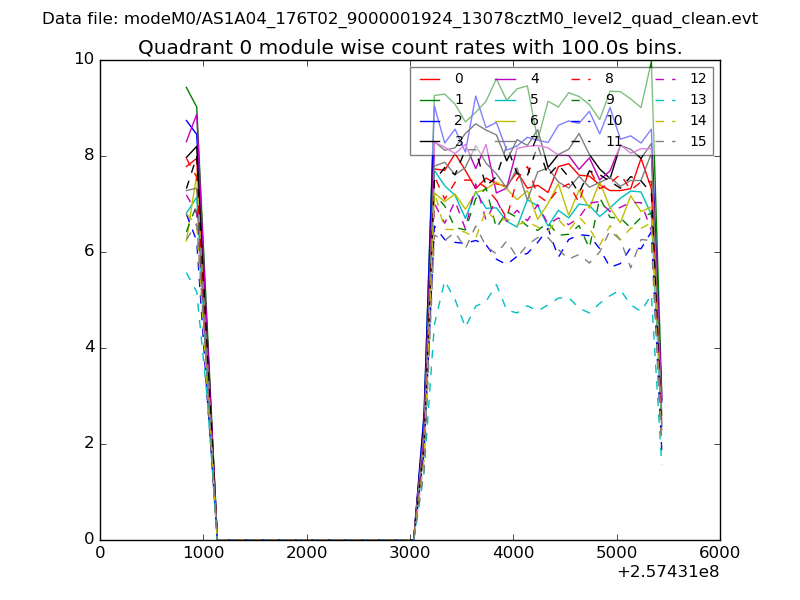 |
 |
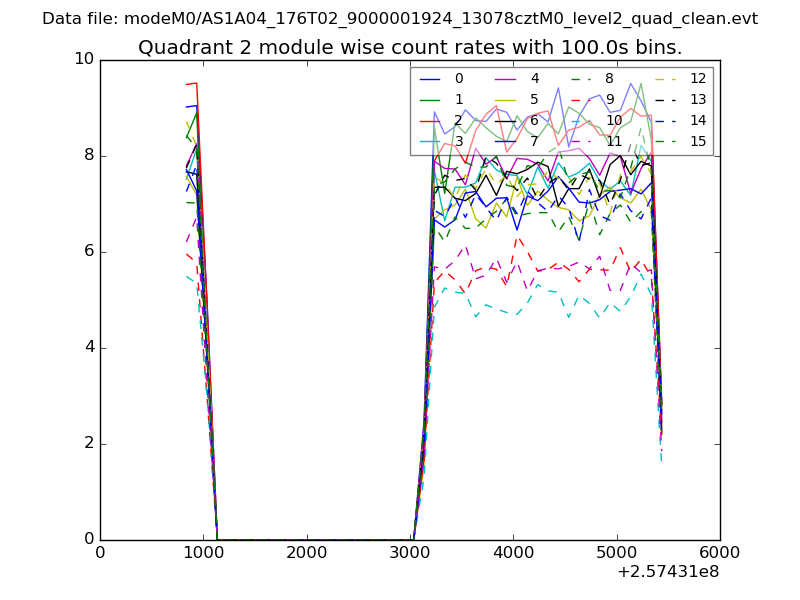
| Module-wise count rates for Quadrant B Data is divided into 100 sec bins |
 |
 |
| Module-wise count rates for Quadrant C Data is divided into 100 sec bins |
 |
 |
| Module-wise count rates for Quadrant D Data is divided into 100 sec bins |
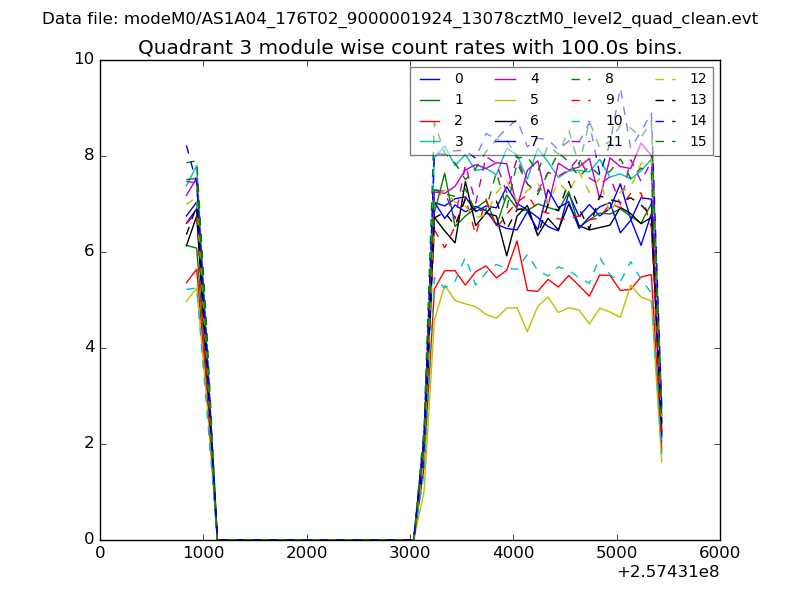 |
 |
| Parameter | Plot |
|---|---|
| CZT HV Monitor | 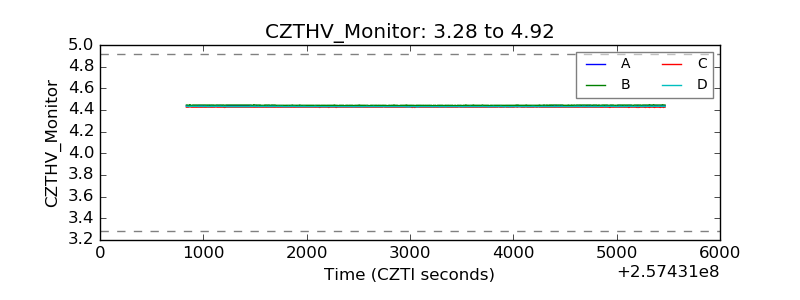 |
| D_VDD | 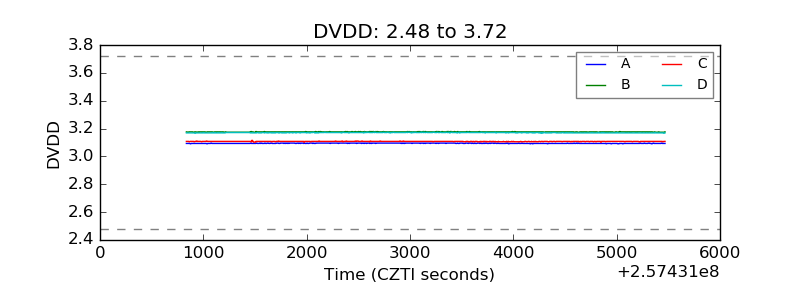 |
| Temperature 1 | 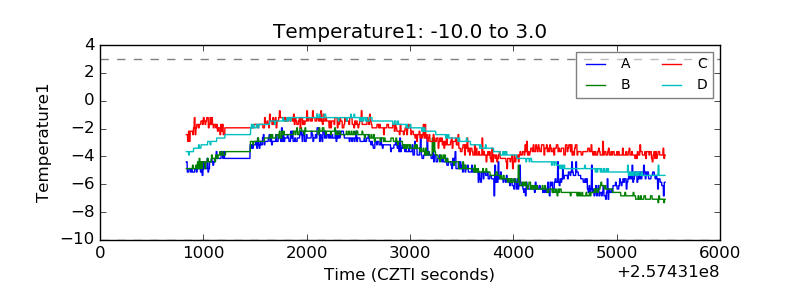 |
| Veto HV Monitor | 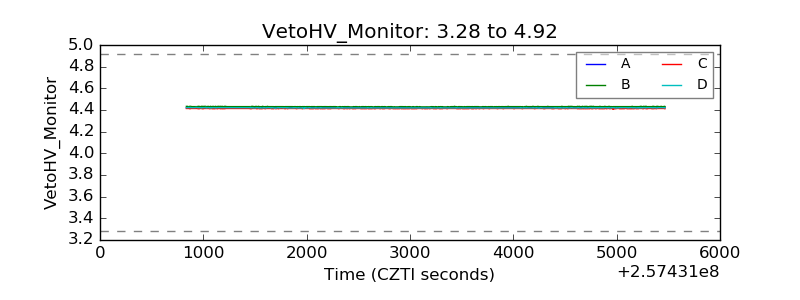 |
| Veto LLD | 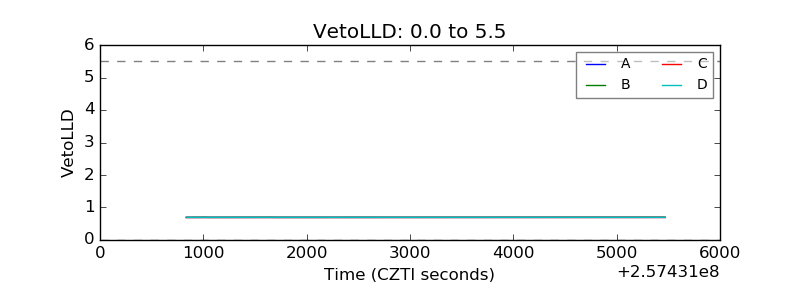 |
| Alpha Counter | 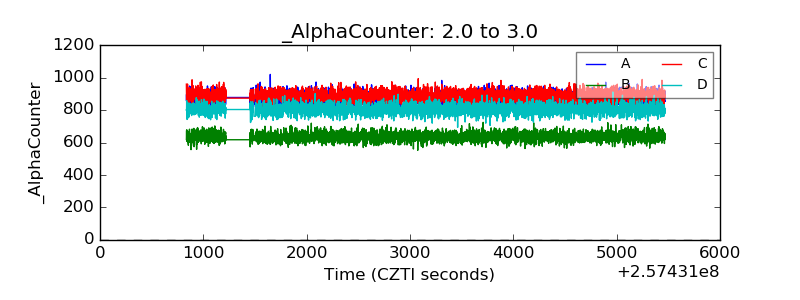 |
| _CPM_Rate | 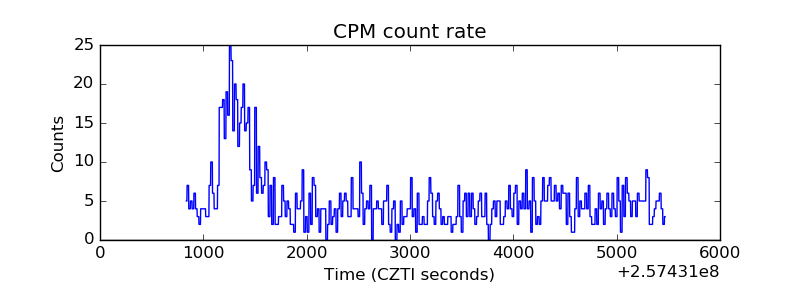 |
| CZT Counter | 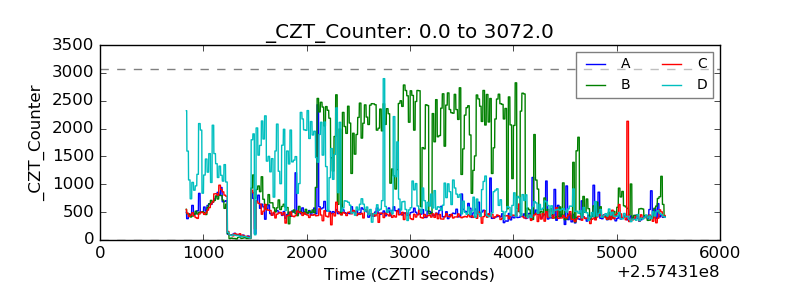 |
| +2.5 Volts monitor | 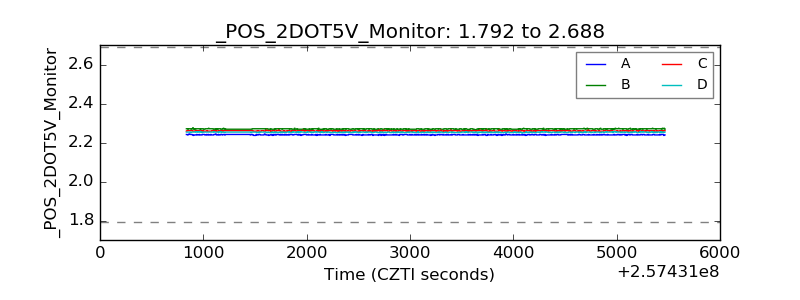 |
| +5 Volts monitor |  |
| _ROLL_ROT | 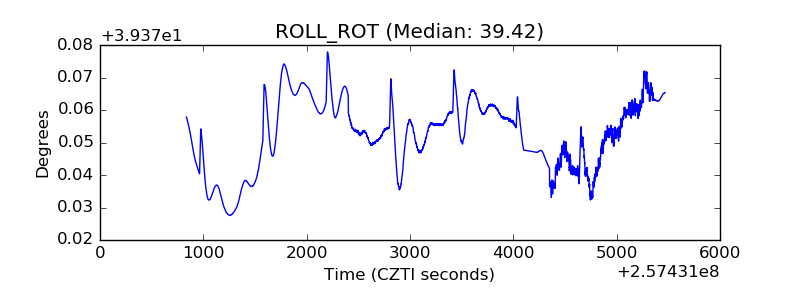 |
| _Roll_DEC | 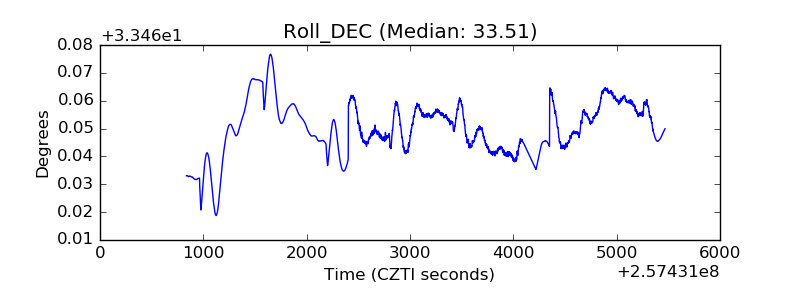 |
| _Roll_RA | 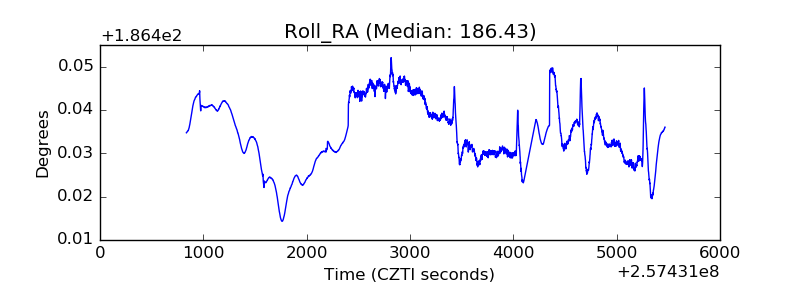 |
| Veto Counter |  |