| Param | Original file | Final file |
|---|---|---|
| Filename | modeM0/AS1C03_023T01_9000001930cztM0_level2.fits | modeM0/AS1C03_023T01_9000001930cztM0_level2_quad_clean.evt |
| Size (bytes) | 661,547,520 | 612,288,000 |
| Size | 630.9 MB | 583.9 MB |
| Events in quadrant A | 4,070,308 | 3,624,406 |
| Events in quadrant B | 3,540,896 | 3,309,837 |
| Events in quadrant C | 4,081,126 | 3,558,931 |
| Events in quadrant D | 3,432,826 | 3,146,899 |
| Mode M0 | |||
|---|---|---|---|
| Quadrant | BADHDUFLAG | Total packets | Discarded packets |
| A | 0 | 159101 | 0 |
| B | 0 | 232487 | 0 |
| C | 0 | 146809 | 0 |
| D | 0 | 207221 | 0 |
| Mode M9 | |||
|---|---|---|---|
| Quadrant | BADHDUFLAG | Total packets | Discarded packets |
| A | 0 | 115 | 0 |
| B | 0 | 115 | 0 |
| C | 0 | 115 | 0 |
| D | 0 | 115 | 0 |
| Mode SS | |||
|---|---|---|---|
| Quadrant | BADHDUFLAG | Total packets | Discarded packets |
| A | 0 | 1456 | 0 |
| B | 0 | 1456 | 0 |
| C | 0 | 1456 | 0 |
| D | 0 | 1456 | 0 |
| Quadrant | Total seconds | Saturated seconds | Saturation percentage |
|---|---|---|---|
| A | 71488 | 1672 | 2.338854% |
| B | 71489 | 12676 | 17.731399% |
| C | 71489 | 498 | 0.696611% |
| D | 71489 | 4414 | 6.174376% |
Noise dominated data is calculated using 1-second bins in cleaned event files. If a bin has >2000 counts, and if more than 50% of those come from <1% of pixels, then it is considered to be noise-dominated and hence unusable.
| Quadrant | # 1 sec bins | Bins with >0 counts | Bins with >2000 counts | High rate bins dominated by noise | Noise dominated (total time) | Noise dominated (detector-on time) | Marked lightcurve |
|---|---|---|---|---|---|---|---|
| A | 85061 | 71484 | 0 | 0 | 0.00% | 0.00% |  |
| B | 85061 | 70487 | 0 | 0 | 0.00% | 0.00% |  |
| C | 85061 | 71491 | 0 | 0 | 0.00% | 0.00% |  |
| D | 85061 | 71479 | 0 | 0 | 0.00% | 0.00% |  |
Top three noisy pixels from each quadrant. If the there are fewer than three noisy pixels in the level2.evt file, extra rows are filled as -1
| Pixel properties | Quadrant properties | ||||||
|---|---|---|---|---|---|---|---|
| Quadrant | DetID | PixID | Counts | Sigma | Mean | Median | Sigma |
| A | 0 | 29 | 4079 | 11.75 | 1060 | 988 | 263.1 |
| A | 7 | 110 | 3283 | 8.72 | 1060 | 988 | 263.1 |
| A | 0 | 30 | 3056 | 7.86 | 1060 | 988 | 263.1 |
| B | 2 | 9 | 3121 | 12.0 | 932 | 886 | 186.2 |
| B | 14 | 254 | 2419 | 8.23 | 932 | 886 | 186.2 |
| B | 3 | 17 | 2391 | 8.08 | 932 | 886 | 186.2 |
| C | 12 | 241 | 2823 | 6.46 | 1079 | 1000 | 282.1 |
| C | 3 | 158 | 2742 | 6.18 | 1079 | 1000 | 282.1 |
| C | 3 | 126 | 2699 | 6.02 | 1079 | 1000 | 282.1 |
| D | 6 | 231 | 2579 | 6.38 | 981 | 894 | 264.0 |
| D | 3 | 14 | 2559 | 6.31 | 981 | 894 | 264.0 |
| D | 7 | 3 | 2469 | 5.96 | 981 | 894 | 264.0 |
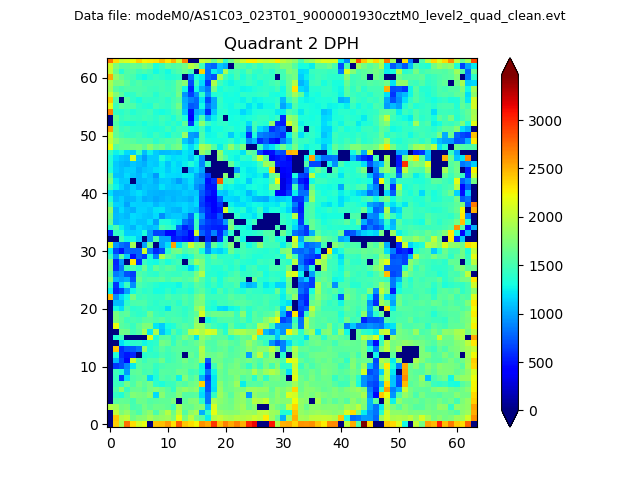
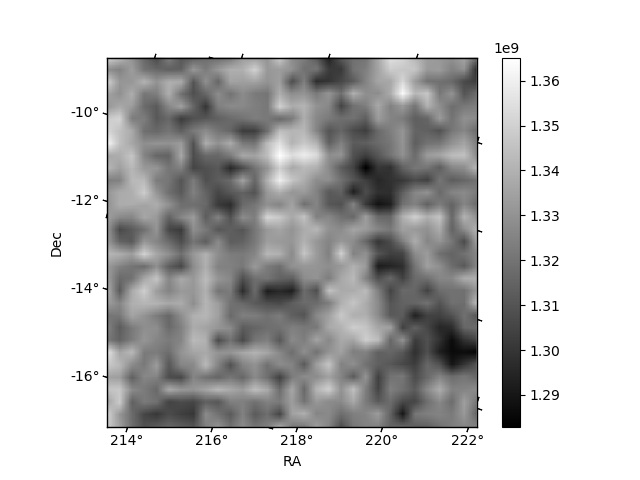
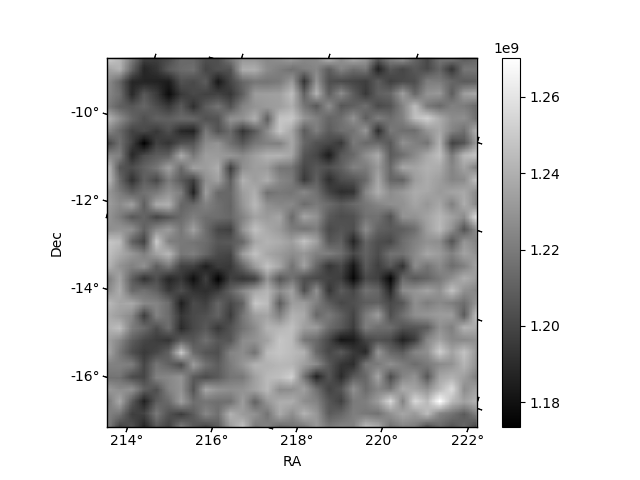
Histogram calculated using DETX and DETY for each event in the final _common_clean file
| Quadrant A |  |
 |
Quadrant B |
|---|---|---|---|
| Quadrant D | 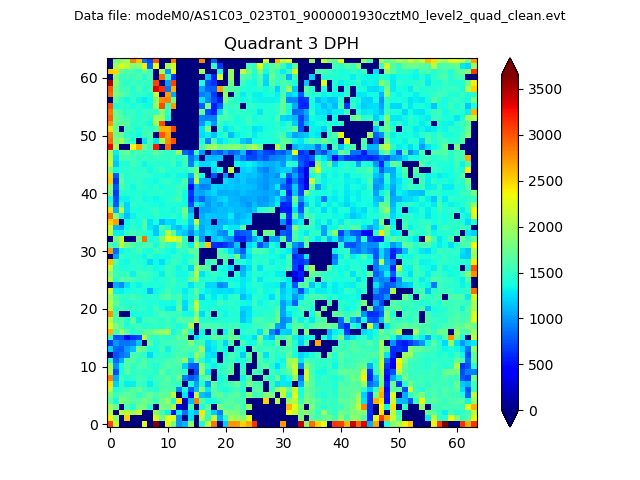 |
 |
Quadrant C |
| Plot type | Count rate plots | Images |
|---|---|---|
| Comparison with Poisson distribution Blue bars denote a histogram of data divided into 1 sec bins. Red curve is a Poisson curve with rate = median count rate of data. |
 |
 |
| Quadrant-wise count rates Data is divided into 100 sec bins |
 |
|
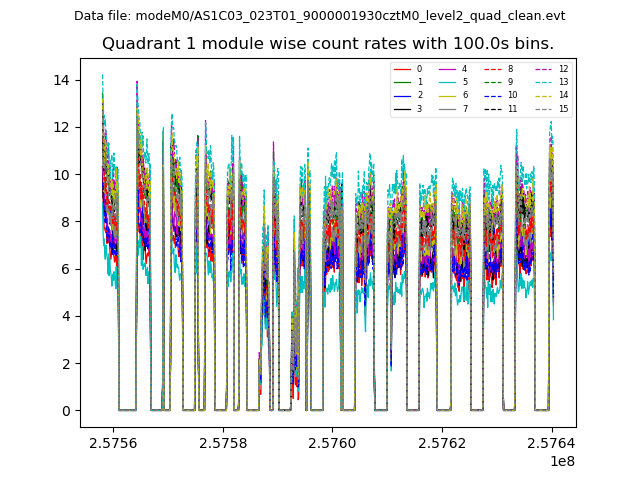
| Module-wise count rates for Quadrant A Data is divided into 100 sec bins |
 |
 |
| Module-wise count rates for Quadrant B Data is divided into 100 sec bins |
 |
 |
| Module-wise count rates for Quadrant C Data is divided into 100 sec bins |
 |
 |
| Module-wise count rates for Quadrant D Data is divided into 100 sec bins |
 |
 |
| Parameter | Plot |
|---|---|
| CZT HV Monitor | 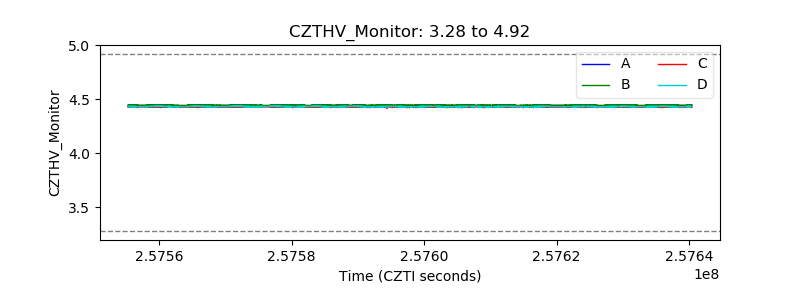 |
| D_VDD | 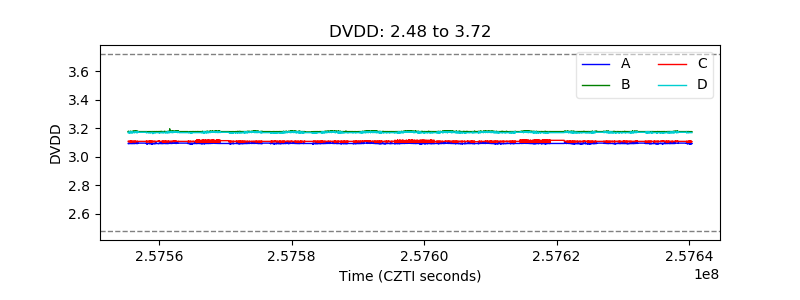 |
| Temperature 1 |  |
| Veto HV Monitor | 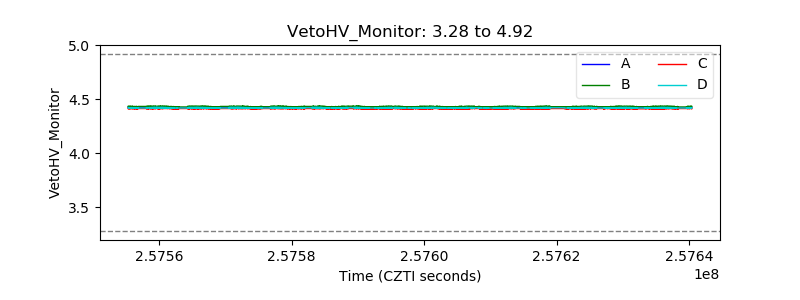 |
| Veto LLD |  |
| Alpha Counter |  |
| _CPM_Rate | 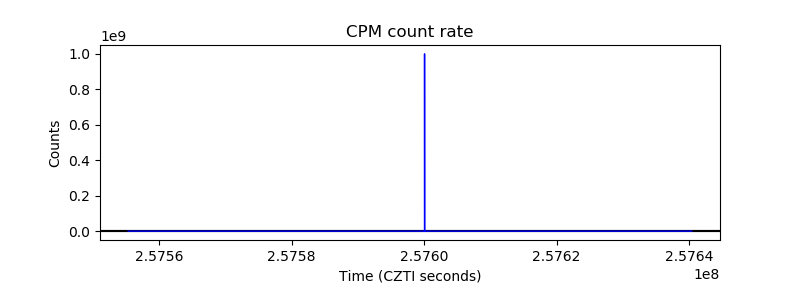 |
| CZT Counter |  |
| +2.5 Volts monitor | 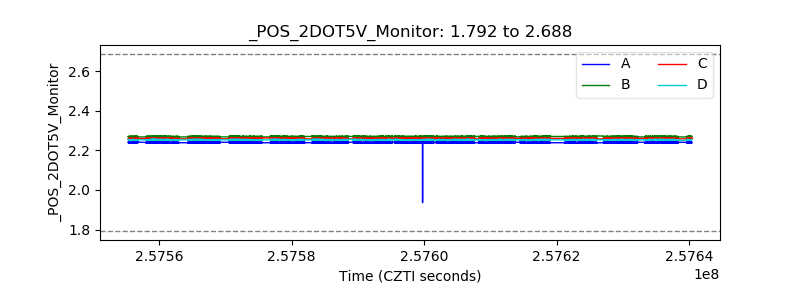 |
| +5 Volts monitor |  |
| _ROLL_ROT | 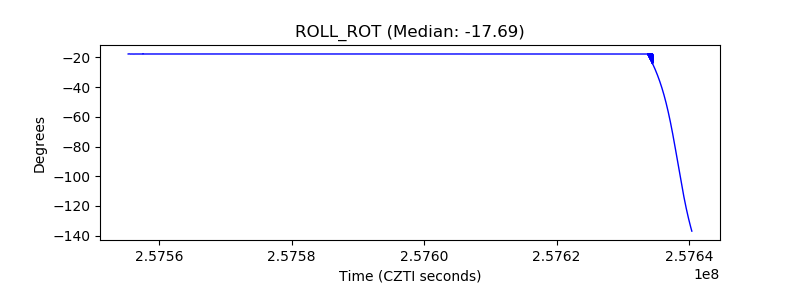 |
| _Roll_DEC | 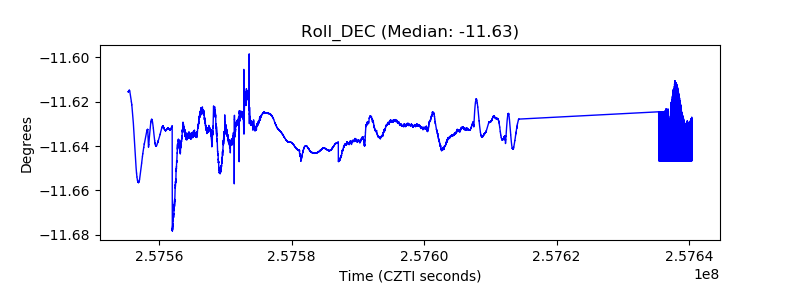 |
| _Roll_RA |  |
| Veto Counter |  |