| Param | Original file | Final file |
|---|---|---|
| Filename | modeM0/AS1C03_023T01_9000001930_13098cztM0_level2.evt | modeM0/AS1C03_023T01_9000001930_13098cztM0_level2_quad_clean.evt |
| Size (bytes) | 583,983,360 | 98,784,000 |
| Size | 556.9 MB | 94.2 MB |
| Events in quadrant A | 4,666,860 | 622,223 |
| Events in quadrant B | 4,868,547 | 659,151 |
| Events in quadrant C | 3,162,389 | 650,485 |
| Events in quadrant D | 4,546,300 | 604,965 |
| Mode M0 | |||
|---|---|---|---|
| Quadrant | BADHDUFLAG | Total packets | Discarded packets |
| A | 0 | 17978 | 3 |
| B | 0 | 18606 | 2 |
| C | 0 | 13480 | 2 |
| D | 0 | 18088 | 2 |
| Mode M9 | |||
|---|---|---|---|
| Quadrant | BADHDUFLAG | Total packets | Discarded packets |
| A | 0 | 16 | 0 |
| B | 0 | 16 | 0 |
| C | 0 | 16 | 0 |
| D | 0 | 17 | 0 |
| Mode SS | |||
|---|---|---|---|
| Quadrant | BADHDUFLAG | Total packets | Discarded packets |
| A | 0 | 132 | 0 |
| B | 0 | 132 | 0 |
| C | 0 | 132 | 0 |
| D | 0 | 132 | 0 |
| Quadrant | Total seconds | Saturated seconds | Saturation percentage |
|---|---|---|---|
| A | 6523 | 526 | 8.063774% |
| B | 6523 | 729 | 11.175839% |
| C | 6523 | 12 | 0.183964% |
| D | 6523 | 64 | 0.981144% |
Noise dominated data is calculated using 1-second bins in cleaned event files. If a bin has >2000 counts, and if more than 50% of those come from <1% of pixels, then it is considered to be noise-dominated and hence unusable.
| Quadrant | # 1 sec bins | Bins with >0 counts | Bins with >2000 counts | High rate bins dominated by noise | Noise dominated (total time) | Noise dominated (detector-on time) | Marked lightcurve |
|---|---|---|---|---|---|---|---|
| A | 7824 | 6525 | 368 | 368 | 4.70% | 5.64% | 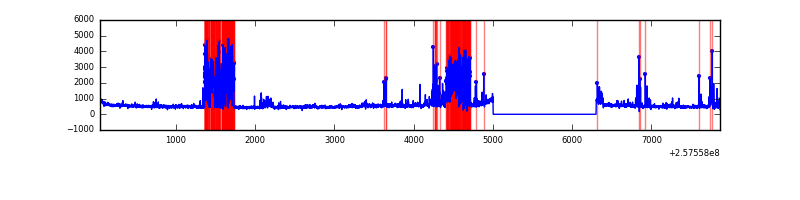 |
| B | 7824 | 6525 | 410 | 410 | 5.24% | 6.28% | 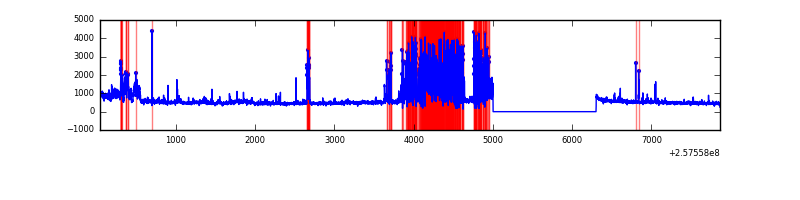 |
| C | 7824 | 6525 | 1 | 1 | 0.01% | 0.02% | 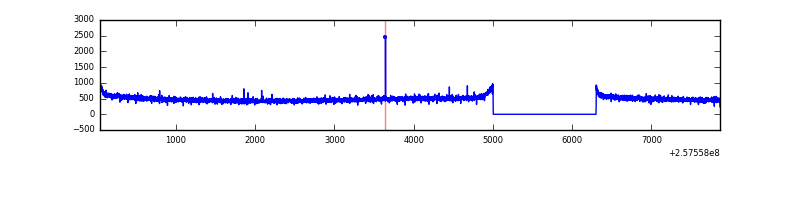 |
| D | 7824 | 6525 | 48 | 48 | 0.61% | 0.74% | 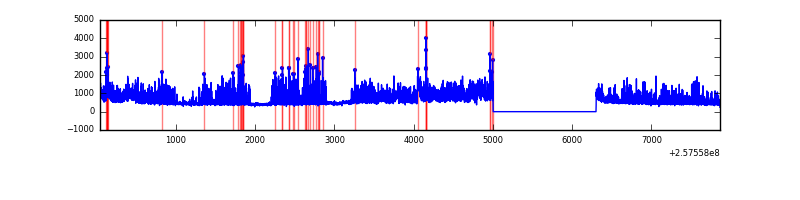 |
Top three noisy pixels from each quadrant. If the there are fewer than three noisy pixels in the level2.evt file, extra rows are filled as -1
| Pixel properties | Quadrant properties | ||||||
|---|---|---|---|---|---|---|---|
| Quadrant | DetID | PixID | Counts | Sigma | Mean | Median | Sigma |
| A | 15 | 223 | 932639 | 5760.21 | 795 | 781 | 161.8 |
| A | 15 | 239 | 416304 | 2568.52 | 795 | 781 | 161.8 |
| A | 12 | 189 | 136178 | 836.95 | 795 | 781 | 161.8 |
| B | 4 | 239 | 1325844 | 9223.4 | 773 | 757 | 143.7 |
| B | 0 | 85 | 466859 | 3244.35 | 773 | 757 | 143.7 |
| B | 12 | 111 | 16302 | 108.2 | 773 | 757 | 143.7 |
| C | 14 | 234 | 6403 | 29.9 | 808 | 814 | 186.9 |
| C | 13 | 61 | 5904 | 27.23 | 808 | 814 | 186.9 |
| C | 8 | 222 | 4129 | 17.74 | 808 | 814 | 186.9 |
| D | 10 | 157 | 1128947 | 5885.23 | 793 | 771 | 191.7 |
| D | 8 | 195 | 282080 | 1467.47 | 793 | 771 | 191.7 |
| D | 12 | 110 | 57280 | 294.78 | 793 | 771 | 191.7 |
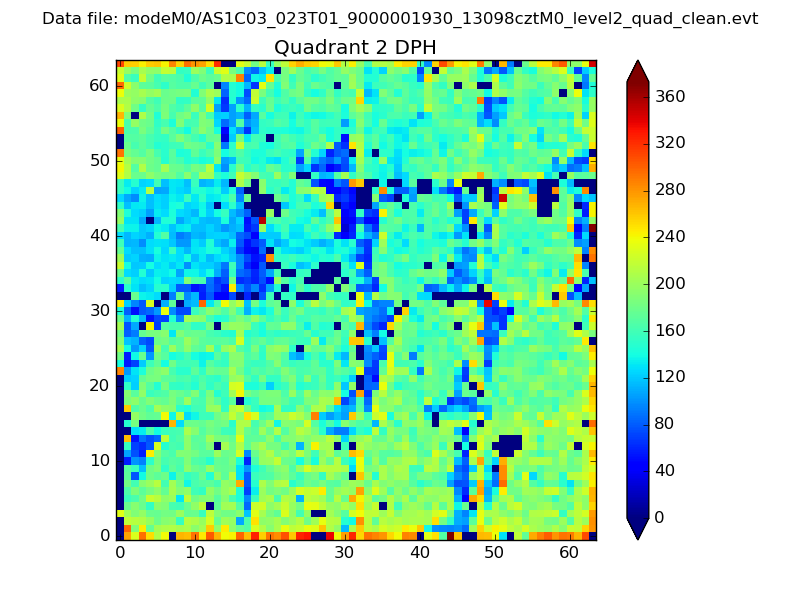
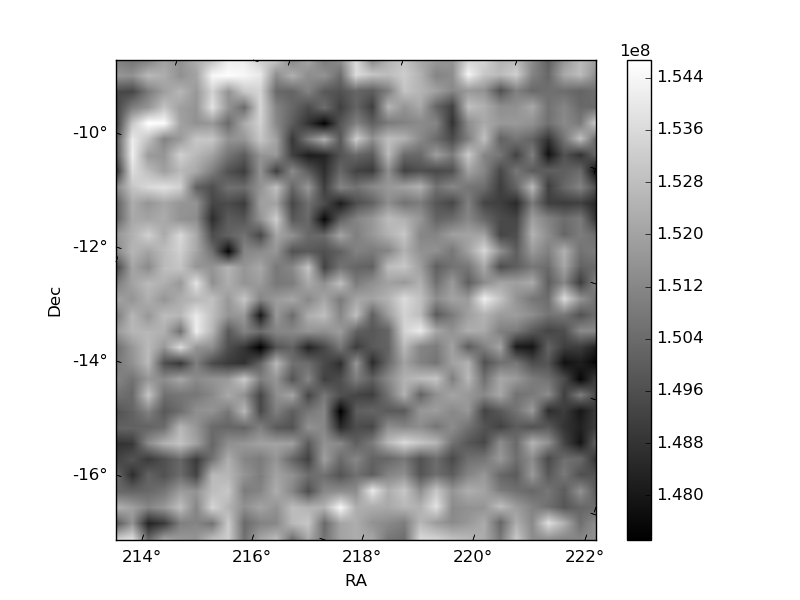
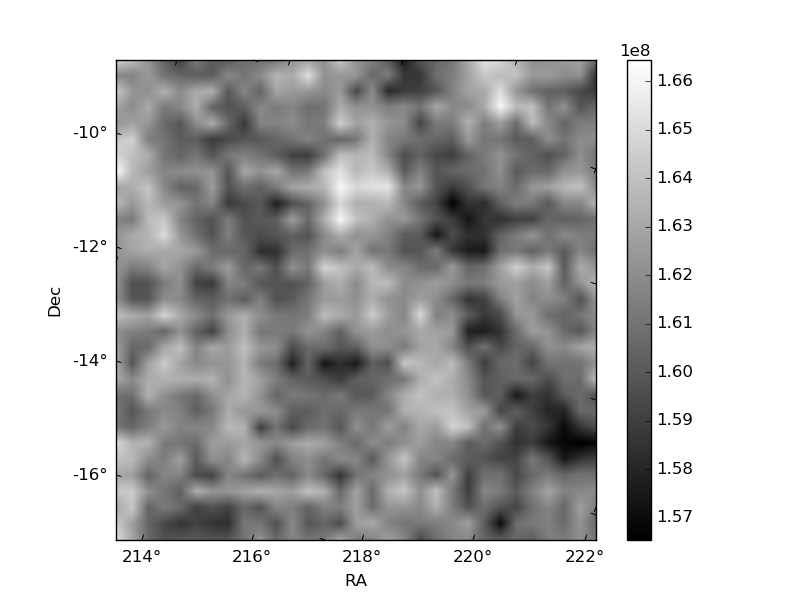
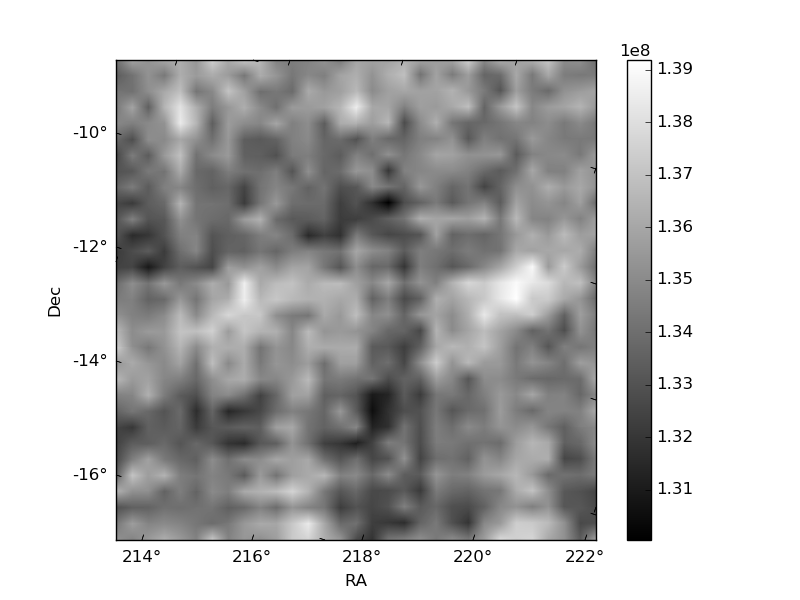
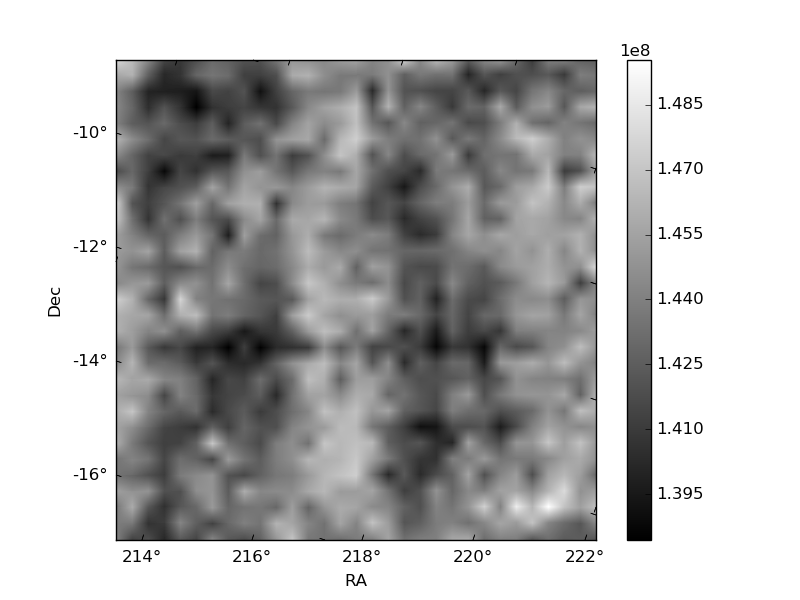
Histogram calculated using DETX and DETY for each event in the final _common_clean file
| Quadrant A |  |
 |
Quadrant B |
|---|---|---|---|
| Quadrant D | 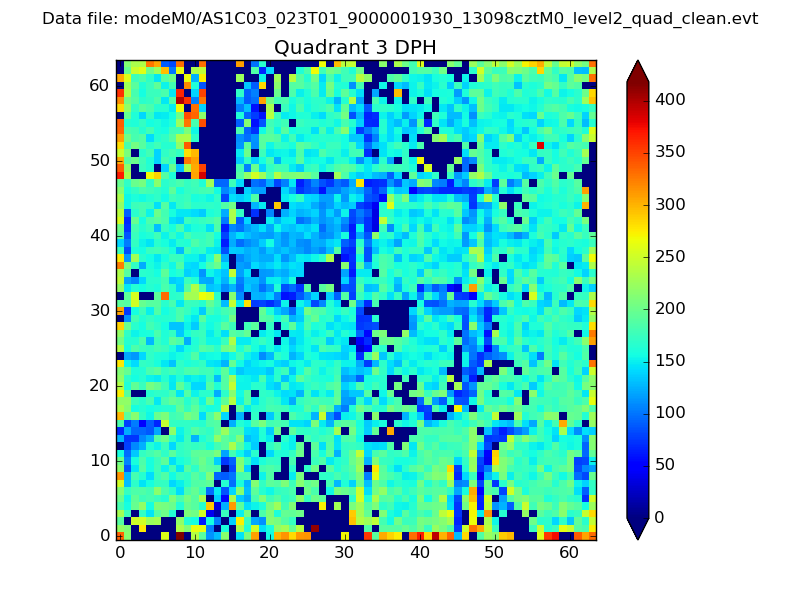 |
 |
Quadrant C |
| Plot type | Count rate plots | Images |
|---|---|---|
| Comparison with Poisson distribution Blue bars denote a histogram of data divided into 1 sec bins. Red curve is a Poisson curve with rate = median count rate of data. |
 |
 |
| Quadrant-wise count rates Data is divided into 100 sec bins |
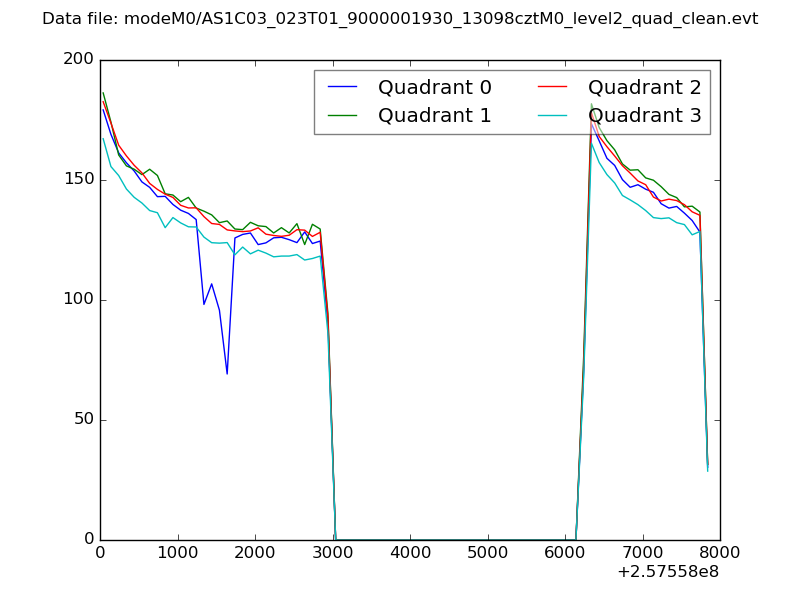 |
|
| Module-wise count rates for Quadrant A Data is divided into 100 sec bins |
 |
 |
| Module-wise count rates for Quadrant B Data is divided into 100 sec bins |
 |
 |
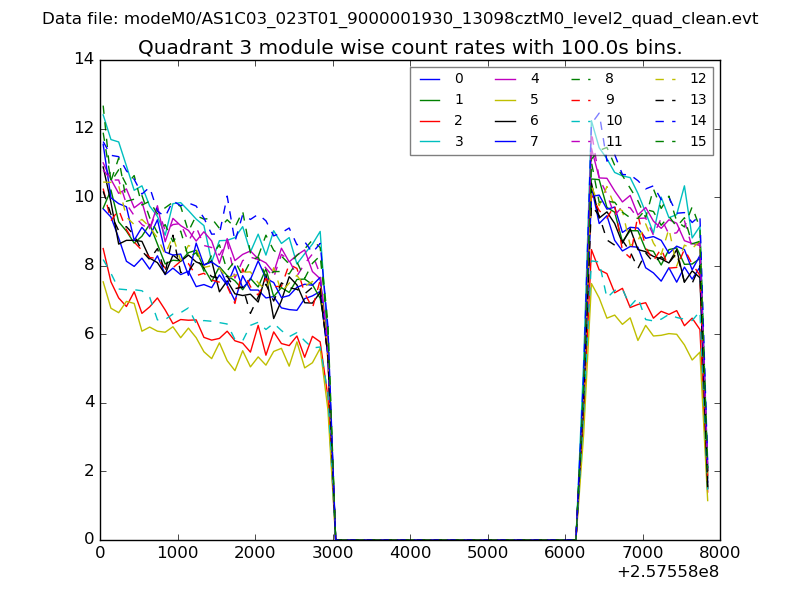
| Module-wise count rates for Quadrant C Data is divided into 100 sec bins |
 |
 |
| Module-wise count rates for Quadrant D Data is divided into 100 sec bins |
 |
 |
| Parameter | Plot |
|---|---|
| CZT HV Monitor |  |
| D_VDD | 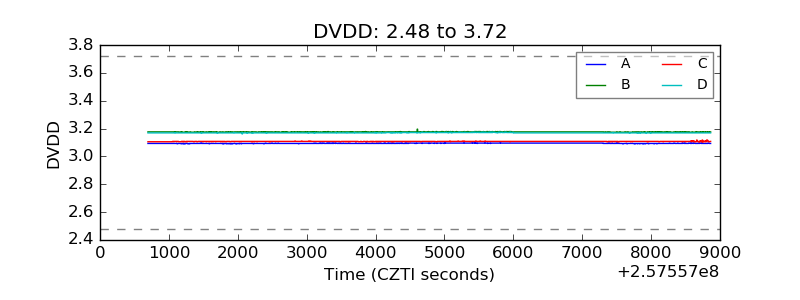 |
| Temperature 1 | 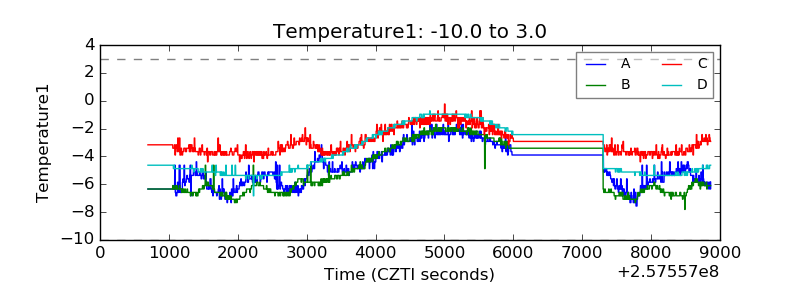 |
| Veto HV Monitor | 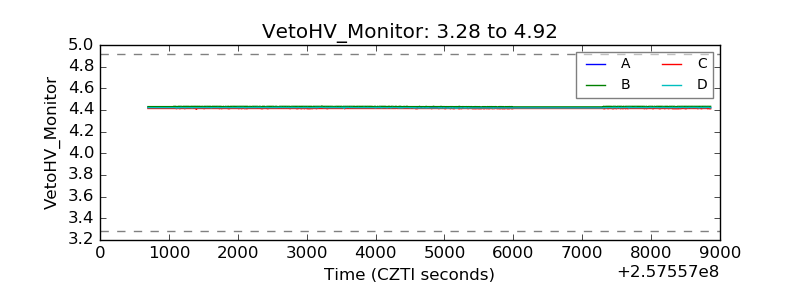 |
| Veto LLD | 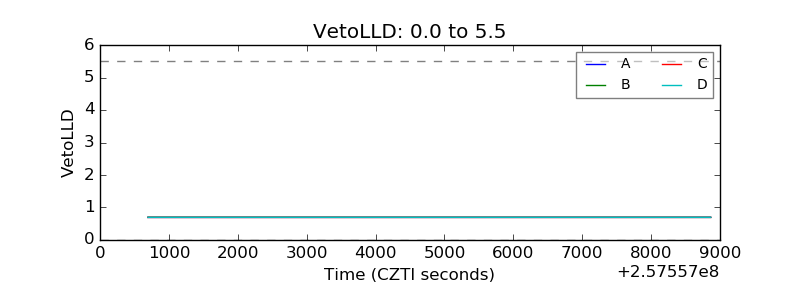 |
| Alpha Counter | 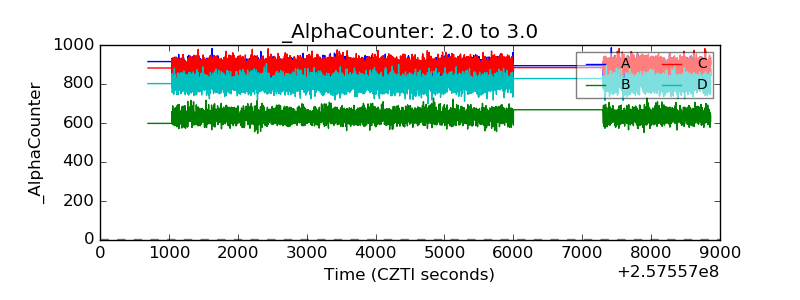 |
| _CPM_Rate | 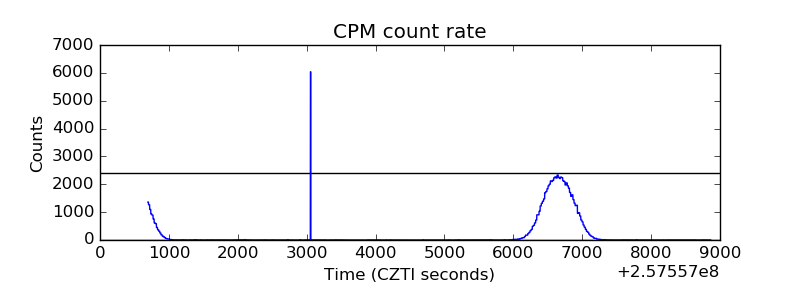 |
| CZT Counter | 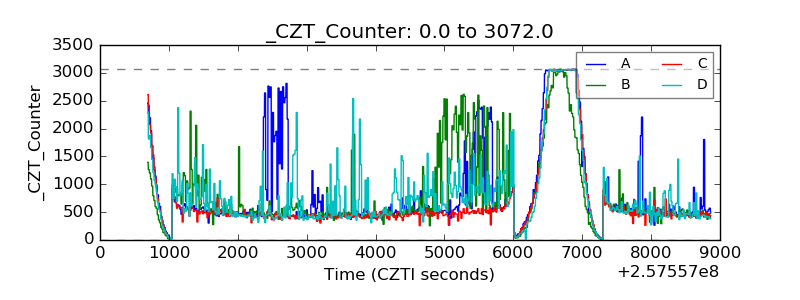 |
| +2.5 Volts monitor |  |
| +5 Volts monitor |  |
| _ROLL_ROT | 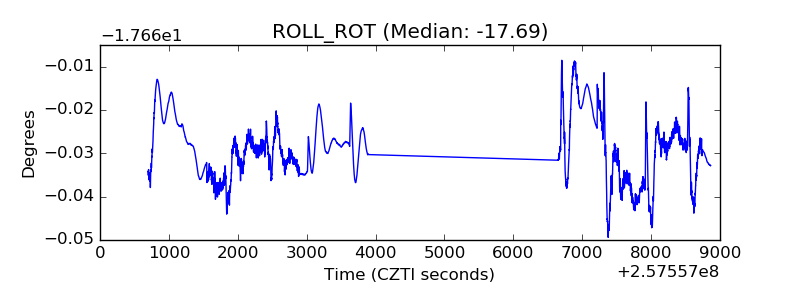 |
| _Roll_DEC | 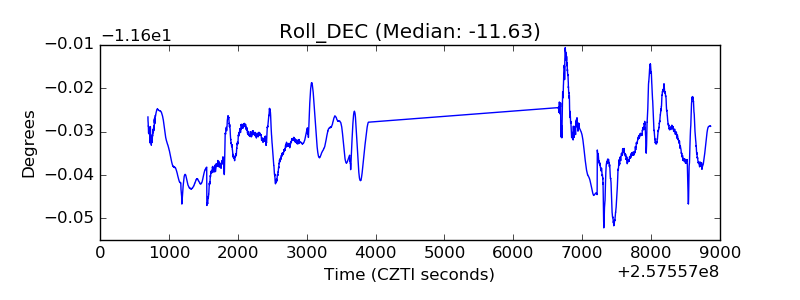 |
| _Roll_RA | 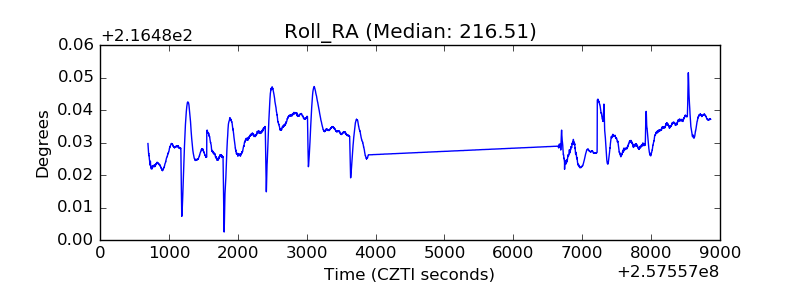 |
| Veto Counter | 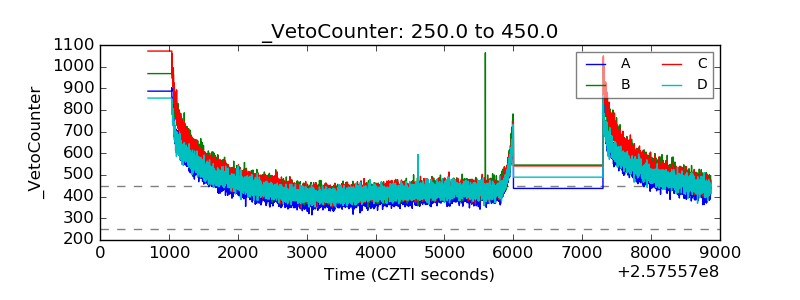 |