| Param | Original file | Final file |
|---|---|---|
| Filename | modeM0/AS1C03_023T01_9000001930_13099cztM0_level2.evt | modeM0/AS1C03_023T01_9000001930_13099cztM0_level2_quad_clean.evt |
| Size (bytes) | 529,712,640 | 95,244,480 |
| Size | 505.2 MB | 90.8 MB |
| Events in quadrant A | 4,052,498 | 601,984 |
| Events in quadrant B | 3,953,959 | 626,228 |
| Events in quadrant C | 3,218,101 | 620,229 |
| Events in quadrant D | 4,374,152 | 579,518 |
| Mode M0 | |||
|---|---|---|---|
| Quadrant | BADHDUFLAG | Total packets | Discarded packets |
| A | 0 | 16048 | 3 |
| B | 0 | 16017 | 2 |
| C | 0 | 13591 | 2 |
| D | 0 | 17472 | 2 |
| Mode M9 | |||
|---|---|---|---|
| Quadrant | BADHDUFLAG | Total packets | Discarded packets |
| A | 0 | 20 | 0 |
| B | 0 | 20 | 0 |
| C | 0 | 20 | 0 |
| D | 0 | 21 | 0 |
| Mode SS | |||
|---|---|---|---|
| Quadrant | BADHDUFLAG | Total packets | Discarded packets |
| A | 0 | 132 | 0 |
| B | 0 | 132 | 0 |
| C | 0 | 132 | 0 |
| D | 0 | 132 | 0 |
| Quadrant | Total seconds | Saturated seconds | Saturation percentage |
|---|---|---|---|
| A | 6548 | 237 | 3.619426% |
| B | 6548 | 218 | 3.329261% |
| C | 6548 | 27 | 0.412340% |
| D | 6548 | 103 | 1.572999% |
Noise dominated data is calculated using 1-second bins in cleaned event files. If a bin has >2000 counts, and if more than 50% of those come from <1% of pixels, then it is considered to be noise-dominated and hence unusable.
| Quadrant | # 1 sec bins | Bins with >0 counts | Bins with >2000 counts | High rate bins dominated by noise | Noise dominated (total time) | Noise dominated (detector-on time) | Marked lightcurve |
|---|---|---|---|---|---|---|---|
| A | 7829 | 6550 | 120 | 120 | 1.53% | 1.83% | 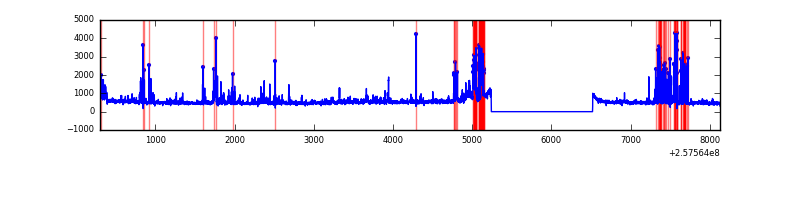 |
| B | 7829 | 6550 | 90 | 90 | 1.15% | 1.37% | 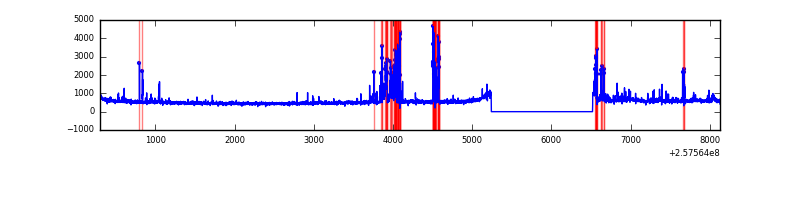 |
| C | 7829 | 6550 | 1 | 1 | 0.01% | 0.02% | 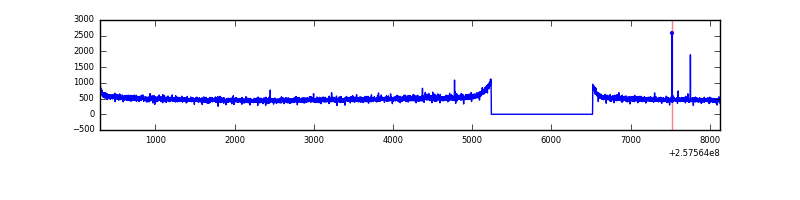 |
| D | 7829 | 6550 | 44 | 44 | 0.56% | 0.67% | 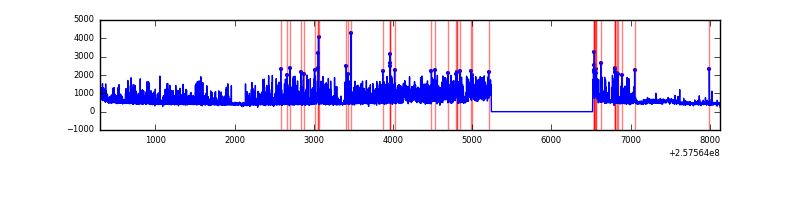 |
Top three noisy pixels from each quadrant. If the there are fewer than three noisy pixels in the level2.evt file, extra rows are filled as -1
| Pixel properties | Quadrant properties | ||||||
|---|---|---|---|---|---|---|---|
| Quadrant | DetID | PixID | Counts | Sigma | Mean | Median | Sigma |
| A | 15 | 223 | 440724 | 2650.22 | 822 | 807 | 166.0 |
| A | 15 | 239 | 225175 | 1351.67 | 822 | 807 | 166.0 |
| A | 12 | 189 | 86598 | 516.84 | 822 | 807 | 166.0 |
| B | 4 | 239 | 201052 | 1280.33 | 829 | 810 | 156.4 |
| B | 0 | 85 | 189924 | 1209.17 | 829 | 810 | 156.4 |
| B | 5 | 32 | 160857 | 1023.32 | 829 | 810 | 156.4 |
| C | 8 | 128 | 6861 | 32.14 | 818 | 825 | 187.8 |
| C | 13 | 61 | 5992 | 27.51 | 818 | 825 | 187.8 |
| C | 14 | 234 | 5846 | 26.73 | 818 | 825 | 187.8 |
| D | 10 | 157 | 1010193 | 5262.9 | 805 | 785 | 191.8 |
| D | 1 | 52 | 246598 | 1281.63 | 805 | 785 | 191.8 |
| D | 14 | 34 | 32429 | 164.98 | 805 | 785 | 191.8 |
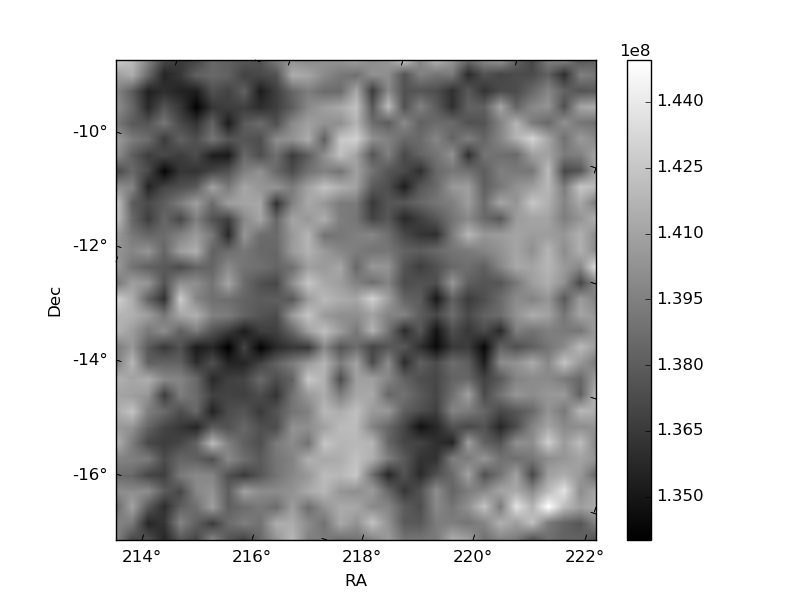
Histogram calculated using DETX and DETY for each event in the final _common_clean file
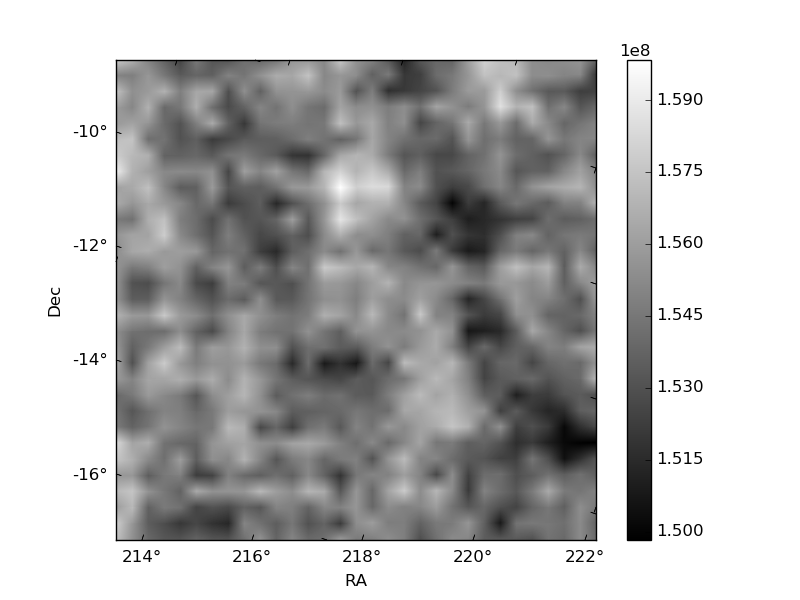
| Quadrant A | 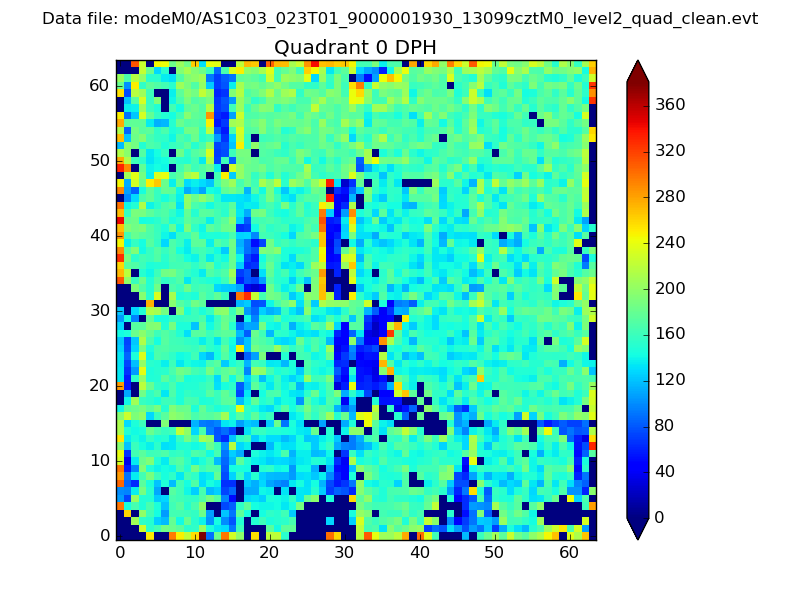 |
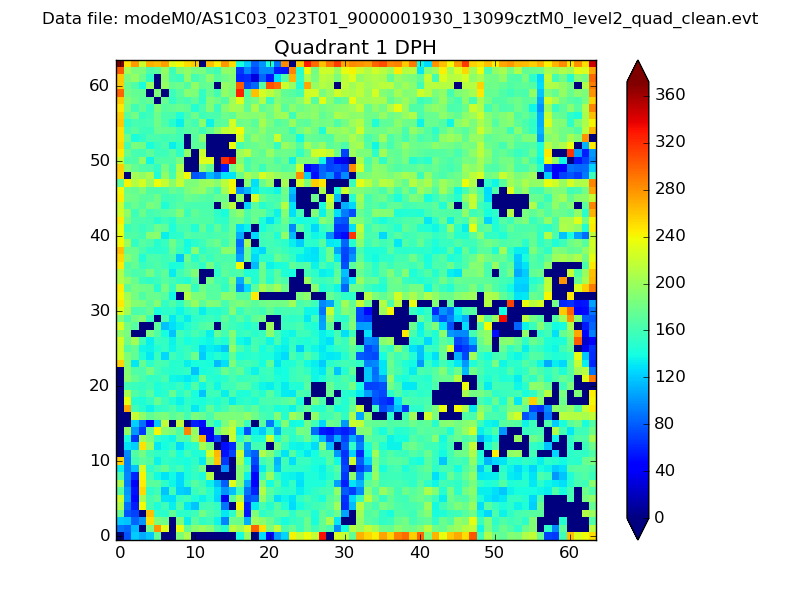 |
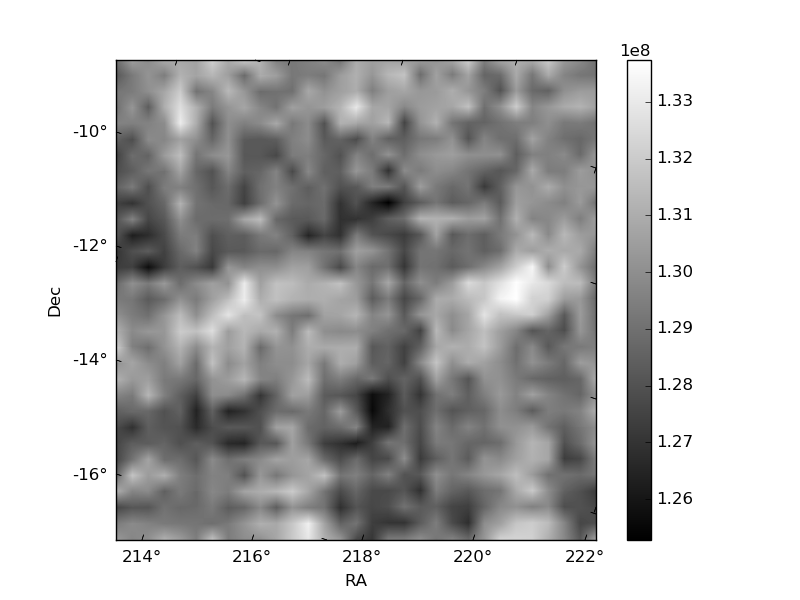
Quadrant B |
|---|---|---|---|
| Quadrant D | 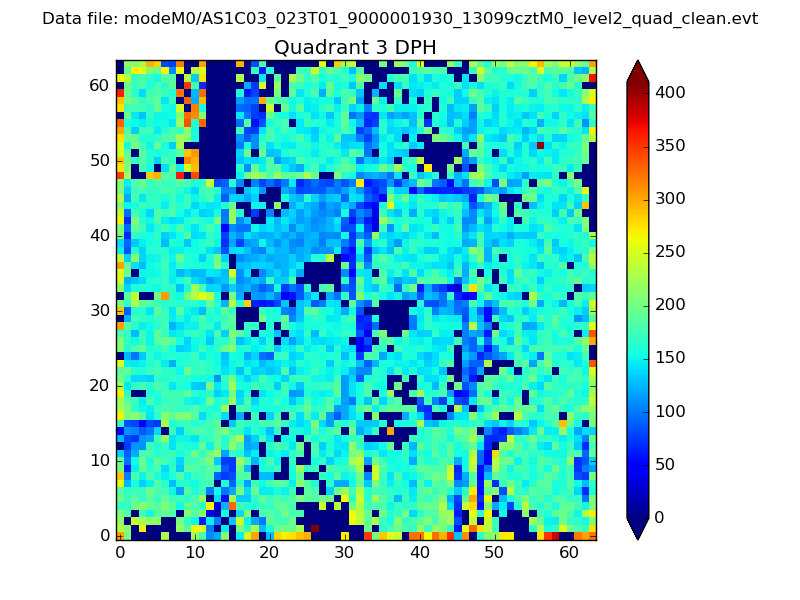 |
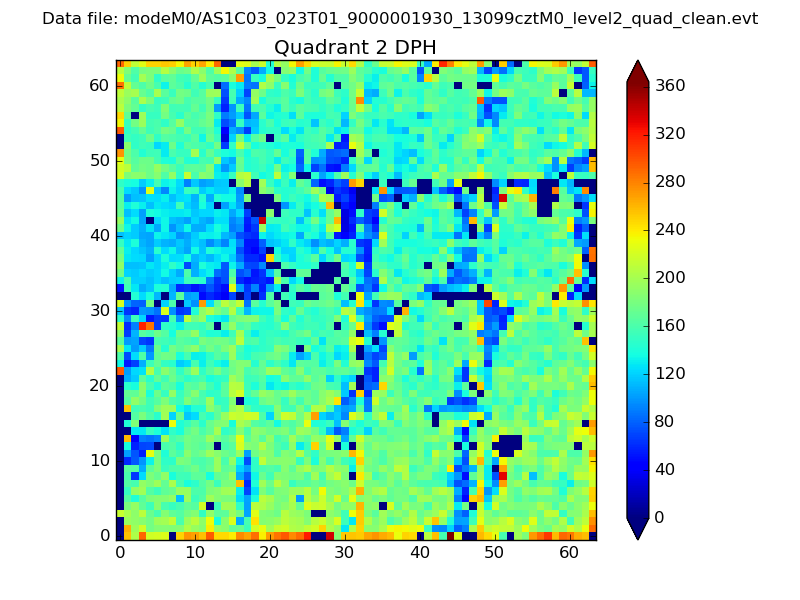 |
Quadrant C |
| Plot type | Count rate plots | Images |
|---|---|---|
| Comparison with Poisson distribution Blue bars denote a histogram of data divided into 1 sec bins. Red curve is a Poisson curve with rate = median count rate of data. |
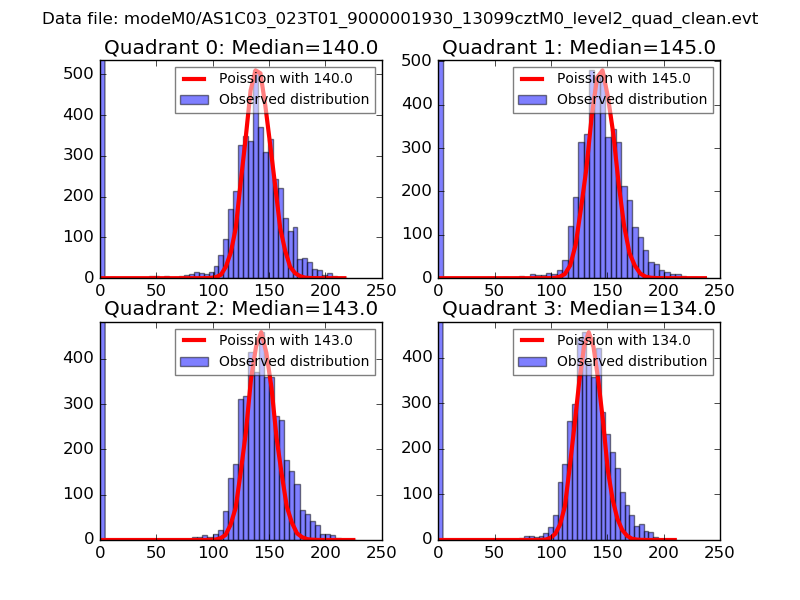 |
 |
| Quadrant-wise count rates Data is divided into 100 sec bins |
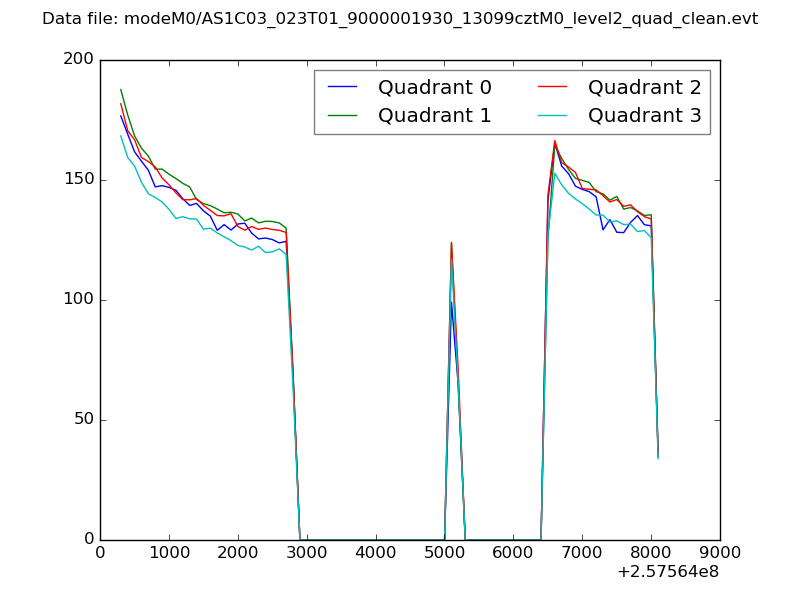 |
|
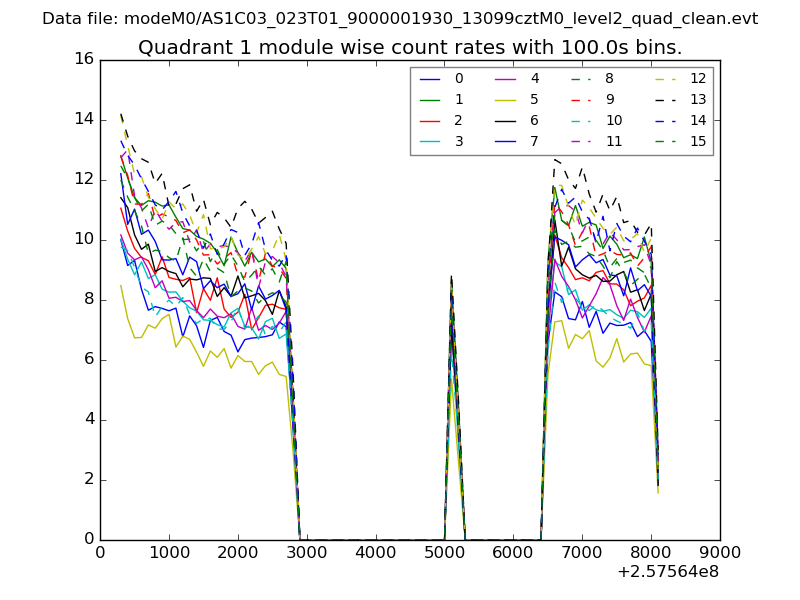
| Module-wise count rates for Quadrant A Data is divided into 100 sec bins |
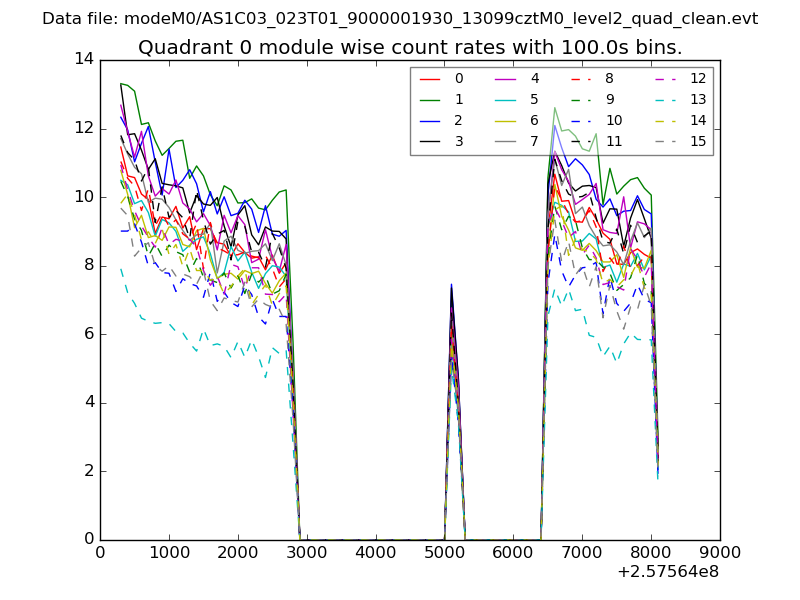 |
 |
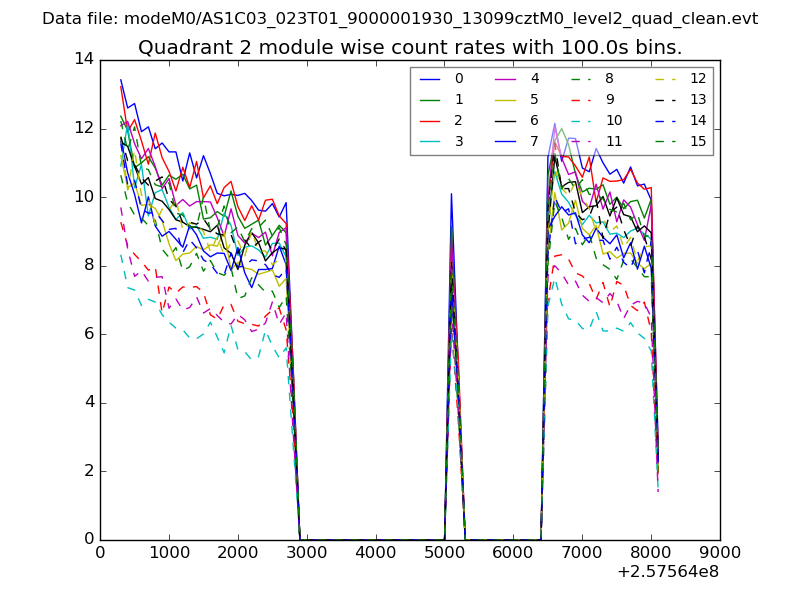
| Module-wise count rates for Quadrant B Data is divided into 100 sec bins |
 |
 |
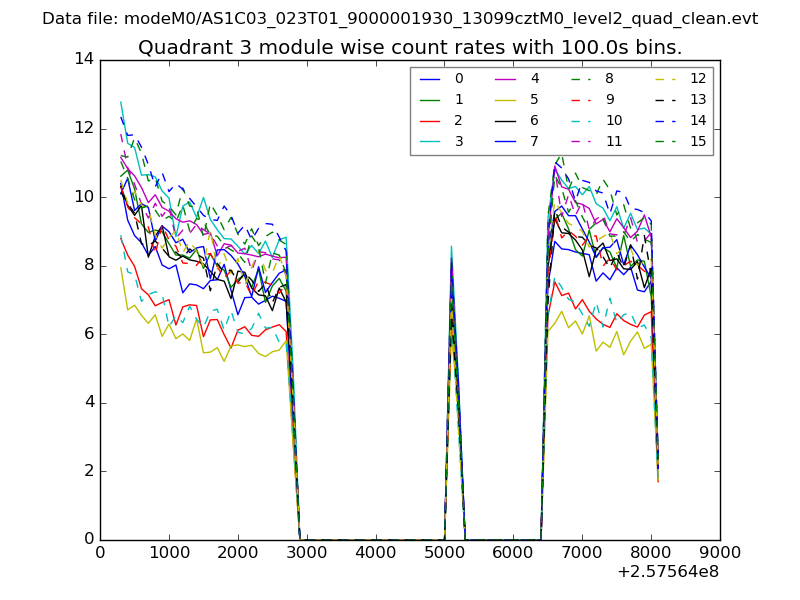
| Module-wise count rates for Quadrant C Data is divided into 100 sec bins |
 |
 |
| Module-wise count rates for Quadrant D Data is divided into 100 sec bins |
 |
 |
| Parameter | Plot |
|---|---|
| CZT HV Monitor | 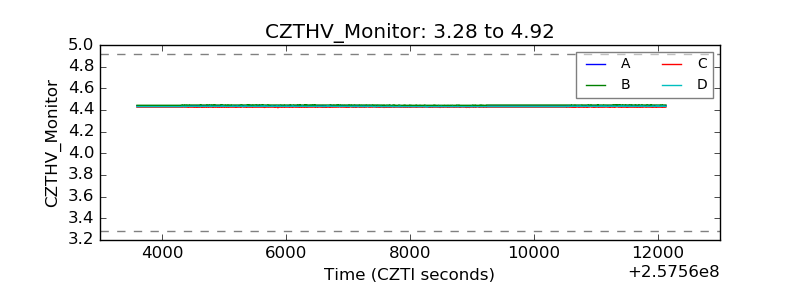 |
| D_VDD | 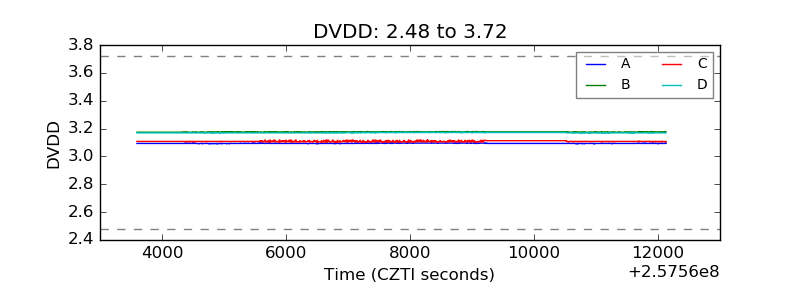 |
| Temperature 1 | 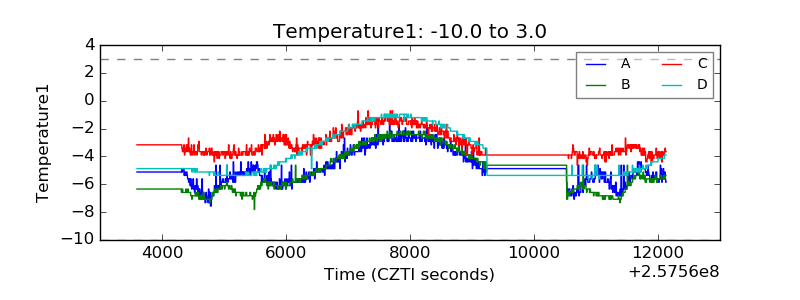 |
| Veto HV Monitor | 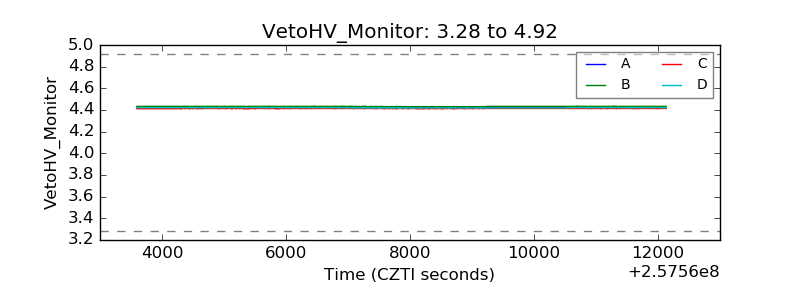 |
| Veto LLD | 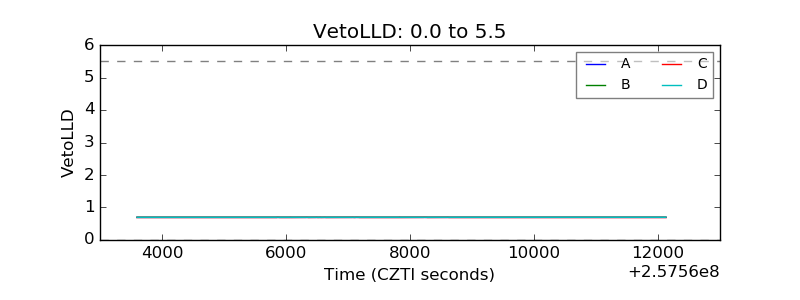 |
| Alpha Counter | 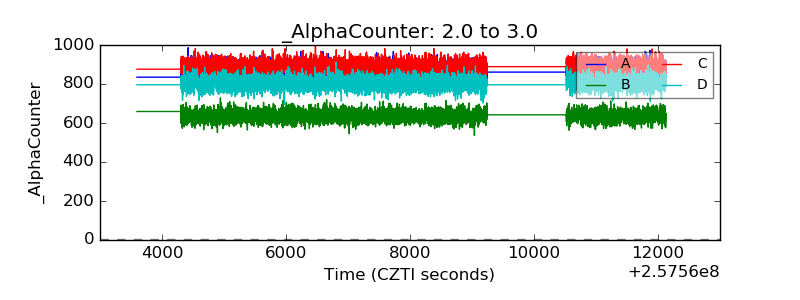 |
| _CPM_Rate | 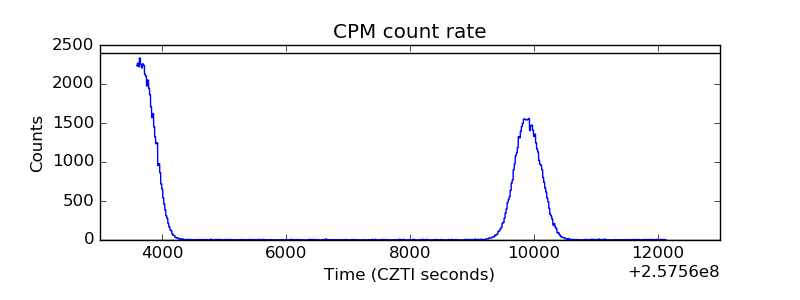 |
| CZT Counter | 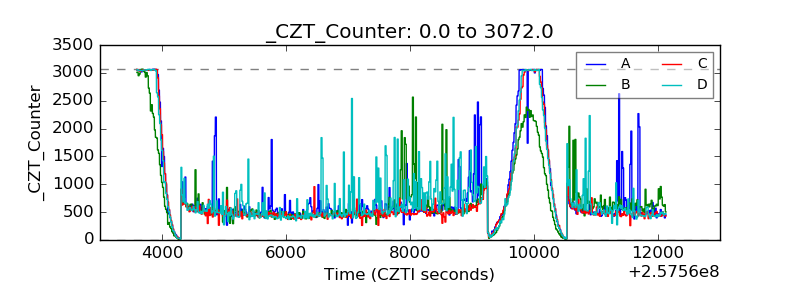 |
| +2.5 Volts monitor |  |
| +5 Volts monitor |  |
| _ROLL_ROT | 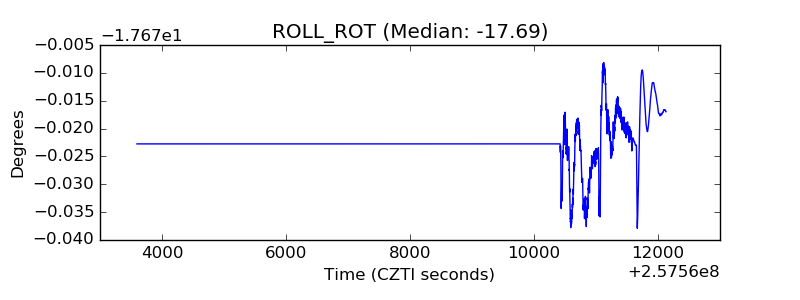 |
| _Roll_DEC | 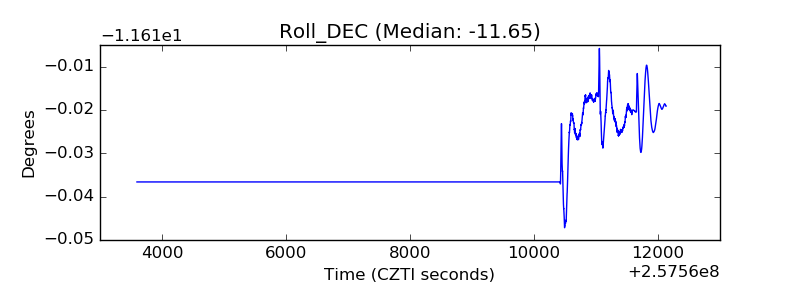 |
| _Roll_RA | 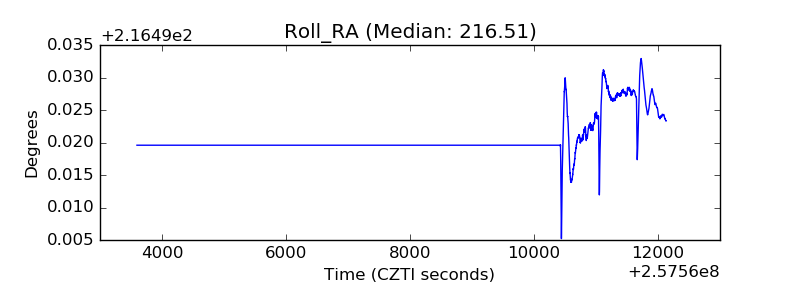 |
| Veto Counter | 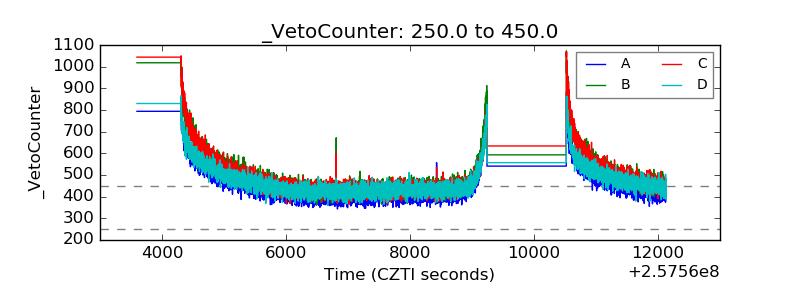 |