| Param | Original file | Final file |
|---|---|---|
| Filename | modeM0/AS1C03_023T01_9000001930_13101cztM0_level2.evt | modeM0/AS1C03_023T01_9000001930_13101cztM0_level2_quad_clean.evt |
| Size (bytes) | 460,154,880 | 90,806,400 |
| Size | 438.8 MB | 86.6 MB |
| Events in quadrant A | 3,380,450 | 571,940 |
| Events in quadrant B | 3,485,335 | 583,405 |
| Events in quadrant C | 3,136,392 | 581,996 |
| Events in quadrant D | 3,482,955 | 550,179 |
| Mode M0 | |||
|---|---|---|---|
| Quadrant | BADHDUFLAG | Total packets | Discarded packets |
| A | 0 | 14058 | 3 |
| B | 0 | 14478 | 2 |
| C | 0 | 13607 | 2 |
| D | 0 | 14691 | 2 |
| Mode M9 | |||
|---|---|---|---|
| Quadrant | BADHDUFLAG | Total packets | Discarded packets |
| A | 0 | 16 | 0 |
| B | 0 | 16 | 0 |
| C | 0 | 16 | 0 |
| D | 0 | 17 | 0 |
| Mode SS | |||
|---|---|---|---|
| Quadrant | BADHDUFLAG | Total packets | Discarded packets |
| A | 0 | 136 | 0 |
| B | 0 | 136 | 0 |
| C | 0 | 136 | 0 |
| D | 0 | 136 | 0 |
| Quadrant | Total seconds | Saturated seconds | Saturation percentage |
|---|---|---|---|
| A | 6628 | 76 | 1.146651% |
| B | 6628 | 124 | 1.870851% |
| C | 6628 | 43 | 0.648763% |
| D | 6628 | 93 | 1.403138% |
Noise dominated data is calculated using 1-second bins in cleaned event files. If a bin has >2000 counts, and if more than 50% of those come from <1% of pixels, then it is considered to be noise-dominated and hence unusable.
| Quadrant | # 1 sec bins | Bins with >0 counts | Bins with >2000 counts | High rate bins dominated by noise | Noise dominated (total time) | Noise dominated (detector-on time) | Marked lightcurve |
|---|---|---|---|---|---|---|---|
| A | 7624 | 6630 | 3 | 3 | 0.04% | 0.05% | 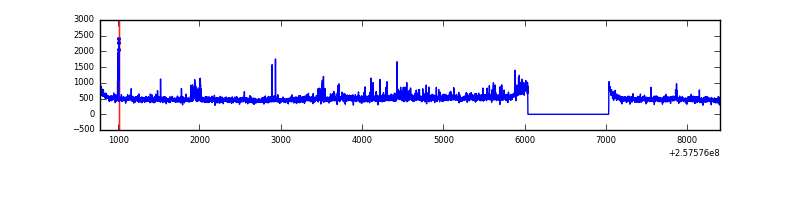 |
| B | 7624 | 6630 | 32 | 32 | 0.42% | 0.48% | 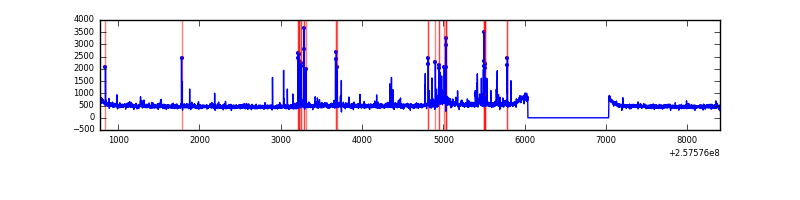 |
| C | 7624 | 6630 | 0 | 0 | 0.00% | 0.00% | 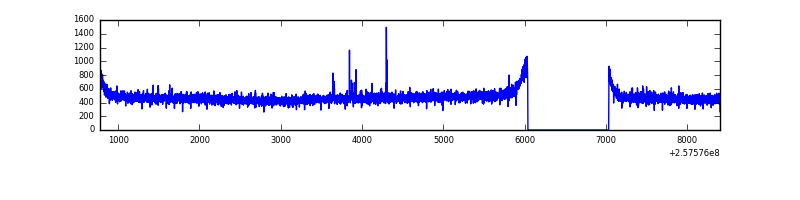 |
| D | 7624 | 6630 | 11 | 11 | 0.14% | 0.17% | 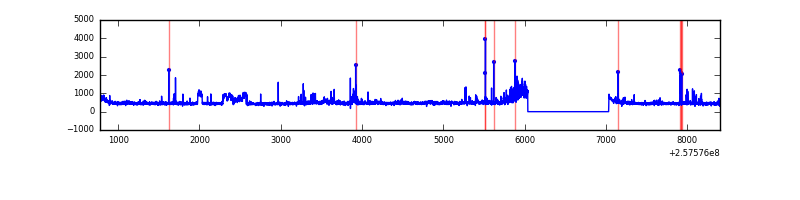 |
Top three noisy pixels from each quadrant. If the there are fewer than three noisy pixels in the level2.evt file, extra rows are filled as -1
| Pixel properties | Quadrant properties | ||||||
|---|---|---|---|---|---|---|---|
| Quadrant | DetID | PixID | Counts | Sigma | Mean | Median | Sigma |
| A | 12 | 189 | 98935 | 595.25 | 814 | 797 | 164.9 |
| A | 15 | 223 | 63379 | 379.59 | 814 | 797 | 164.9 |
| A | 1 | 162 | 23067 | 135.08 | 814 | 797 | 164.9 |
| B | 4 | 239 | 86305 | 542.51 | 812 | 792 | 157.6 |
| B | 0 | 85 | 74182 | 465.6 | 812 | 792 | 157.6 |
| B | 3 | 64 | 73920 | 463.94 | 812 | 792 | 157.6 |
| C | 14 | 234 | 15003 | 76.36 | 800 | 804 | 186.0 |
| C | 13 | 61 | 5731 | 26.5 | 800 | 804 | 186.0 |
| C | 8 | 222 | 2206 | 7.54 | 800 | 804 | 186.0 |
| D | 1 | 52 | 219448 | 1139.2 | 796 | 776 | 192.0 |
| D | 10 | 157 | 151094 | 783.1 | 796 | 776 | 192.0 |
| D | 13 | 122 | 32414 | 164.82 | 796 | 776 | 192.0 |
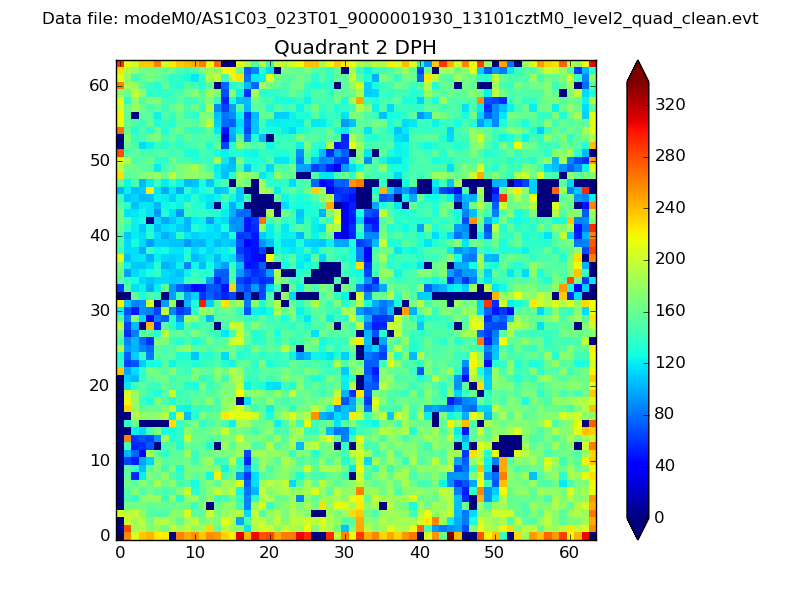
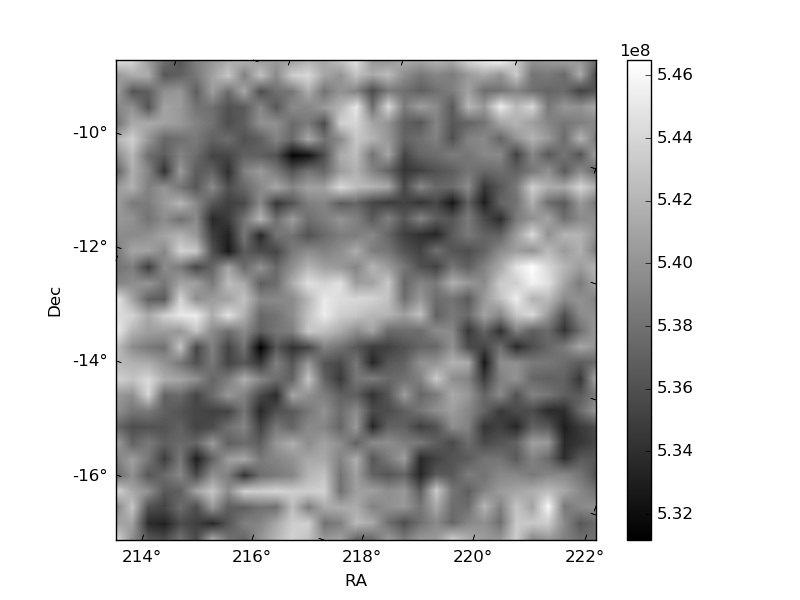
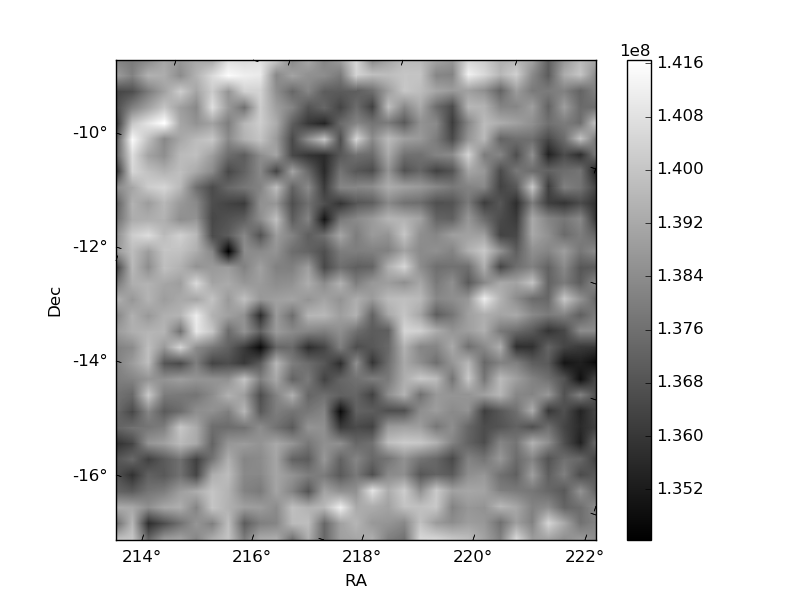
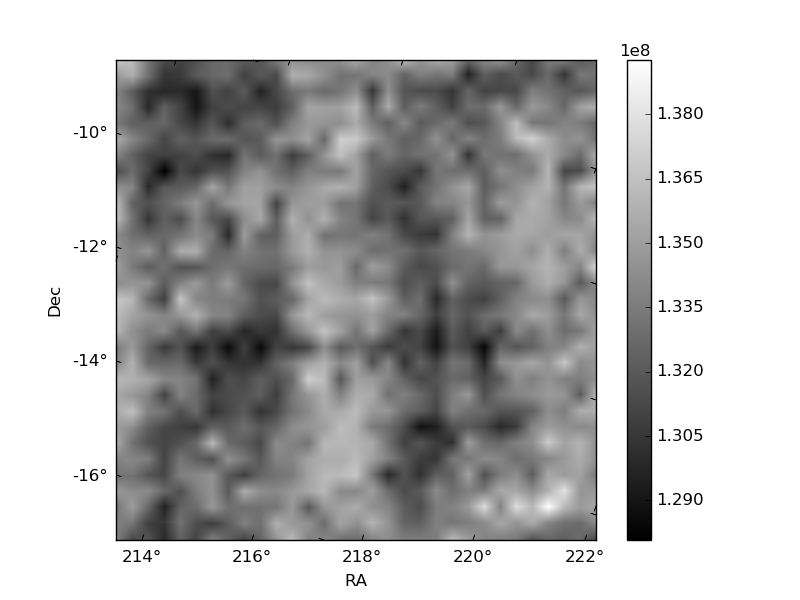
Histogram calculated using DETX and DETY for each event in the final _common_clean file
| Quadrant A | 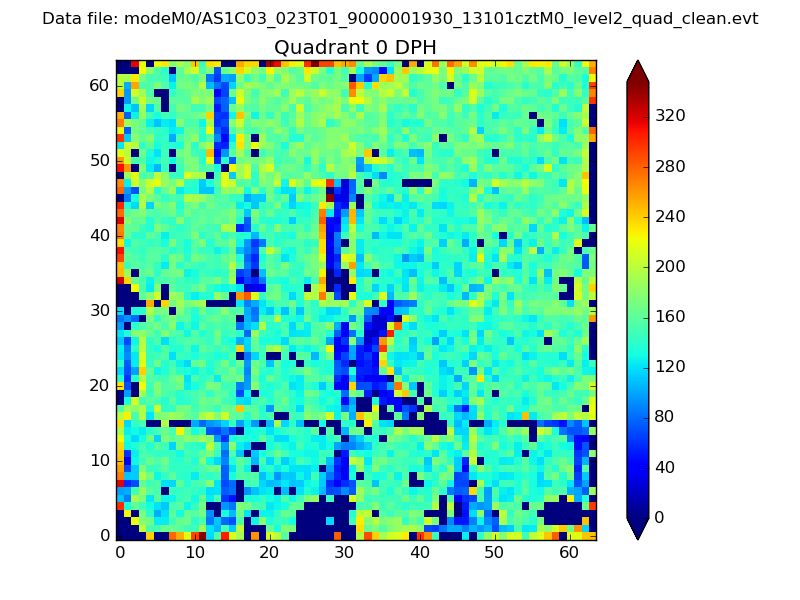 |
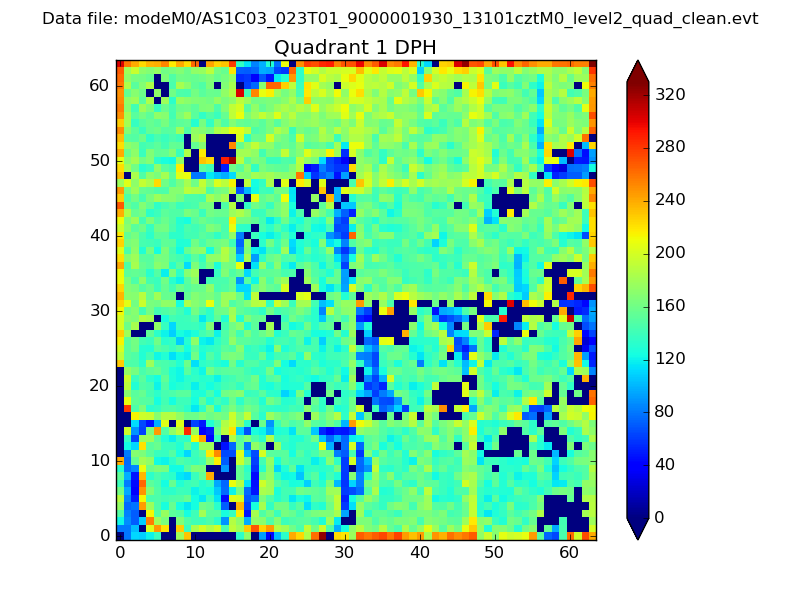 |
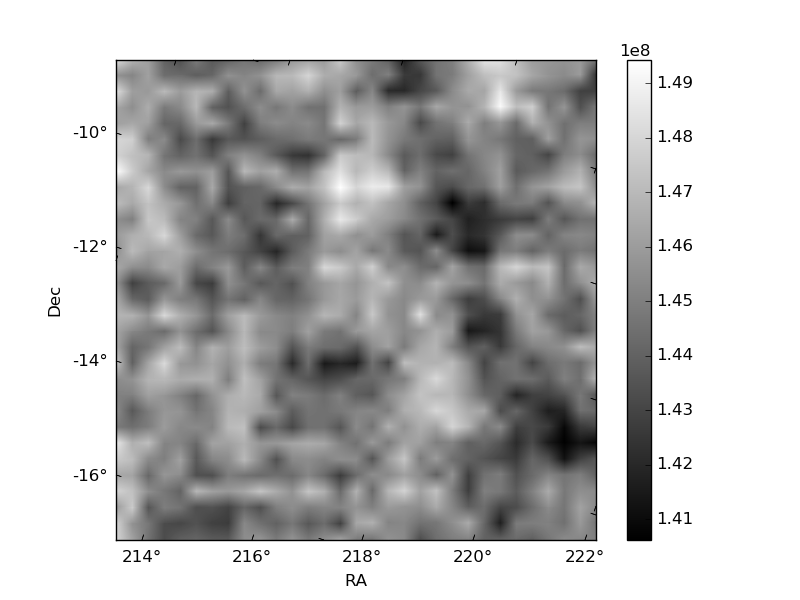
Quadrant B |
|---|---|---|---|
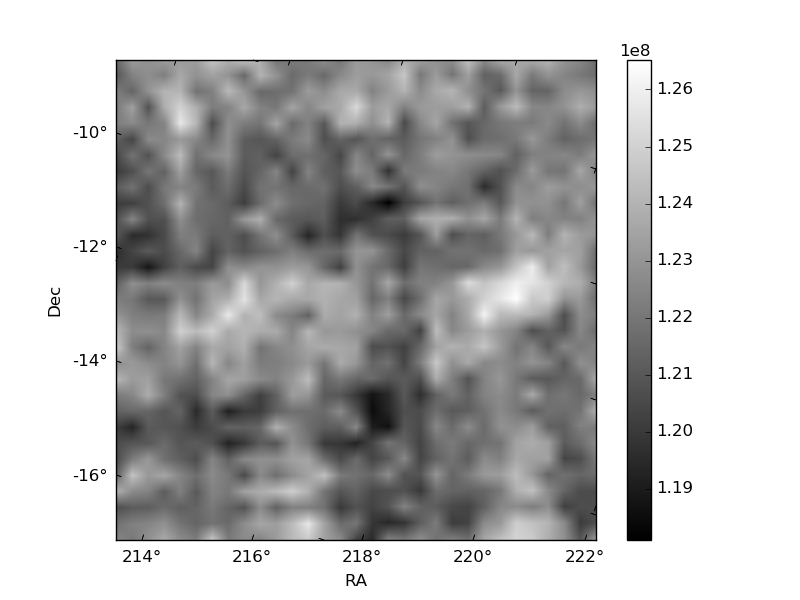
| Quadrant D | 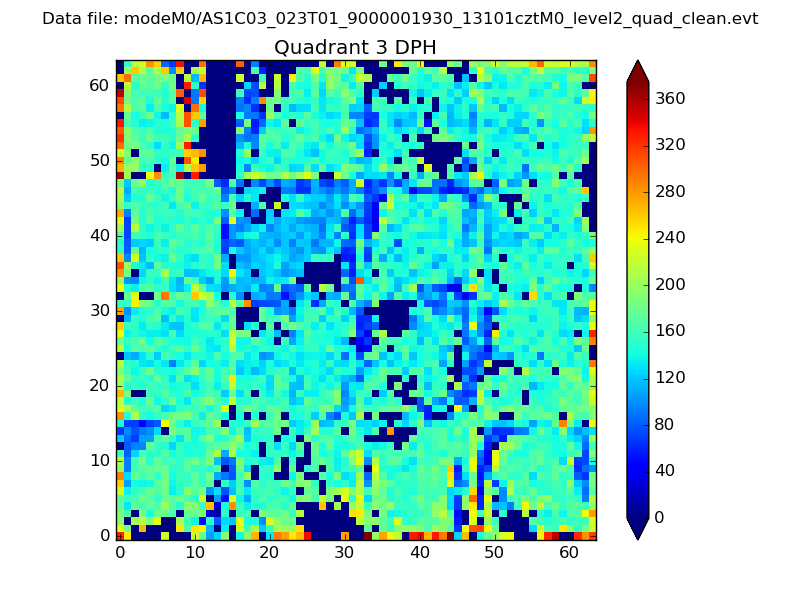 |
 |
Quadrant C |
| Plot type | Count rate plots | Images |
|---|---|---|
| Comparison with Poisson distribution Blue bars denote a histogram of data divided into 1 sec bins. Red curve is a Poisson curve with rate = median count rate of data. |
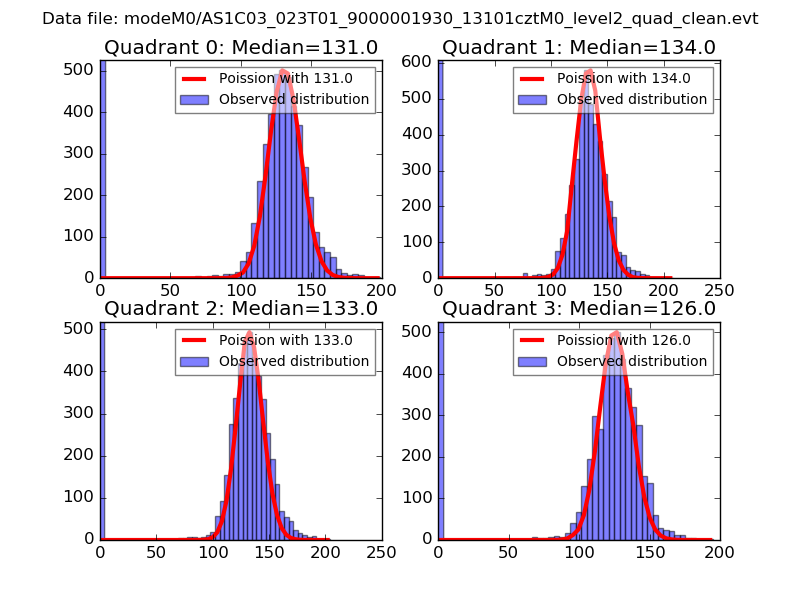 |
 |
| Quadrant-wise count rates Data is divided into 100 sec bins |
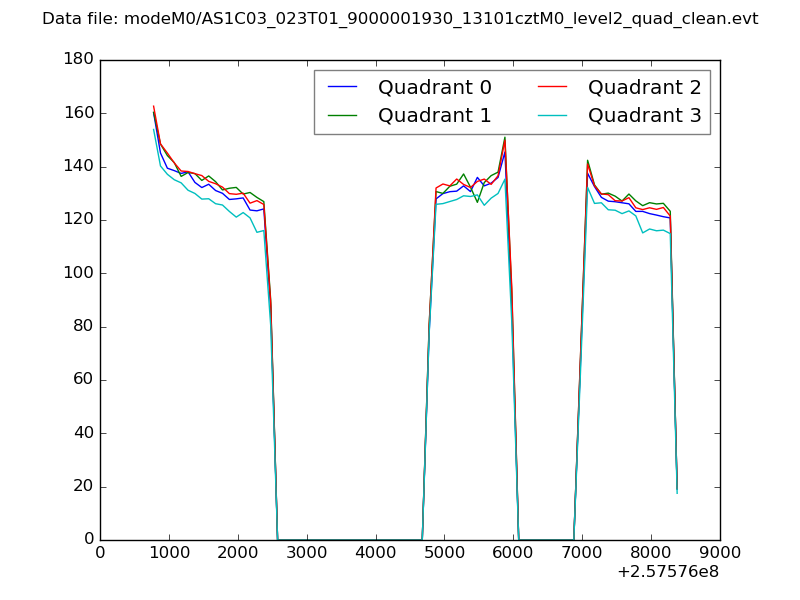 |
|
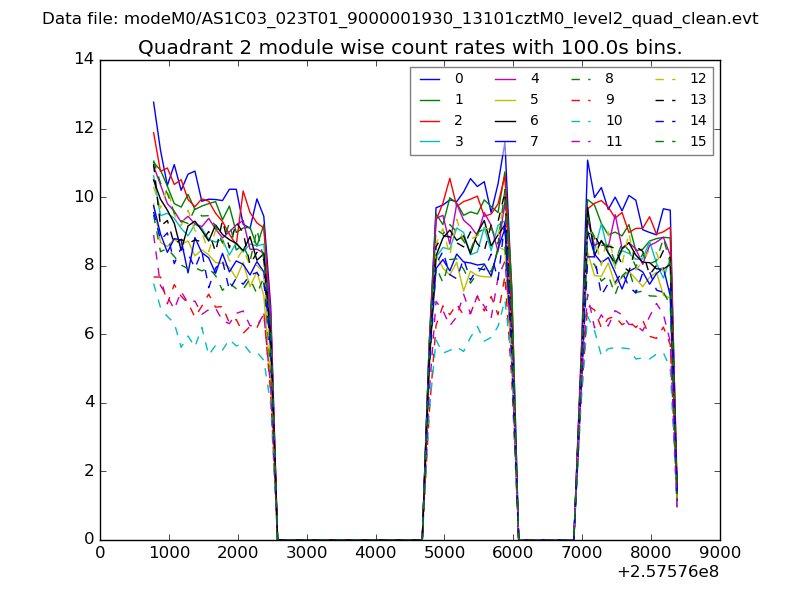
| Module-wise count rates for Quadrant A Data is divided into 100 sec bins |
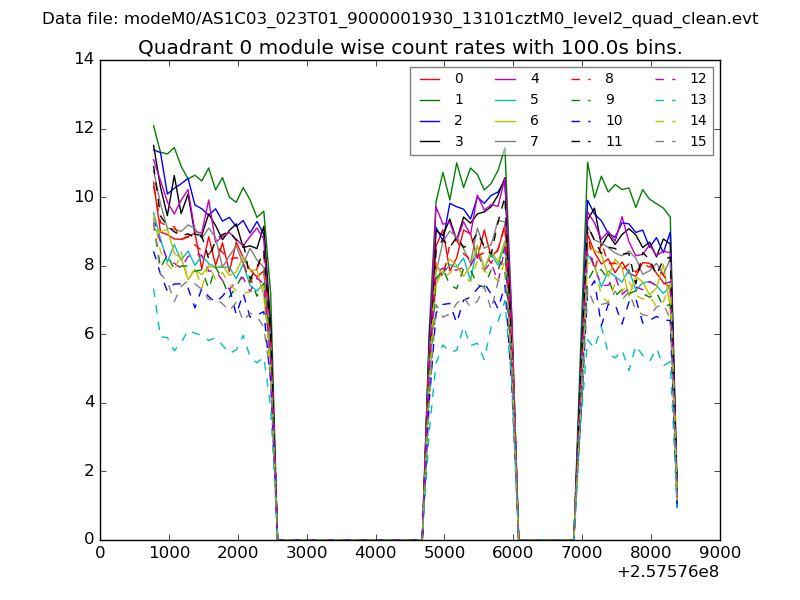 |
 |
| Module-wise count rates for Quadrant B Data is divided into 100 sec bins |
 |
 |
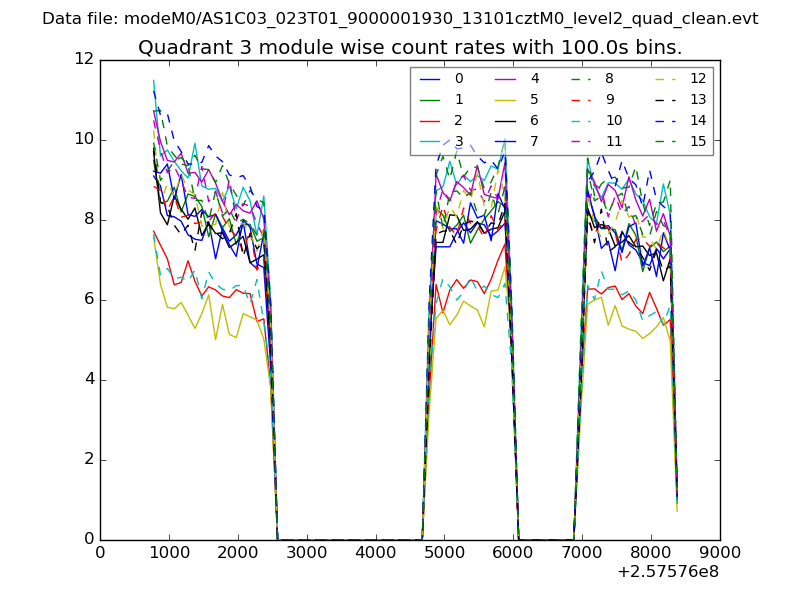
| Module-wise count rates for Quadrant C Data is divided into 100 sec bins |
 |
 |
| Module-wise count rates for Quadrant D Data is divided into 100 sec bins |
 |
 |
| Parameter | Plot |
|---|---|
| CZT HV Monitor | 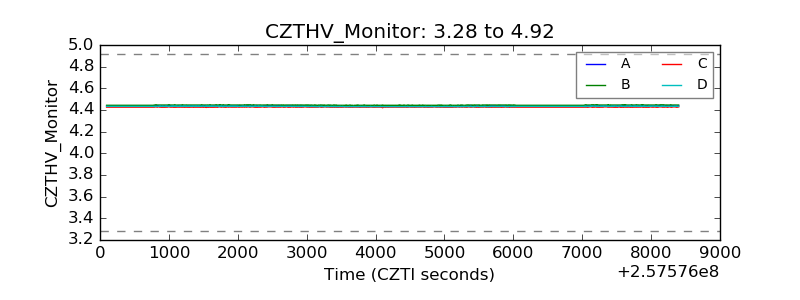 |
| D_VDD | 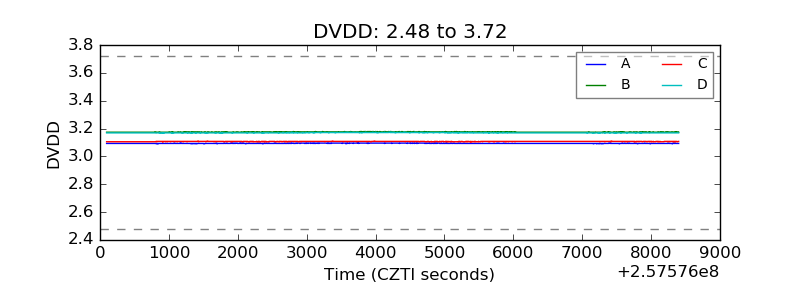 |
| Temperature 1 | 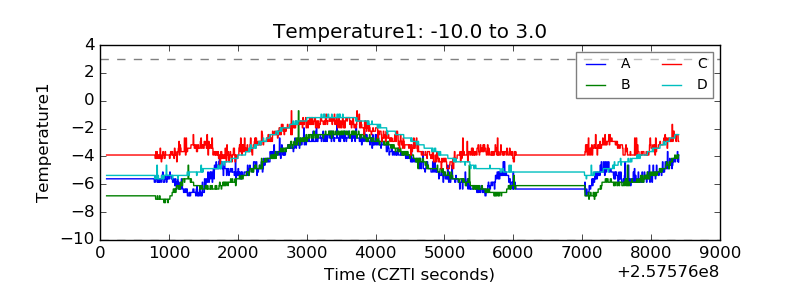 |
| Veto HV Monitor | 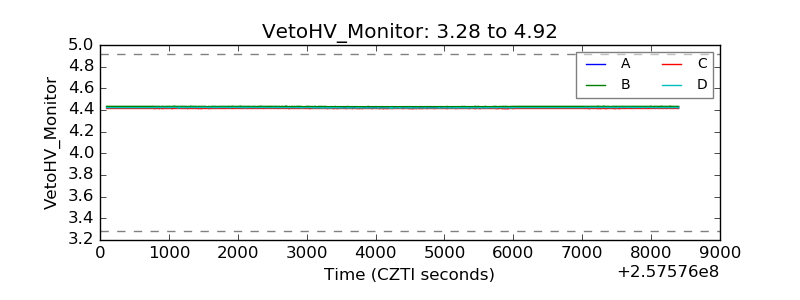 |
| Veto LLD | 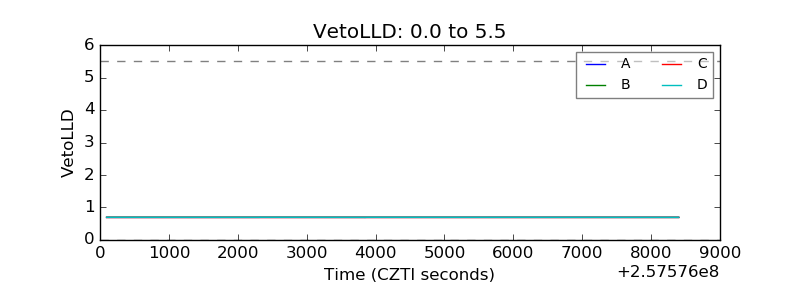 |
| Alpha Counter | 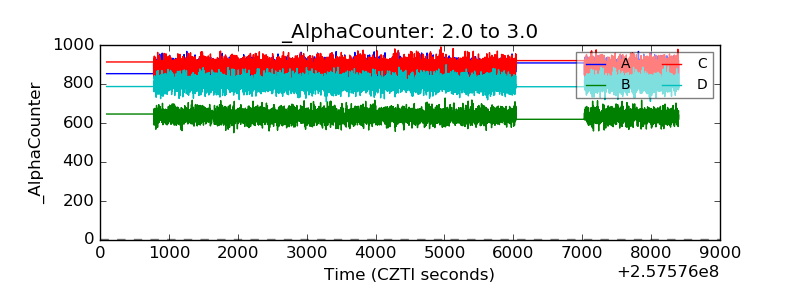 |
| _CPM_Rate | 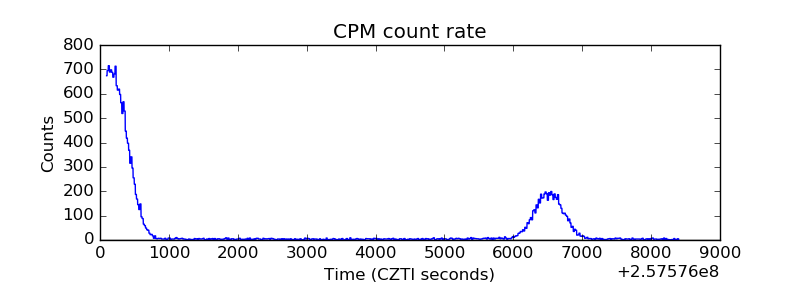 |
| CZT Counter | 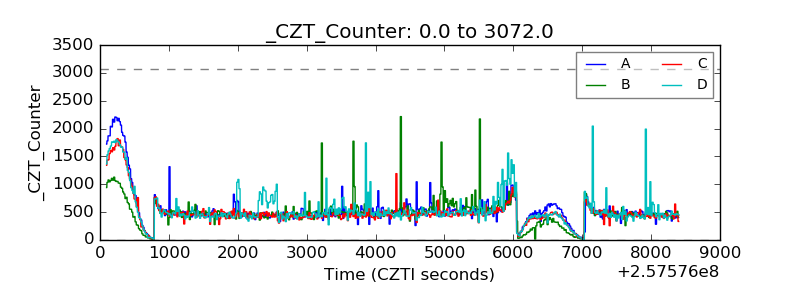 |
| +2.5 Volts monitor |  |
| +5 Volts monitor |  |
| _ROLL_ROT | 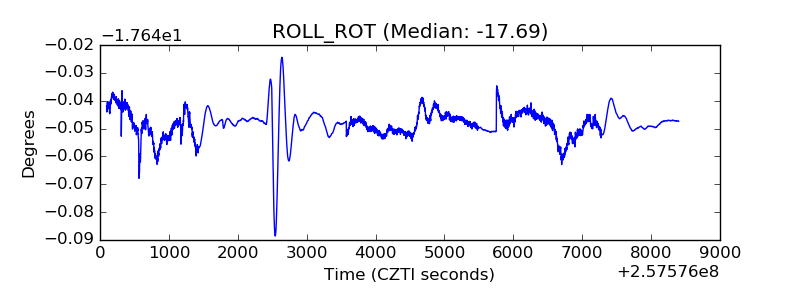 |
| _Roll_DEC | 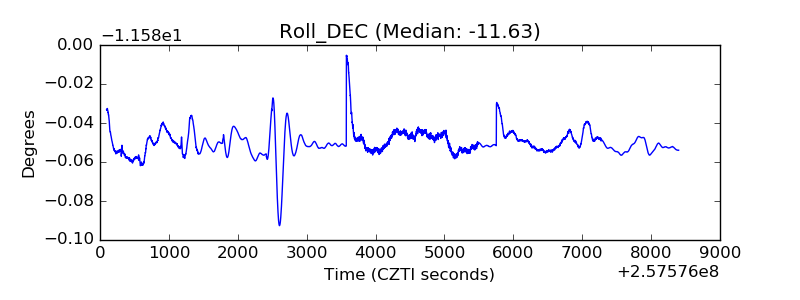 |
| _Roll_RA | 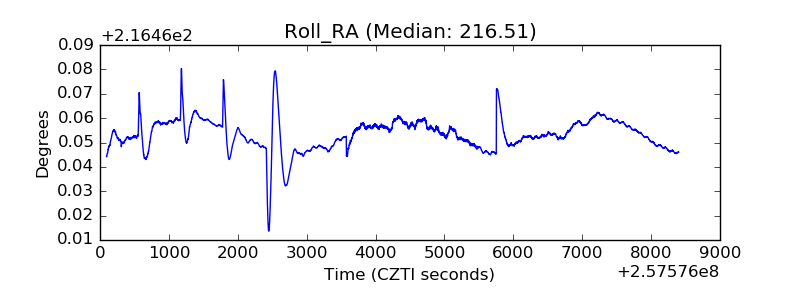 |
| Veto Counter | 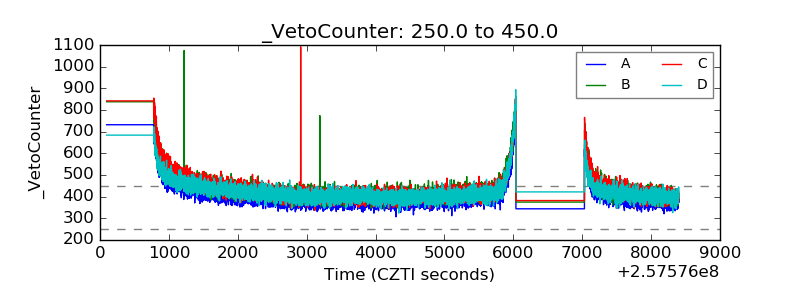 |