| Param | Original file | Final file |
|---|---|---|
| Filename | modeM0/AS1C03_023T01_9000001930_13102cztM0_level2.evt | modeM0/AS1C03_023T01_9000001930_13102cztM0_level2_quad_clean.evt |
| Size (bytes) | 704,419,200 | 83,321,280 |
| Size | 671.8 MB | 79.5 MB |
| Events in quadrant A | 3,395,272 | 538,142 |
| Events in quadrant B | 10,577,858 | 438,073 |
| Events in quadrant C | 3,200,966 | 545,068 |
| Events in quadrant D | 3,691,006 | 519,891 |
| Mode M0 | |||
|---|---|---|---|
| Quadrant | BADHDUFLAG | Total packets | Discarded packets |
| A | 0 | 14399 | 3 |
| B | 0 | 36043 | 2 |
| C | 0 | 14145 | 2 |
| D | 0 | 15580 | 2 |
| Mode M9 | |||
|---|---|---|---|
| Quadrant | BADHDUFLAG | Total packets | Discarded packets |
| A | 0 | 7 | 0 |
| B | 0 | 7 | 0 |
| C | 0 | 7 | 0 |
| D | 0 | 7 | 0 |
| Mode SS | |||
|---|---|---|---|
| Quadrant | BADHDUFLAG | Total packets | Discarded packets |
| A | 0 | 140 | 0 |
| B | 0 | 140 | 0 |
| C | 0 | 140 | 0 |
| D | 0 | 140 | 0 |
| Quadrant | Total seconds | Saturated seconds | Saturation percentage |
|---|---|---|---|
| A | 6905 | 74 | 1.071687% |
| B | 6905 | 3572 | 51.730630% |
| C | 6905 | 39 | 0.564808% |
| D | 6905 | 73 | 1.057205% |
Noise dominated data is calculated using 1-second bins in cleaned event files. If a bin has >2000 counts, and if more than 50% of those come from <1% of pixels, then it is considered to be noise-dominated and hence unusable.
| Quadrant | # 1 sec bins | Bins with >0 counts | Bins with >2000 counts | High rate bins dominated by noise | Noise dominated (total time) | Noise dominated (detector-on time) | Marked lightcurve |
|---|---|---|---|---|---|---|---|
| A | 7561 | 6907 | 2 | 2 | 0.03% | 0.03% | 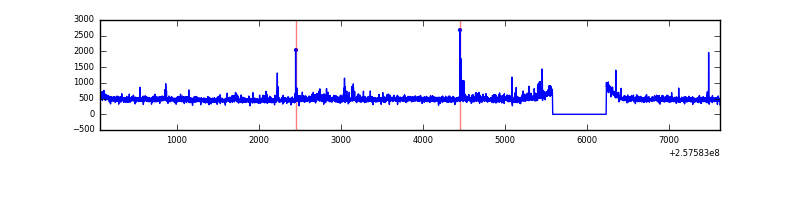 |
| B | 7561 | 6906 | 3164 | 3164 | 41.85% | 45.82% | 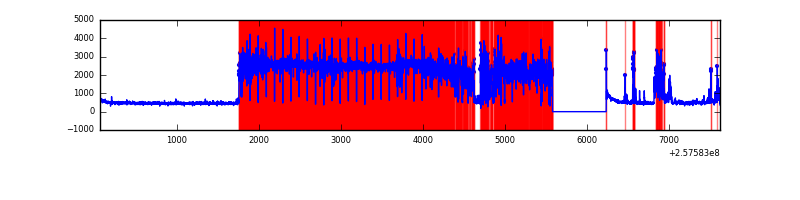 |
| C | 7561 | 6907 | 5 | 5 | 0.07% | 0.07% | 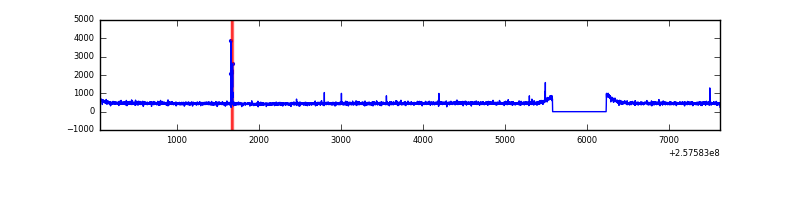 |
| D | 7561 | 6907 | 30 | 30 | 0.40% | 0.43% | 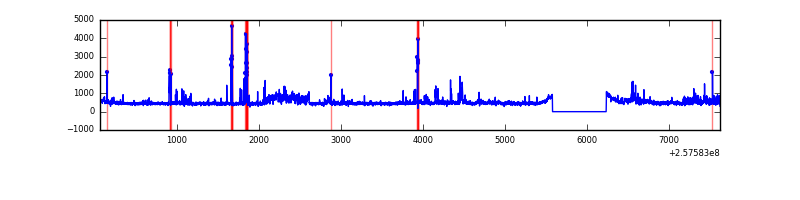 |
Top three noisy pixels from each quadrant. If the there are fewer than three noisy pixels in the level2.evt file, extra rows are filled as -1
| Pixel properties | Quadrant properties | ||||||
|---|---|---|---|---|---|---|---|
| Quadrant | DetID | PixID | Counts | Sigma | Mean | Median | Sigma |
| A | 12 | 189 | 96397 | 564.02 | 833 | 817 | 169.5 |
| A | 13 | 248 | 26788 | 153.26 | 833 | 817 | 169.5 |
| A | 8 | 15 | 22099 | 125.59 | 833 | 817 | 169.5 |
| B | 0 | 85 | 8155886 | 71186.18 | 585 | 571 | 114.6 |
| B | 3 | 64 | 79591 | 689.75 | 585 | 571 | 114.6 |
| B | 4 | 239 | 25343 | 216.23 | 585 | 571 | 114.6 |
| C | 14 | 234 | 32856 | 169.97 | 812 | 818 | 188.5 |
| C | 13 | 61 | 5890 | 26.91 | 812 | 818 | 188.5 |
| C | 8 | 222 | 2412 | 8.46 | 812 | 818 | 188.5 |
| D | 1 | 52 | 285712 | 1460.63 | 808 | 786 | 195.1 |
| D | 10 | 157 | 165759 | 845.71 | 808 | 786 | 195.1 |
| D | 10 | 253 | 71802 | 364.05 | 808 | 786 | 195.1 |
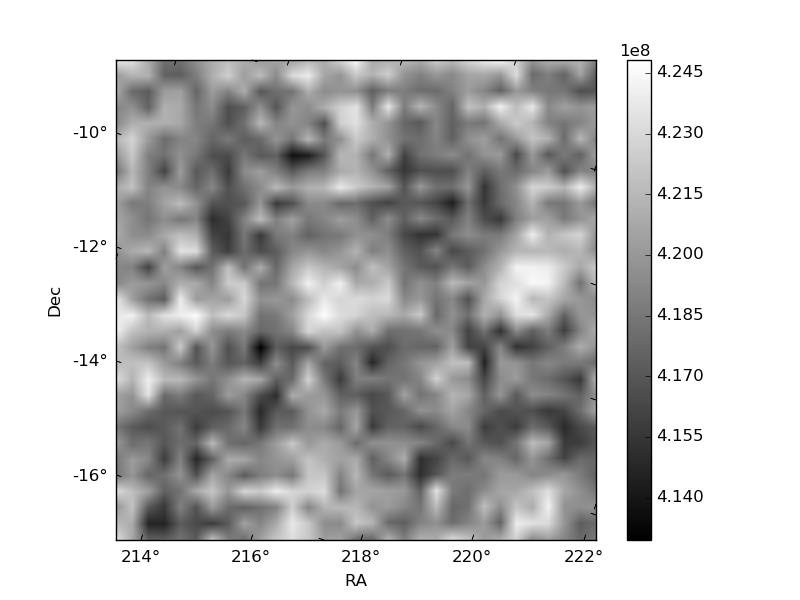
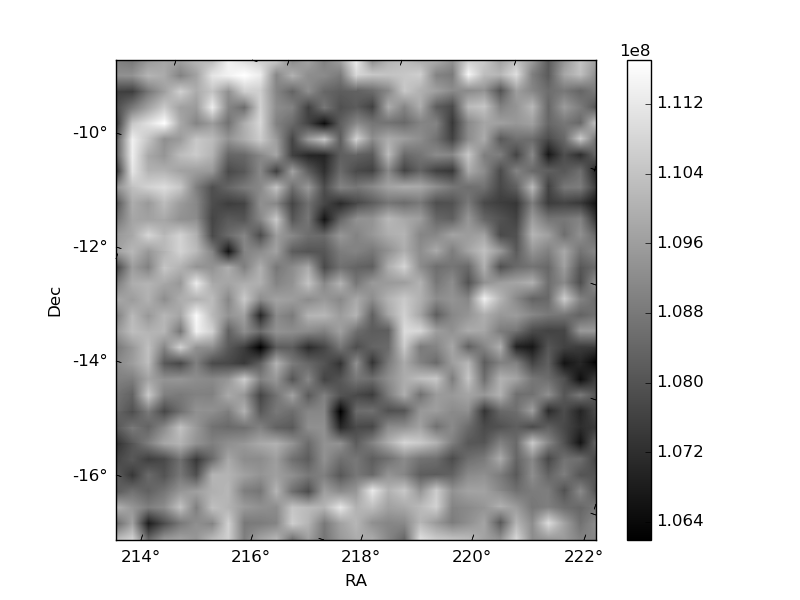
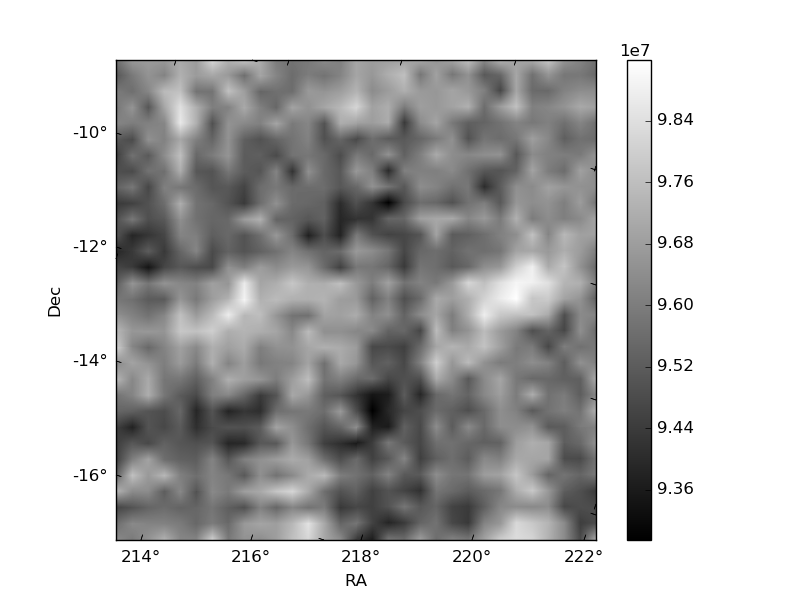
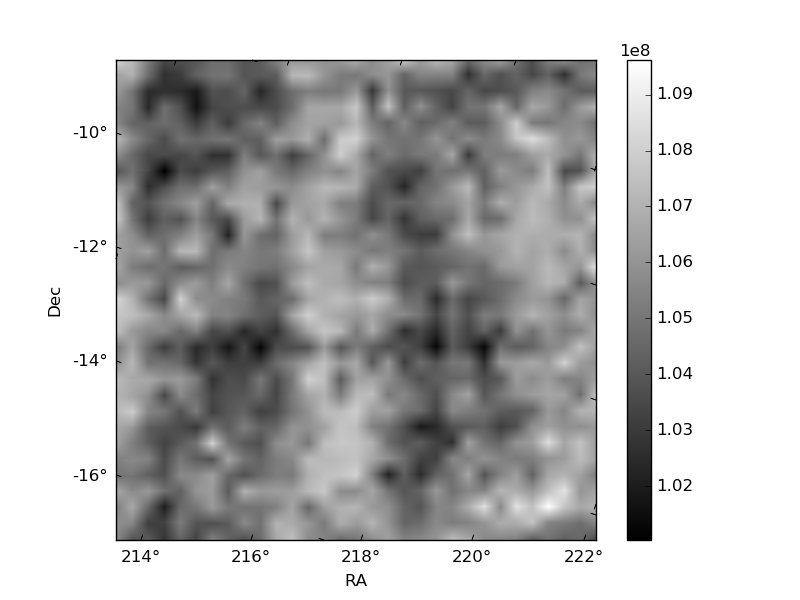
Histogram calculated using DETX and DETY for each event in the final _common_clean file
| Quadrant A | 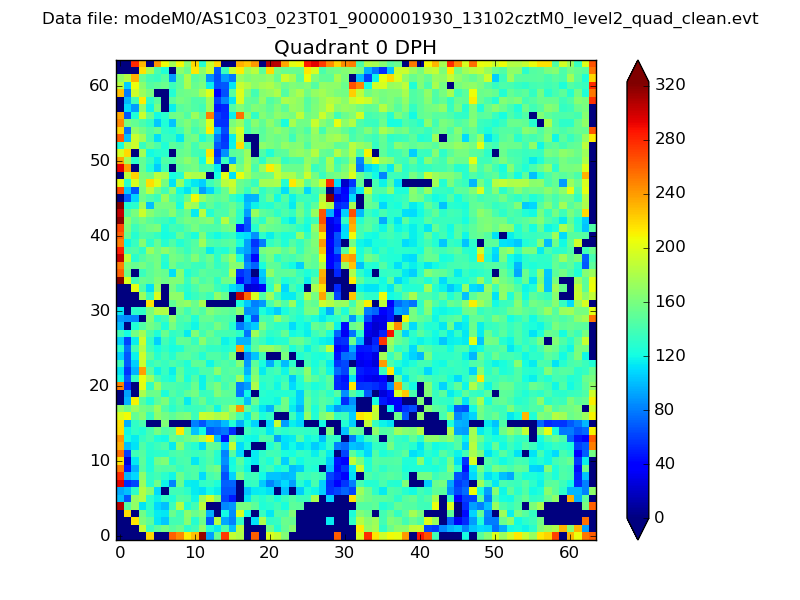 |
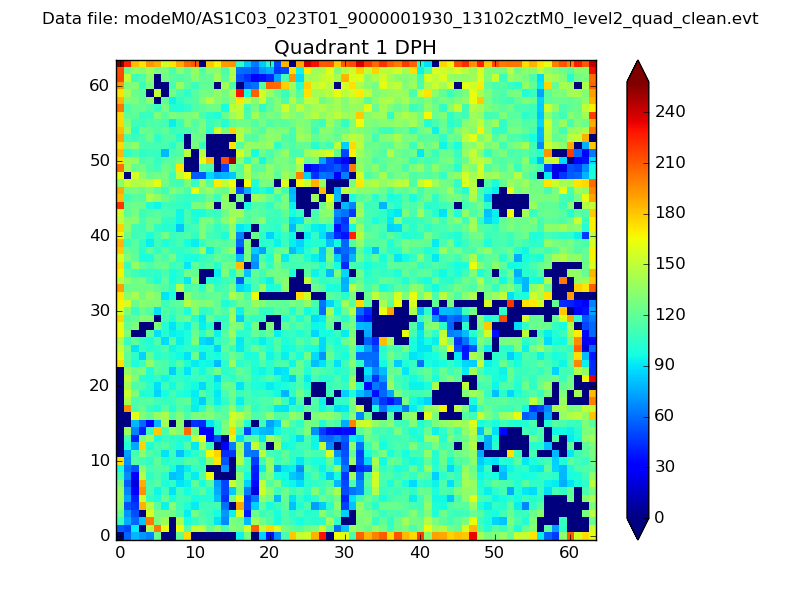 |
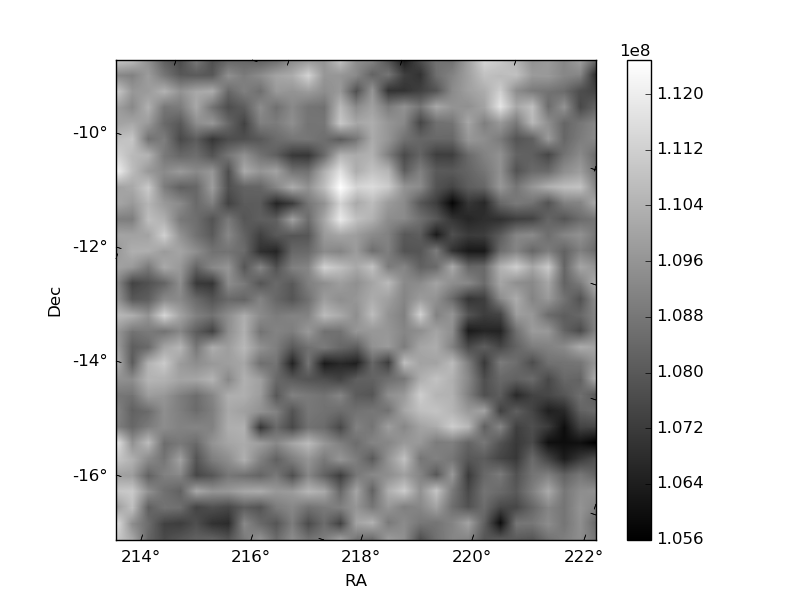
Quadrant B |
|---|---|---|---|
| Quadrant D | 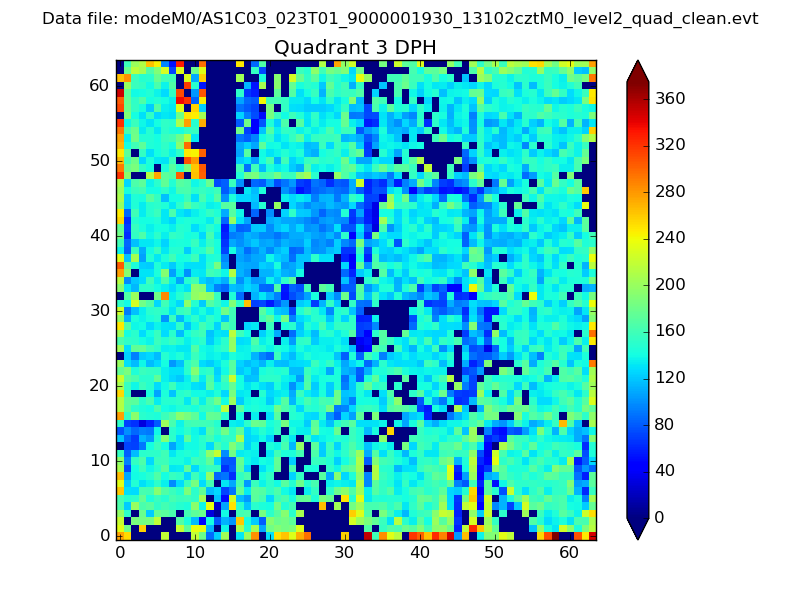 |
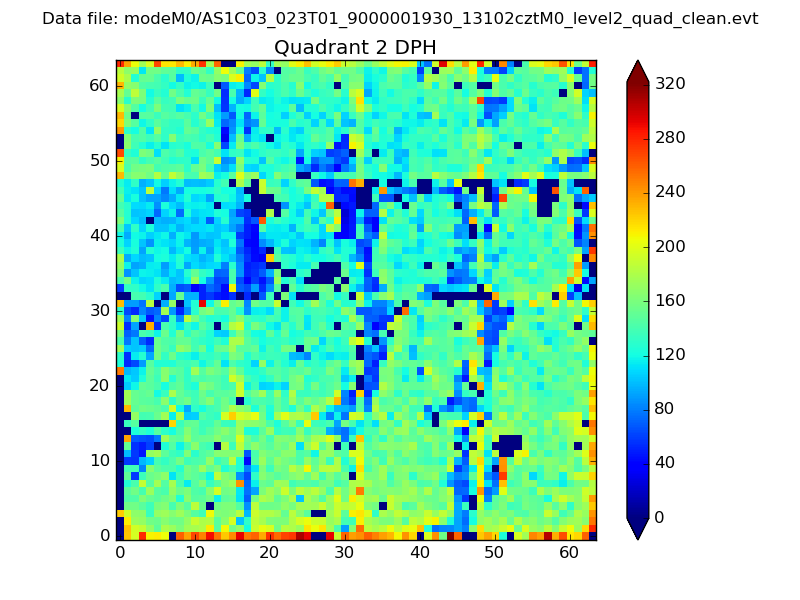 |
Quadrant C |
| Plot type | Count rate plots | Images |
|---|---|---|
| Comparison with Poisson distribution Blue bars denote a histogram of data divided into 1 sec bins. Red curve is a Poisson curve with rate = median count rate of data. |
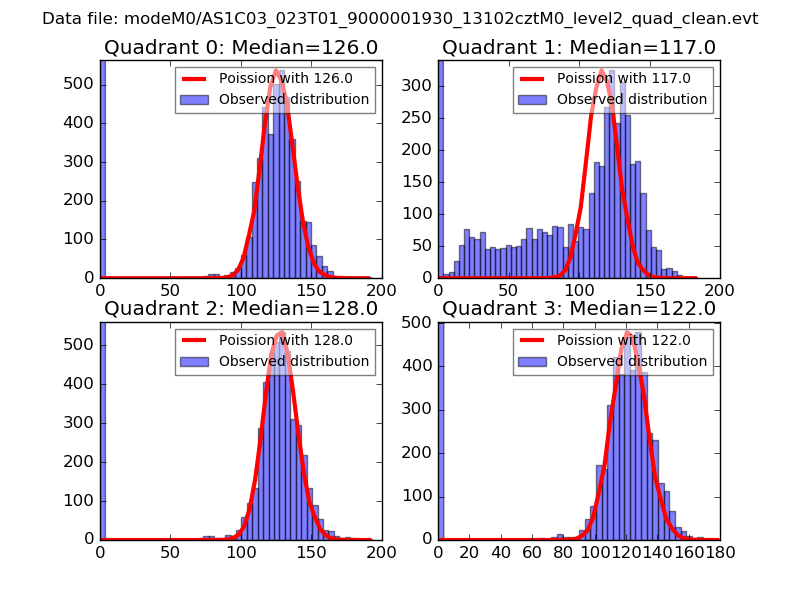 |
 |
| Quadrant-wise count rates Data is divided into 100 sec bins |
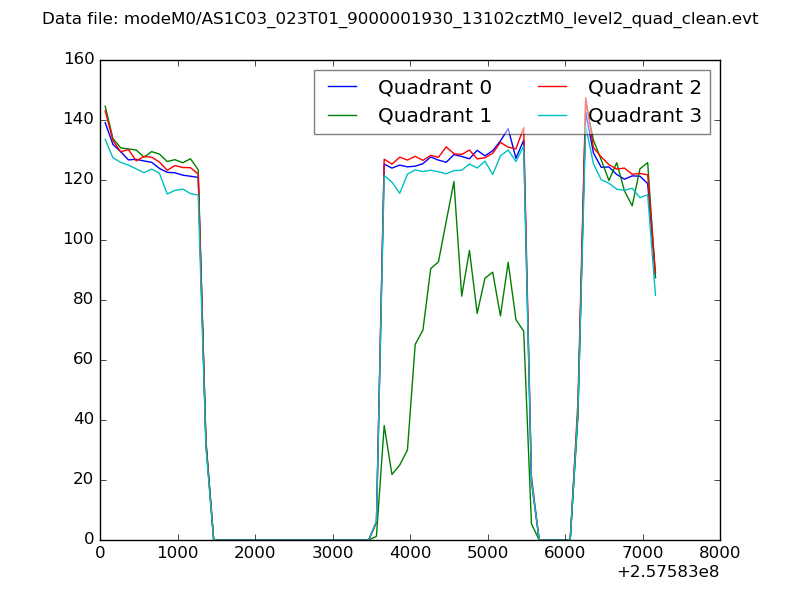 |
|
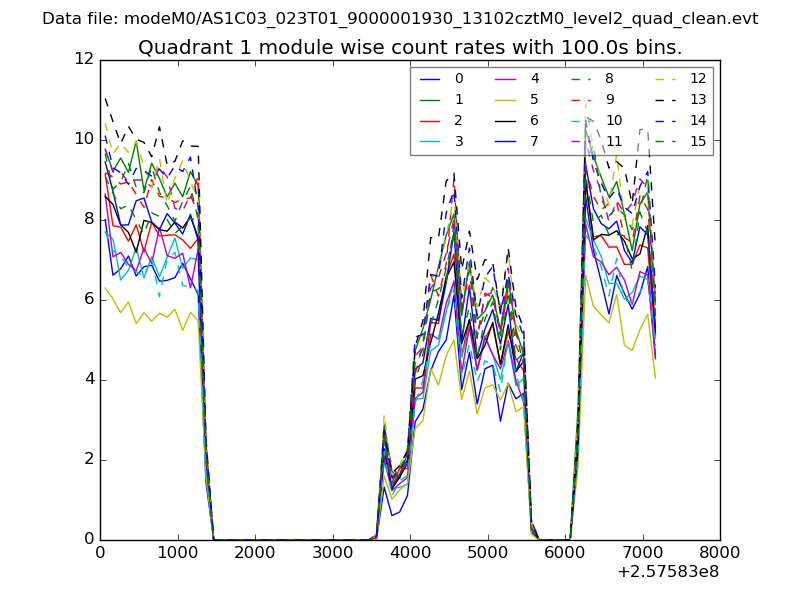
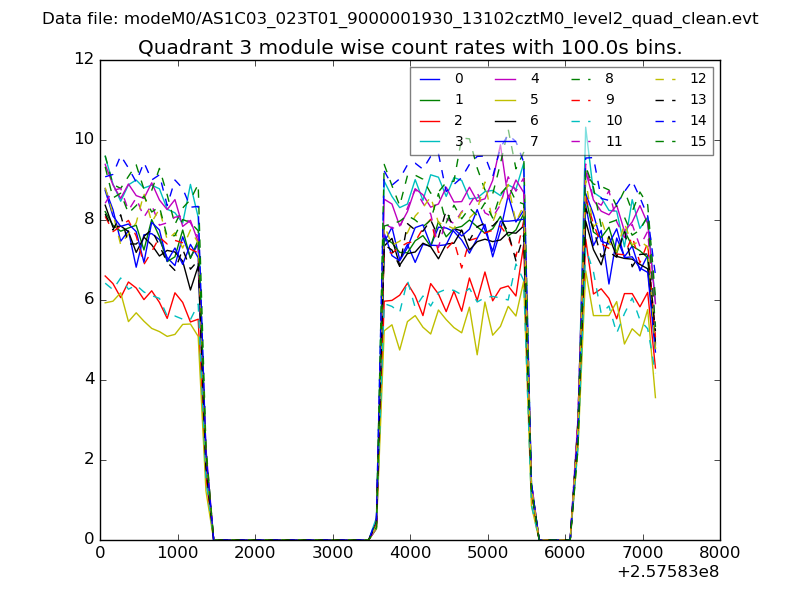
| Module-wise count rates for Quadrant A Data is divided into 100 sec bins |
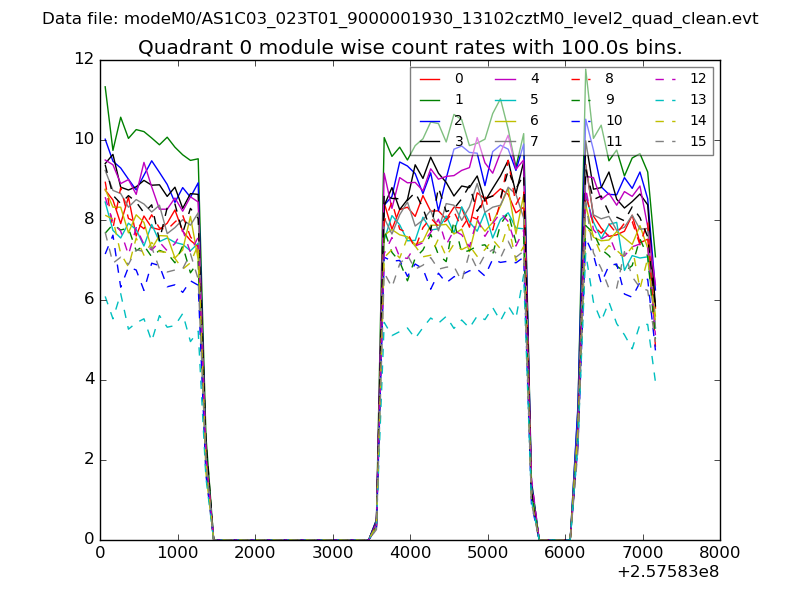 |
 |
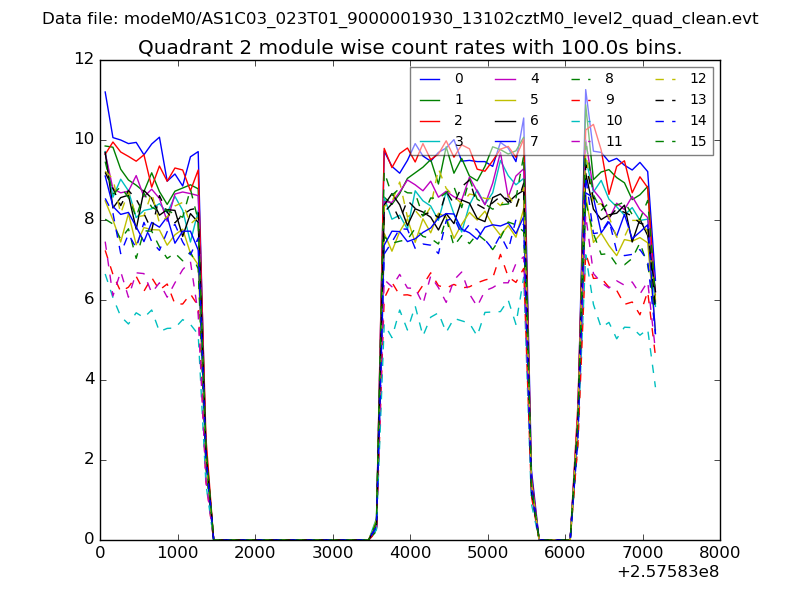
| Module-wise count rates for Quadrant B Data is divided into 100 sec bins |
 |
 |
| Module-wise count rates for Quadrant C Data is divided into 100 sec bins |
 |
 |
| Module-wise count rates for Quadrant D Data is divided into 100 sec bins |
 |
 |
| Parameter | Plot |
|---|---|
| CZT HV Monitor | 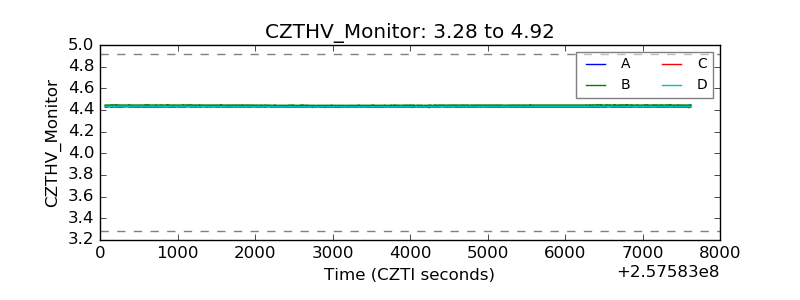 |
| D_VDD | 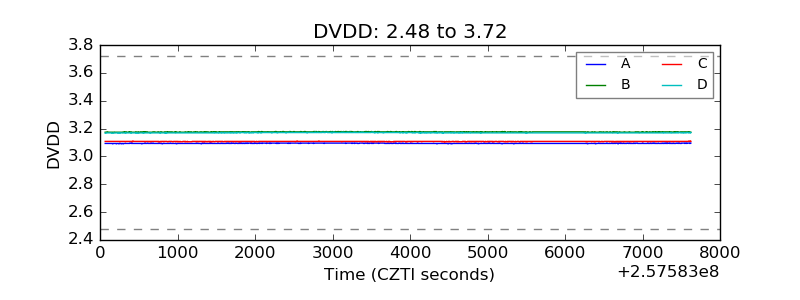 |
| Temperature 1 | 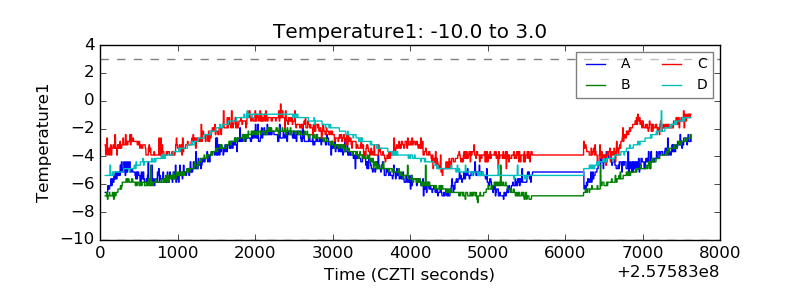 |
| Veto HV Monitor | 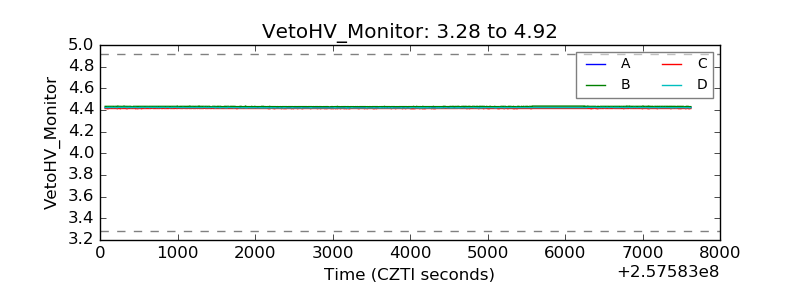 |
| Veto LLD | 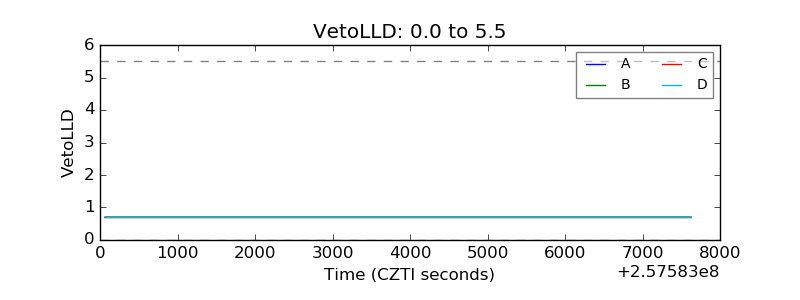 |
| Alpha Counter | 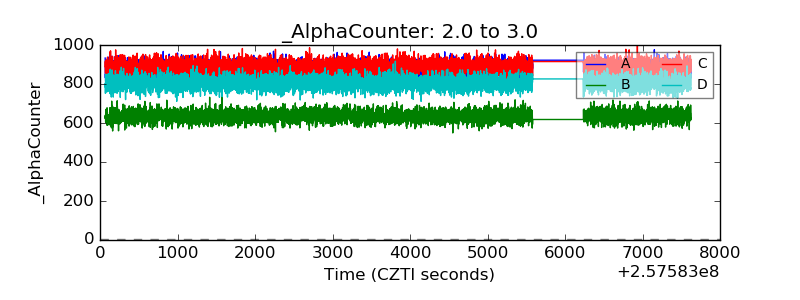 |
| _CPM_Rate | 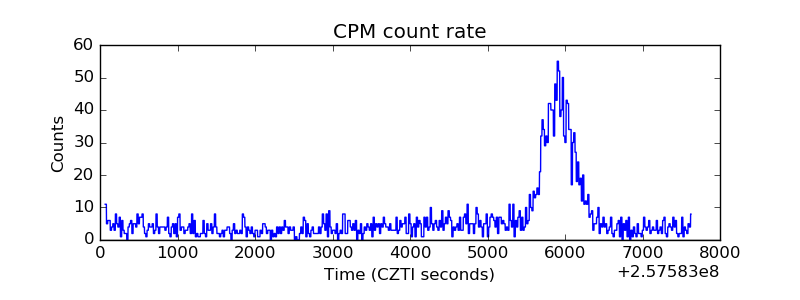 |
| CZT Counter | 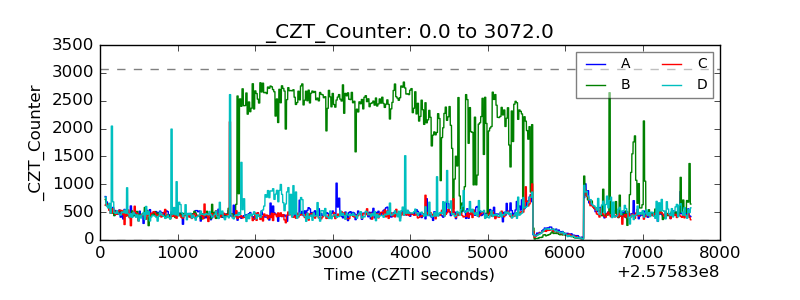 |
| +2.5 Volts monitor | 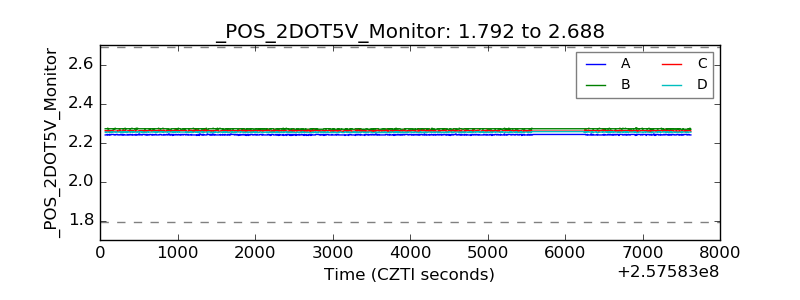 |
| +5 Volts monitor |  |
| _ROLL_ROT | 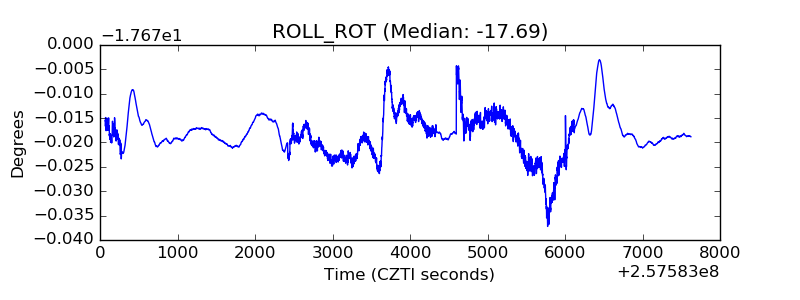 |
| _Roll_DEC | 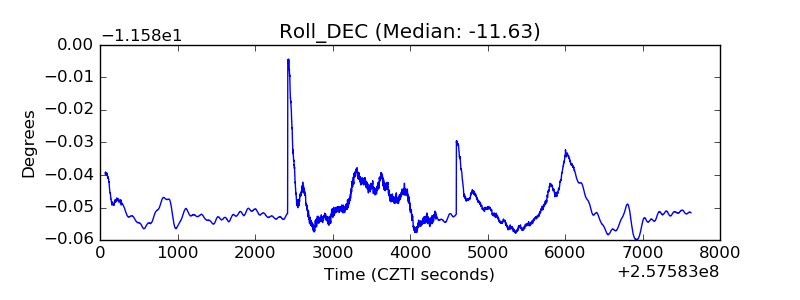 |
| _Roll_RA | 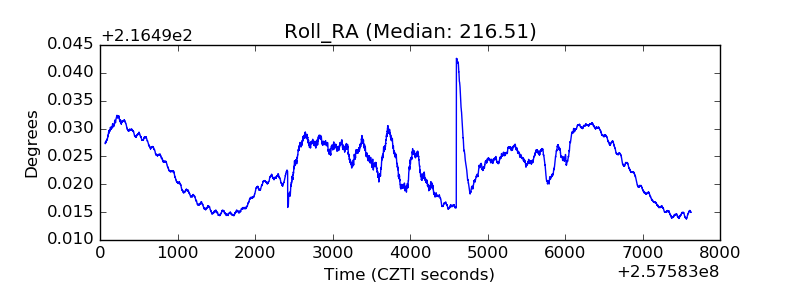 |
| Veto Counter | 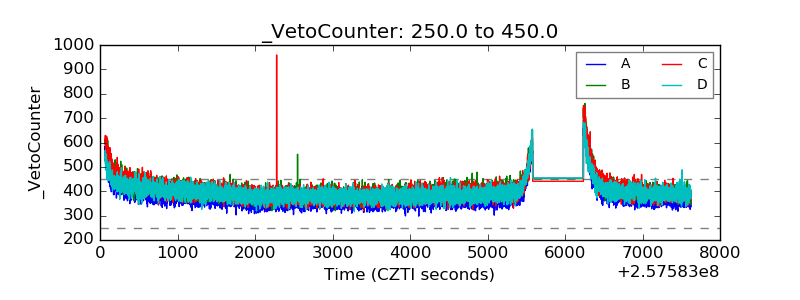 |