| Param | Original file | Final file |
|---|---|---|
| Filename | modeM0/AS1C03_023T01_9000001930_13103cztM0_level2.evt | modeM0/AS1C03_023T01_9000001930_13103cztM0_level2_quad_clean.evt |
| Size (bytes) | 732,908,160 | 83,724,480 |
| Size | 699.0 MB | 79.8 MB |
| Events in quadrant A | 3,766,559 | 533,628 |
| Events in quadrant B | 10,061,716 | 425,184 |
| Events in quadrant C | 3,474,140 | 544,705 |
| Events in quadrant D | 4,391,827 | 515,748 |
| Mode M0 | |||
|---|---|---|---|
| Quadrant | BADHDUFLAG | Total packets | Discarded packets |
| A | 0 | 15867 | 3 |
| B | 0 | 34748 | 2 |
| C | 0 | 15372 | 2 |
| D | 0 | 18018 | 2 |
| Mode M9 | |||
|---|---|---|---|
| Quadrant | BADHDUFLAG | Total packets | Discarded packets |
| A | 0 | 7 | 0 |
| B | 0 | 7 | 0 |
| C | 0 | 7 | 0 |
| D | 0 | 8 | 0 |
| Mode SS | |||
|---|---|---|---|
| Quadrant | BADHDUFLAG | Total packets | Discarded packets |
| A | 0 | 150 | 0 |
| B | 0 | 150 | 0 |
| C | 0 | 150 | 0 |
| D | 0 | 150 | 0 |
| Quadrant | Total seconds | Saturated seconds | Saturation percentage |
|---|---|---|---|
| A | 7401 | 200 | 2.702338% |
| B | 7401 | 3307 | 44.683151% |
| C | 7401 | 138 | 1.864613% |
| D | 7401 | 296 | 3.999460% |
Noise dominated data is calculated using 1-second bins in cleaned event files. If a bin has >2000 counts, and if more than 50% of those come from <1% of pixels, then it is considered to be noise-dominated and hence unusable.
| Quadrant | # 1 sec bins | Bins with >0 counts | Bins with >2000 counts | High rate bins dominated by noise | Noise dominated (total time) | Noise dominated (detector-on time) | Marked lightcurve |
|---|---|---|---|---|---|---|---|
| A | 7672 | 7403 | 3 | 3 | 0.04% | 0.04% | 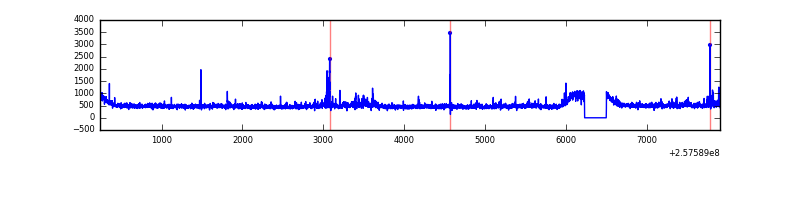 |
| B | 7672 | 7403 | 2625 | 2625 | 34.22% | 35.46% | 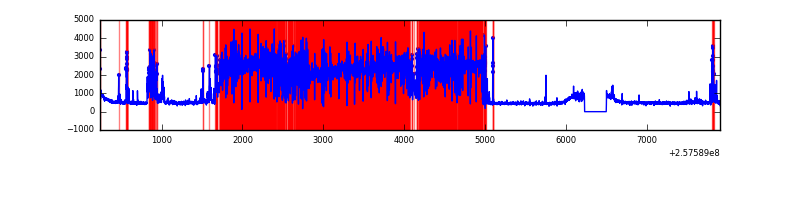 |
| C | 7672 | 7403 | 0 | 0 | 0.00% | 0.00% | 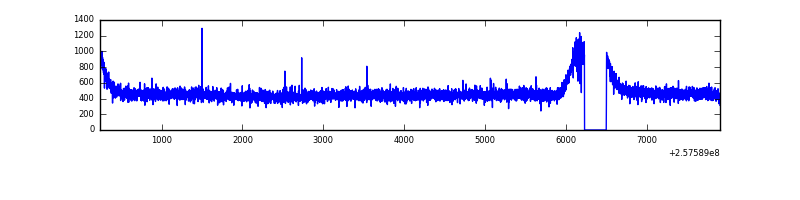 |
| D | 7672 | 7403 | 108 | 108 | 1.41% | 1.46% | 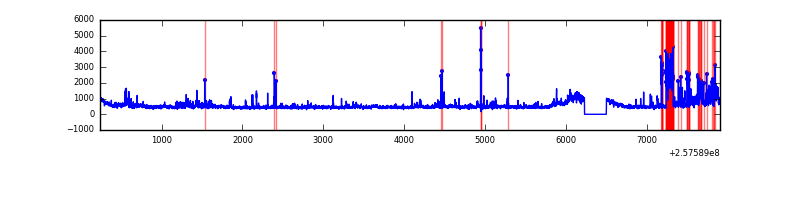 |
Top three noisy pixels from each quadrant. If the there are fewer than three noisy pixels in the level2.evt file, extra rows are filled as -1
| Pixel properties | Quadrant properties | ||||||
|---|---|---|---|---|---|---|---|
| Quadrant | DetID | PixID | Counts | Sigma | Mean | Median | Sigma |
| A | 12 | 189 | 163979 | 871.02 | 905 | 884 | 187.2 |
| A | 15 | 223 | 63249 | 333.07 | 905 | 884 | 187.2 |
| A | 15 | 239 | 21922 | 112.36 | 905 | 884 | 187.2 |
| B | 0 | 85 | 7218921 | 54143.58 | 672 | 653 | 133.3 |
| B | 3 | 64 | 123213 | 919.31 | 672 | 653 | 133.3 |
| B | 4 | 239 | 60866 | 451.65 | 672 | 653 | 133.3 |
| C | 13 | 61 | 6432 | 26.37 | 888 | 891 | 210.1 |
| C | 8 | 128 | 4373 | 16.57 | 888 | 891 | 210.1 |
| C | 14 | 234 | 3236 | 11.16 | 888 | 891 | 210.1 |
| D | 13 | 122 | 496113 | 2330.79 | 874 | 847 | 212.5 |
| D | 10 | 157 | 272822 | 1279.95 | 874 | 847 | 212.5 |
| D | 1 | 52 | 171149 | 801.46 | 874 | 847 | 212.5 |
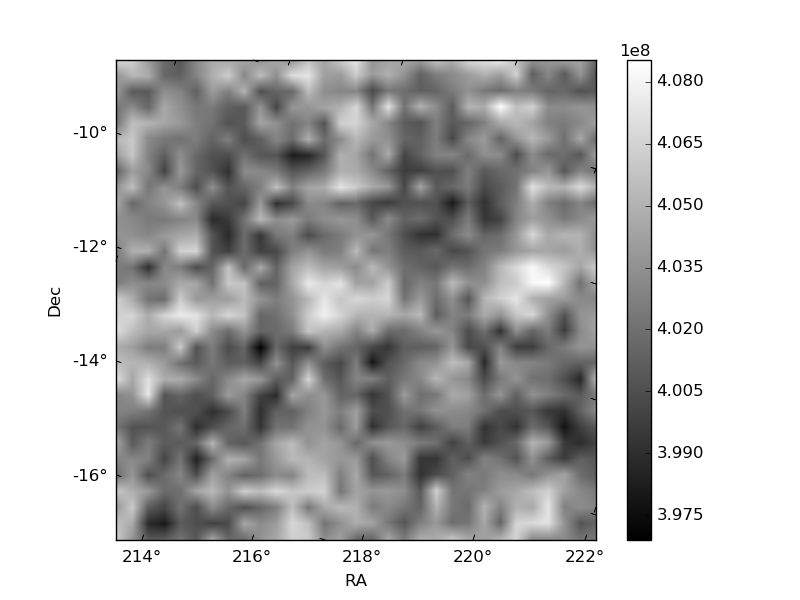
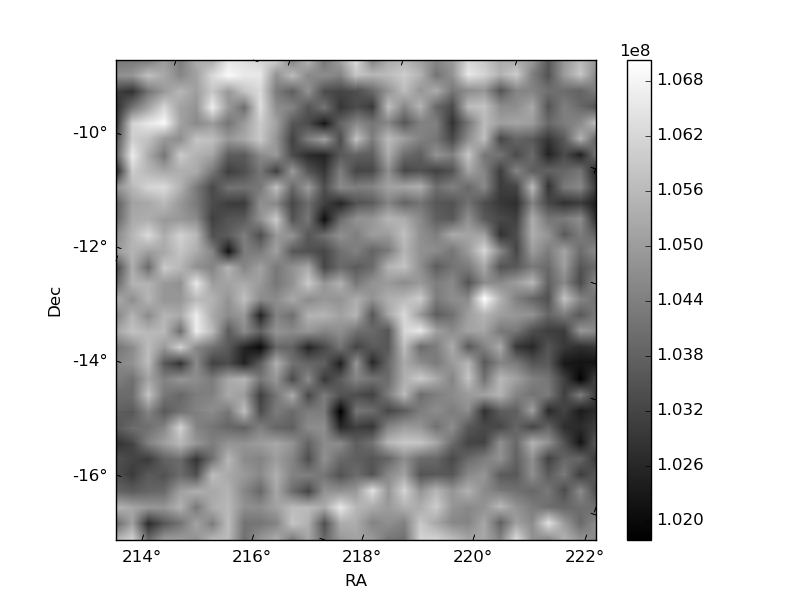
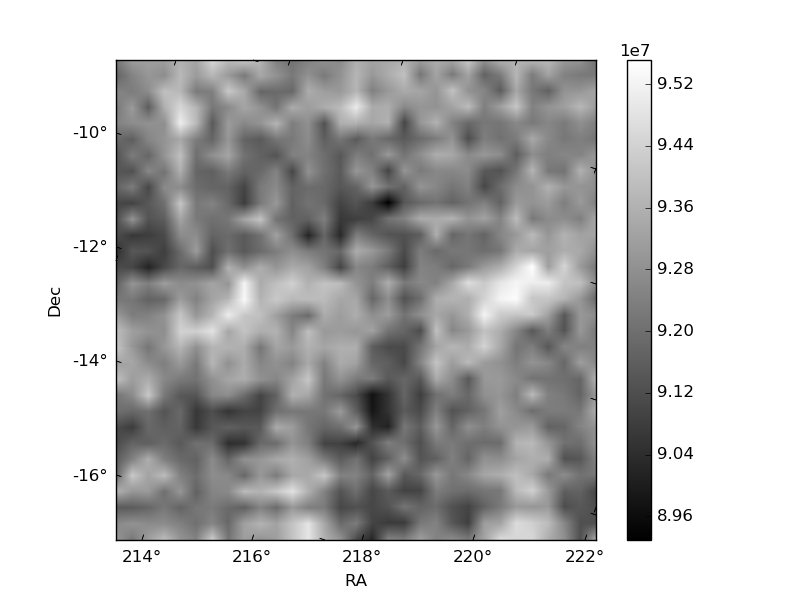
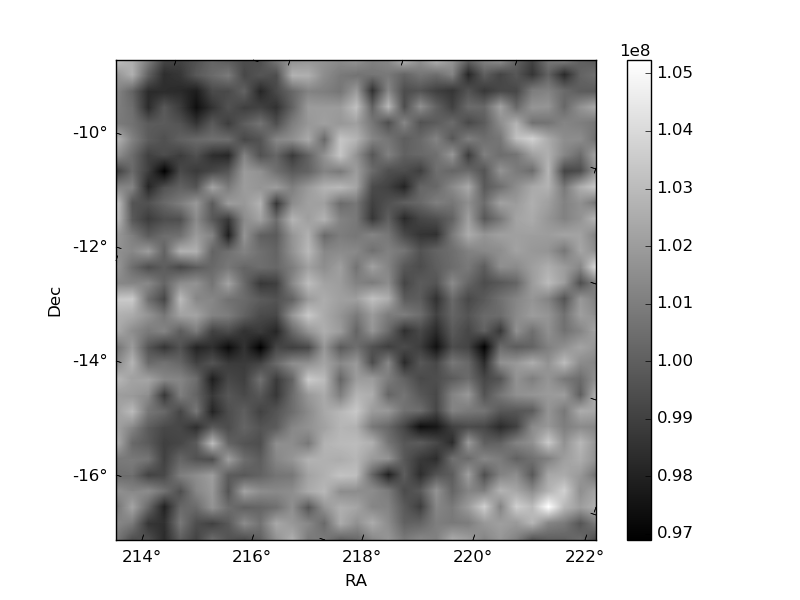
Histogram calculated using DETX and DETY for each event in the final _common_clean file
| Quadrant A | 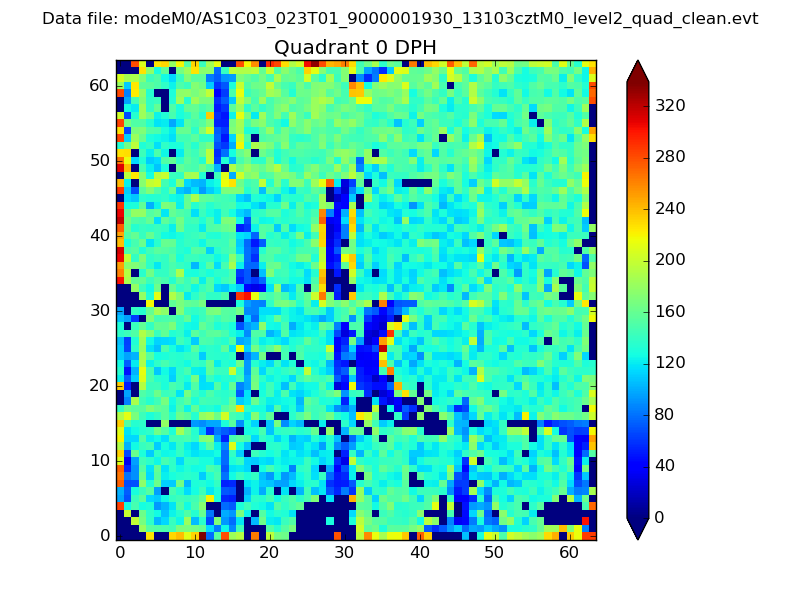 |
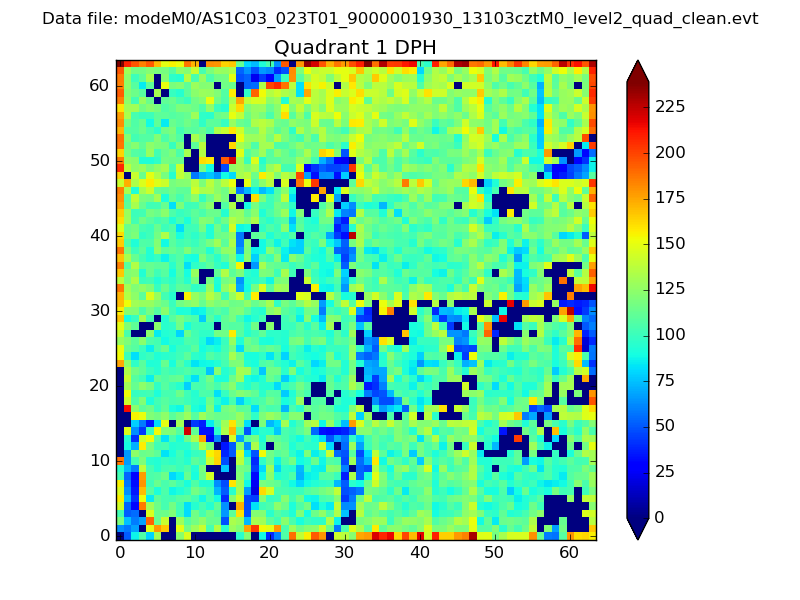 |
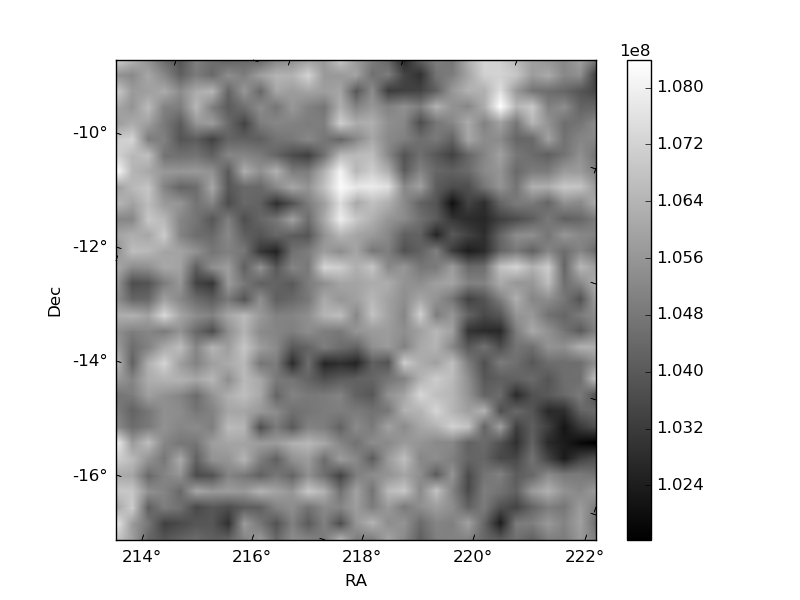
Quadrant B |
|---|---|---|---|
| Quadrant D | 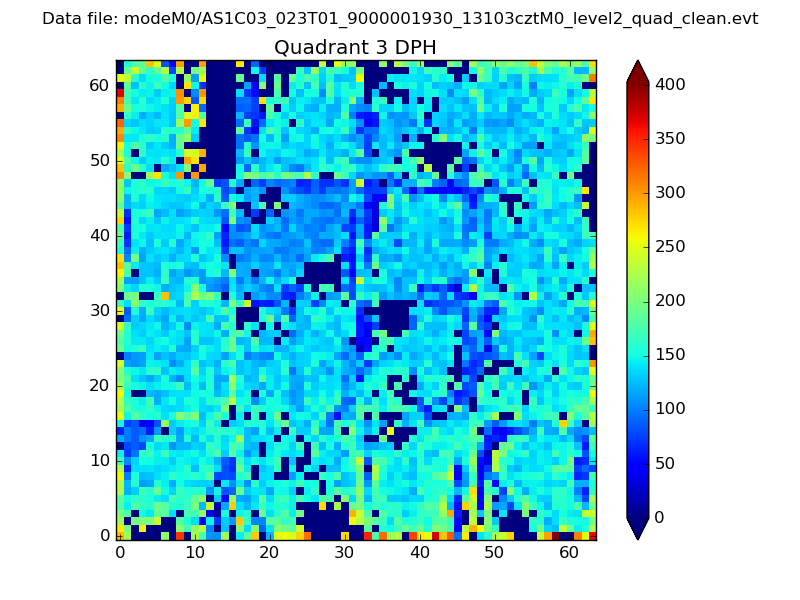 |
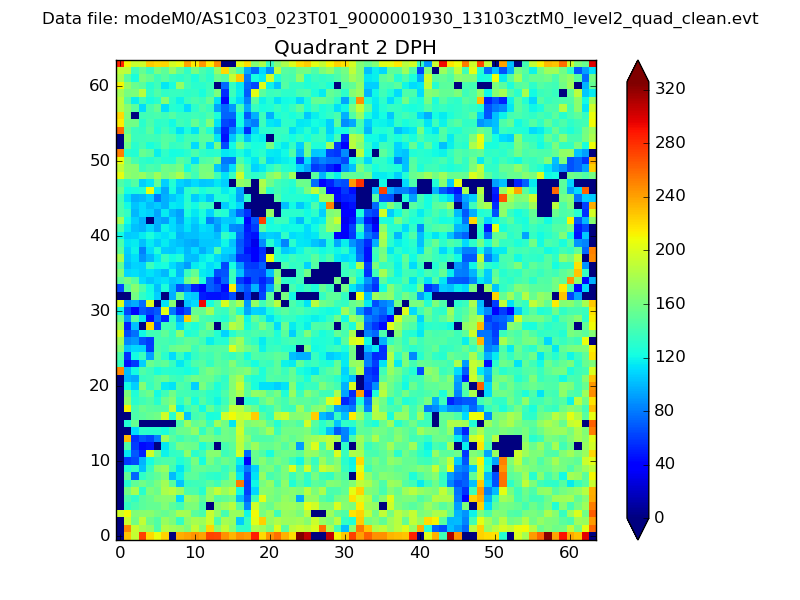 |
Quadrant C |
| Plot type | Count rate plots | Images |
|---|---|---|
| Comparison with Poisson distribution Blue bars denote a histogram of data divided into 1 sec bins. Red curve is a Poisson curve with rate = median count rate of data. |
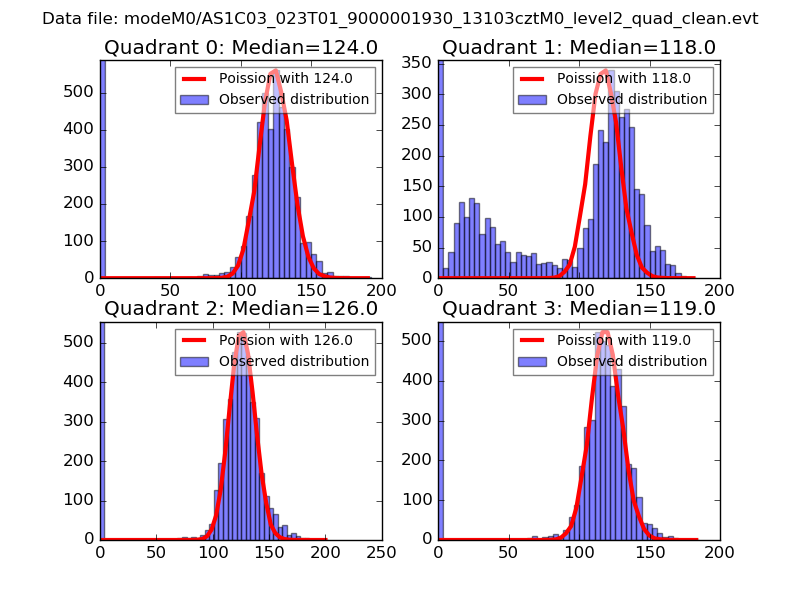 |
 |
| Quadrant-wise count rates Data is divided into 100 sec bins |
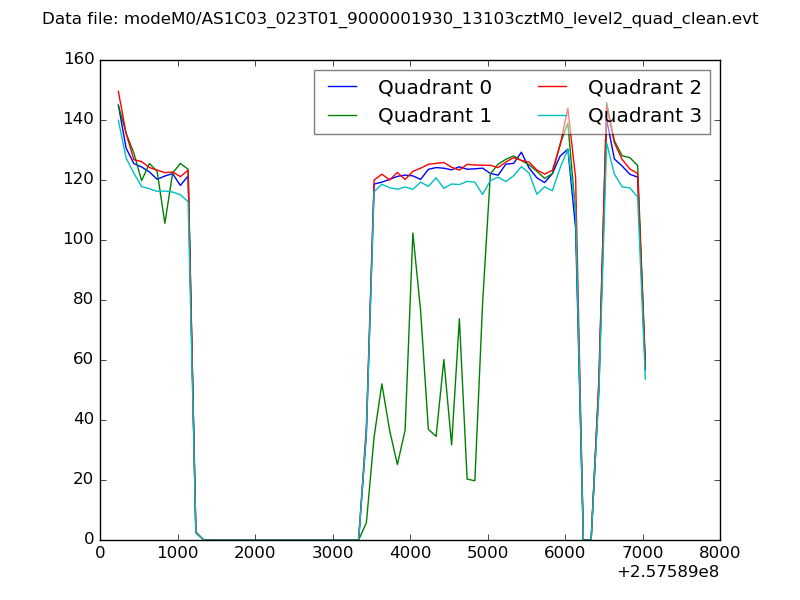 |
|
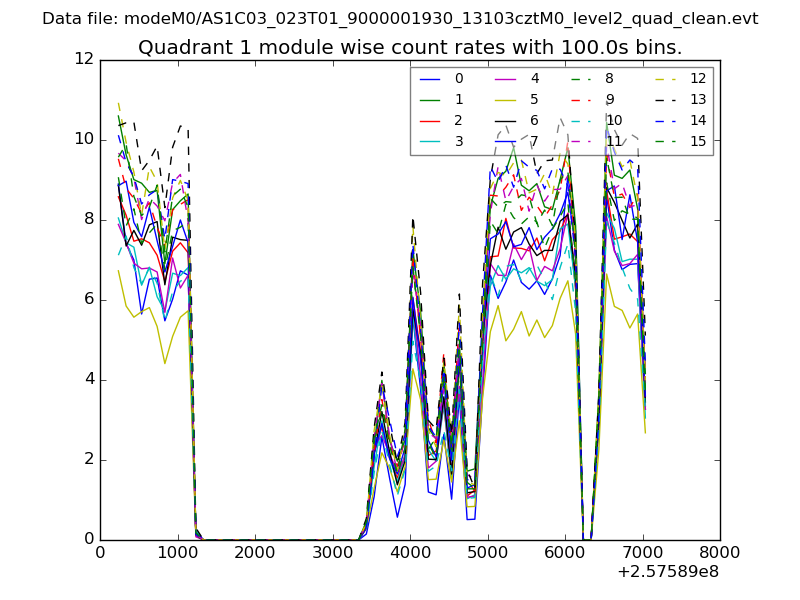
| Module-wise count rates for Quadrant A Data is divided into 100 sec bins |
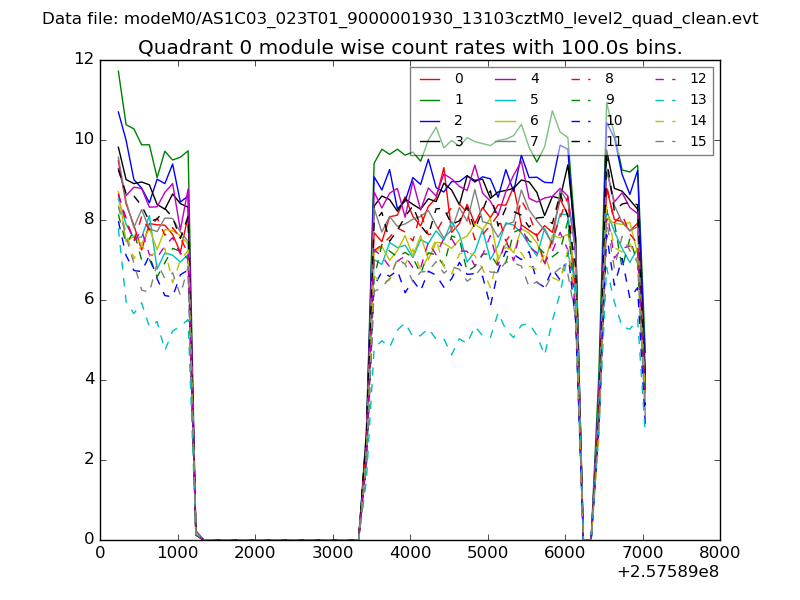 |
 |
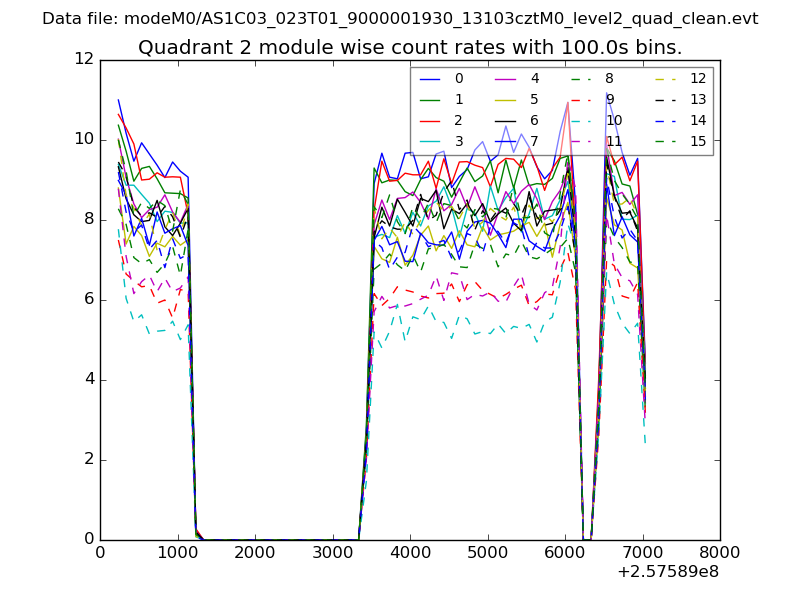
| Module-wise count rates for Quadrant B Data is divided into 100 sec bins |
 |
 |
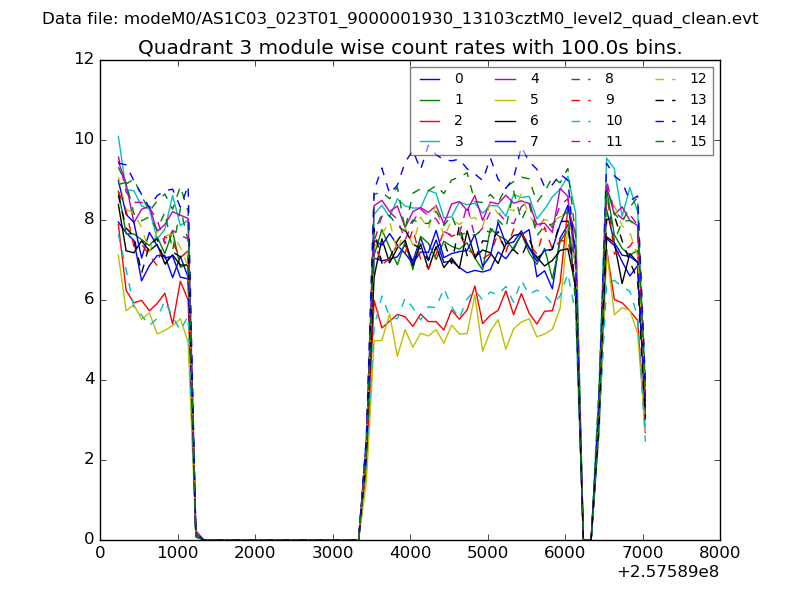
| Module-wise count rates for Quadrant C Data is divided into 100 sec bins |
 |
 |
| Module-wise count rates for Quadrant D Data is divided into 100 sec bins |
 |
 |
| Parameter | Plot |
|---|---|
| CZT HV Monitor | 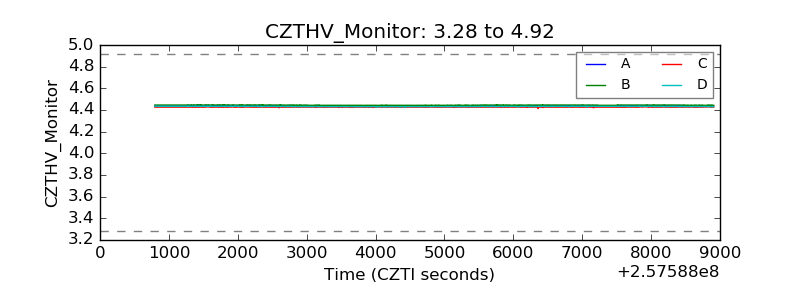 |
| D_VDD | 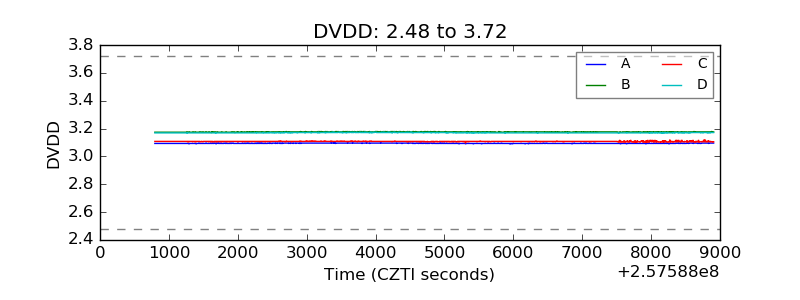 |
| Temperature 1 | 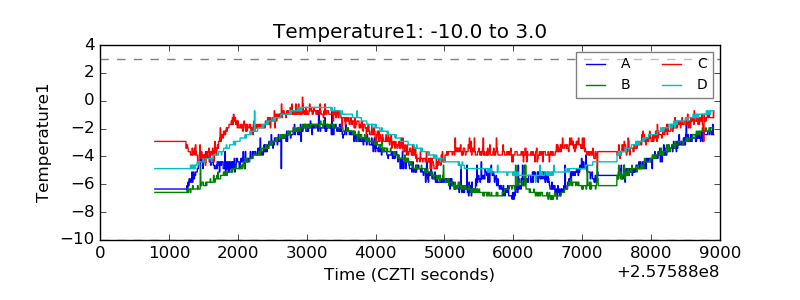 |
| Veto HV Monitor | 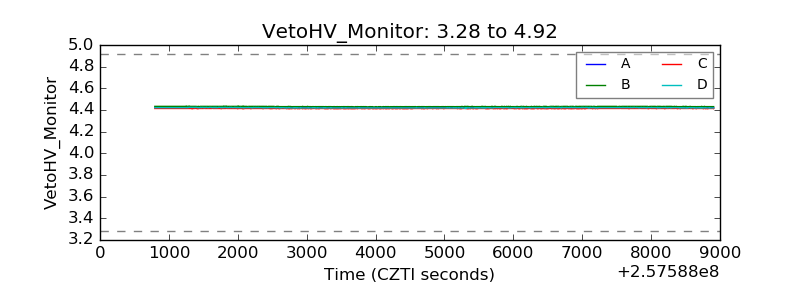 |
| Veto LLD |  |
| Alpha Counter | 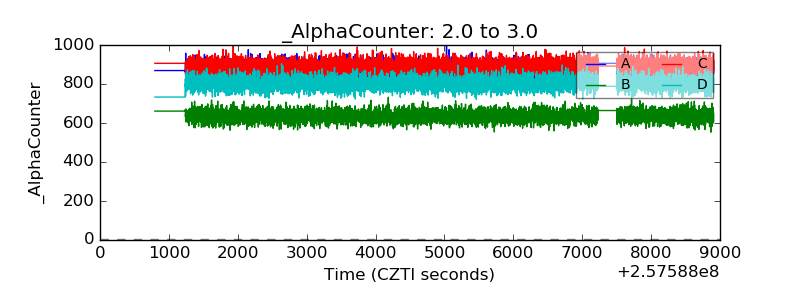 |
| _CPM_Rate | 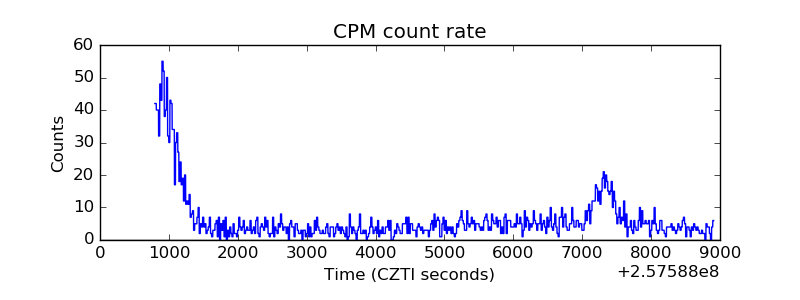 |
| CZT Counter | 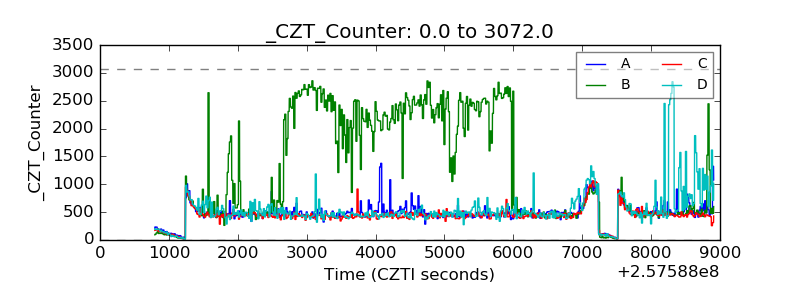 |
| +2.5 Volts monitor |  |
| +5 Volts monitor |  |
| _ROLL_ROT |  |
| _Roll_DEC | 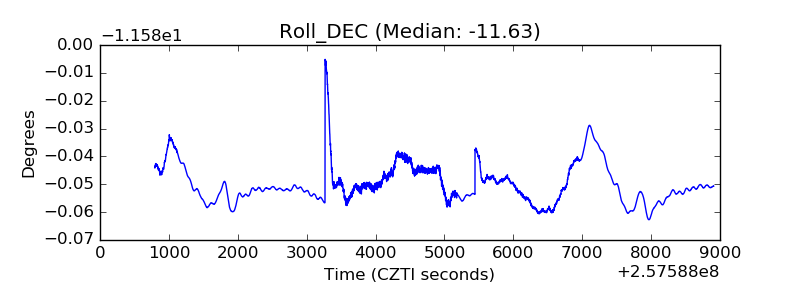 |
| _Roll_RA | 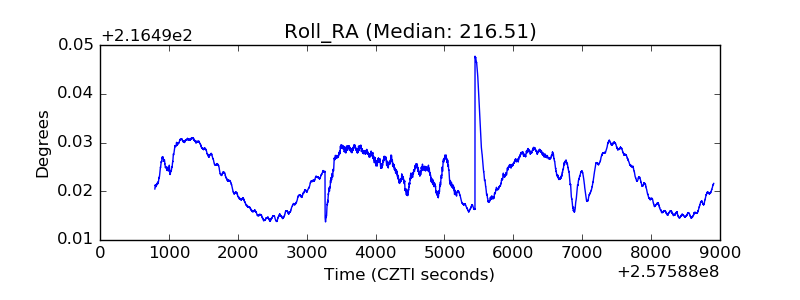 |
| Veto Counter |  |