| Param | Original file | Final file |
|---|---|---|
| Filename | modeM0/AS1C03_023T01_9000001930_13107cztM0_level2.evt | modeM0/AS1C03_023T01_9000001930_13107cztM0_level2_quad_clean.evt |
| Size (bytes) | 1,721,024,640 | 216,843,840 |
| Size | 1.6 GB | 206.8 MB |
| Events in quadrant A | 9,027,946 | 1,339,619 |
| Events in quadrant B | 14,714,291 | 1,338,023 |
| Events in quadrant C | 8,434,906 | 1,365,668 |
| Events in quadrant D | 18,695,126 | 1,246,709 |
| Mode M0 | |||
|---|---|---|---|
| Quadrant | BADHDUFLAG | Total packets | Discarded packets |
| A | 0 | 38933 | 5 |
| B | 0 | 55960 | 4 |
| C | 0 | 37818 | 4 |
| D | 0 | 68347 | 4 |
| Mode M9 | |||
|---|---|---|---|
| Quadrant | BADHDUFLAG | Total packets | Discarded packets |
| A | 0 | 21 | 0 |
| B | 0 | 21 | 0 |
| C | 0 | 21 | 0 |
| D | 0 | 21 | 0 |
| Mode SS | |||
|---|---|---|---|
| Quadrant | BADHDUFLAG | Total packets | Discarded packets |
| A | 0 | 378 | 0 |
| B | 0 | 378 | 0 |
| C | 0 | 378 | 0 |
| D | 0 | 378 | 0 |
| Quadrant | Total seconds | Saturated seconds | Saturation percentage |
|---|---|---|---|
| A | 18530 | 211 | 1.138694% |
| B | 18530 | 2937 | 15.849973% |
| C | 18530 | 124 | 0.669185% |
| D | 18530 | 2710 | 14.624933% |
Noise dominated data is calculated using 1-second bins in cleaned event files. If a bin has >2000 counts, and if more than 50% of those come from <1% of pixels, then it is considered to be noise-dominated and hence unusable.
| Quadrant | # 1 sec bins | Bins with >0 counts | Bins with >2000 counts | High rate bins dominated by noise | Noise dominated (total time) | Noise dominated (detector-on time) | Marked lightcurve |
|---|---|---|---|---|---|---|---|
| A | 20676 | 18535 | 22 | 22 | 0.11% | 0.12% | 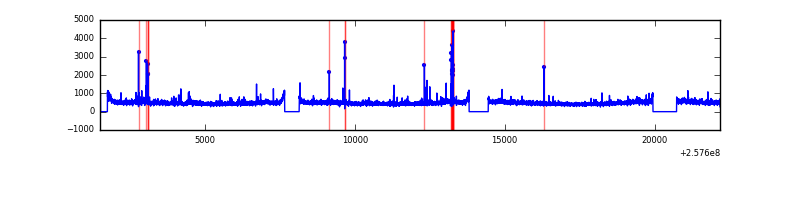 |
| B | 20676 | 18535 | 1887 | 1887 | 9.13% | 10.18% | 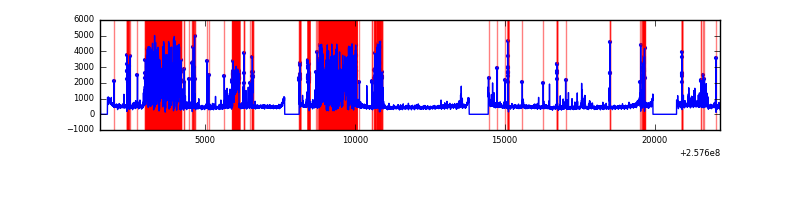 |
| C | 20676 | 18535 | 2 | 2 | 0.01% | 0.01% | 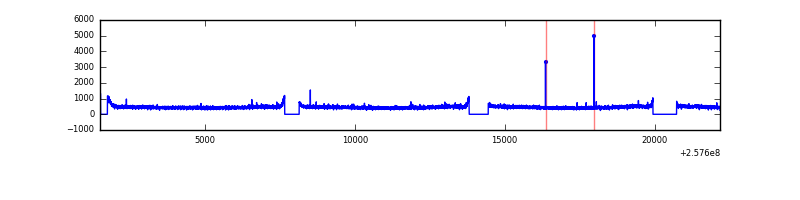 |
| D | 20676 | 18535 | 2013 | 2013 | 9.74% | 10.86% | 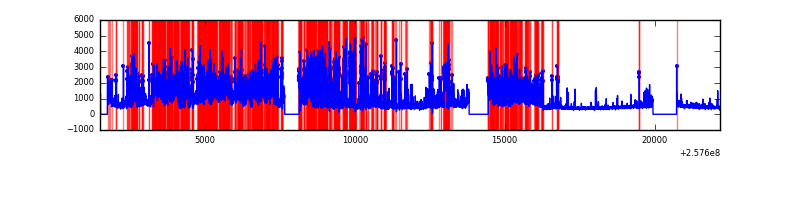 |
Top three noisy pixels from each quadrant. If the there are fewer than three noisy pixels in the level2.evt file, extra rows are filled as -1
| Pixel properties | Quadrant properties | ||||||
|---|---|---|---|---|---|---|---|
| Quadrant | DetID | PixID | Counts | Sigma | Mean | Median | Sigma |
| A | 12 | 189 | 230494 | 507.63 | 2198 | 2145 | 449.8 |
| A | 15 | 223 | 109955 | 239.67 | 2198 | 2145 | 449.8 |
| A | 8 | 15 | 78231 | 169.14 | 2198 | 2145 | 449.8 |
| B | 4 | 239 | 5439427 | 14382.28 | 1986 | 1935 | 378.1 |
| B | 0 | 85 | 990391 | 2614.48 | 1986 | 1935 | 378.1 |
| B | 3 | 64 | 351771 | 925.32 | 1986 | 1935 | 378.1 |
| C | 13 | 61 | 15735 | 27.13 | 2153 | 2161 | 500.3 |
| C | 14 | 234 | 15021 | 25.7 | 2153 | 2161 | 500.3 |
| C | 8 | 128 | 12048 | 19.76 | 2153 | 2161 | 500.3 |
| D | 13 | 122 | 5404016 | 10981.63 | 2033 | 1977 | 491.9 |
| D | 1 | 52 | 4651222 | 9451.3 | 2033 | 1977 | 491.9 |
| D | 14 | 34 | 372673 | 753.58 | 2033 | 1977 | 491.9 |
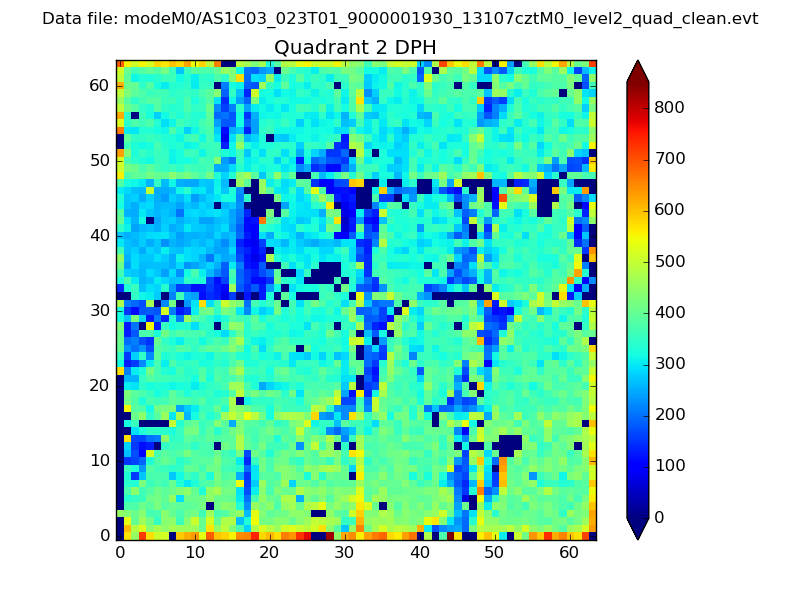
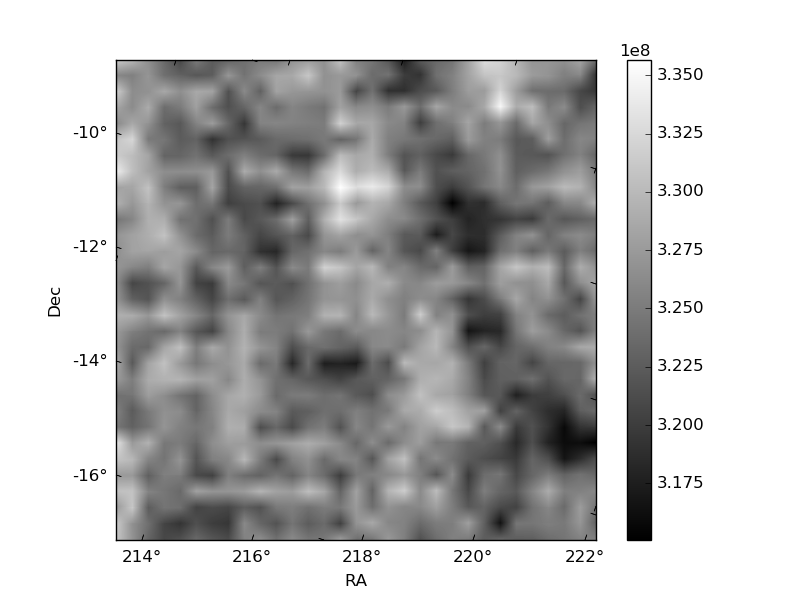
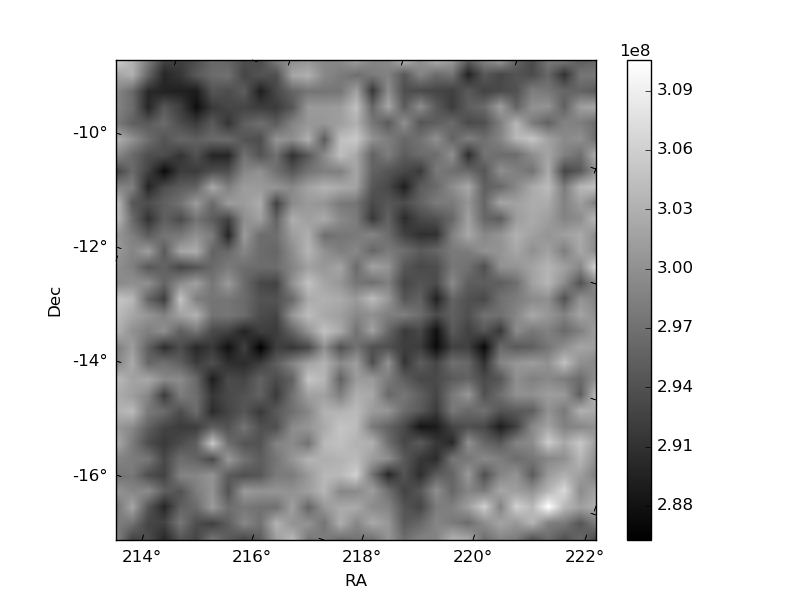
Histogram calculated using DETX and DETY for each event in the final _common_clean file
| Quadrant A | 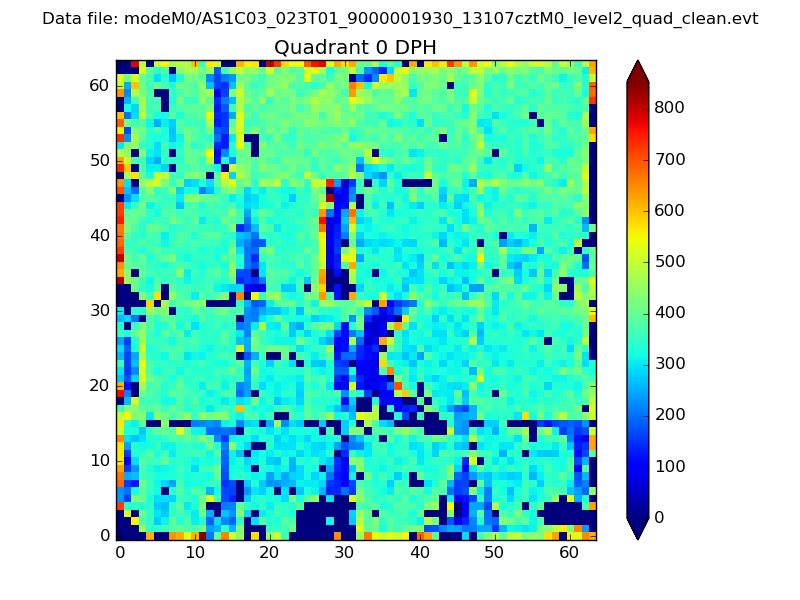 |
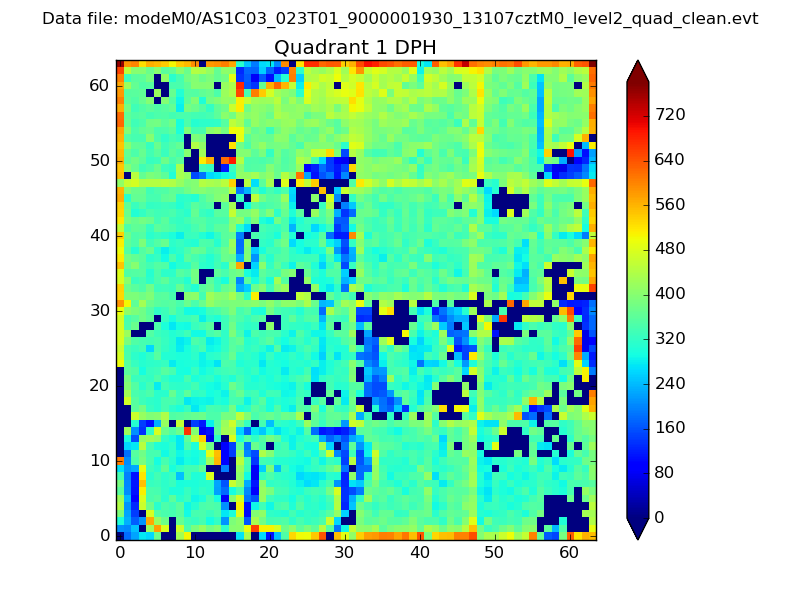 |
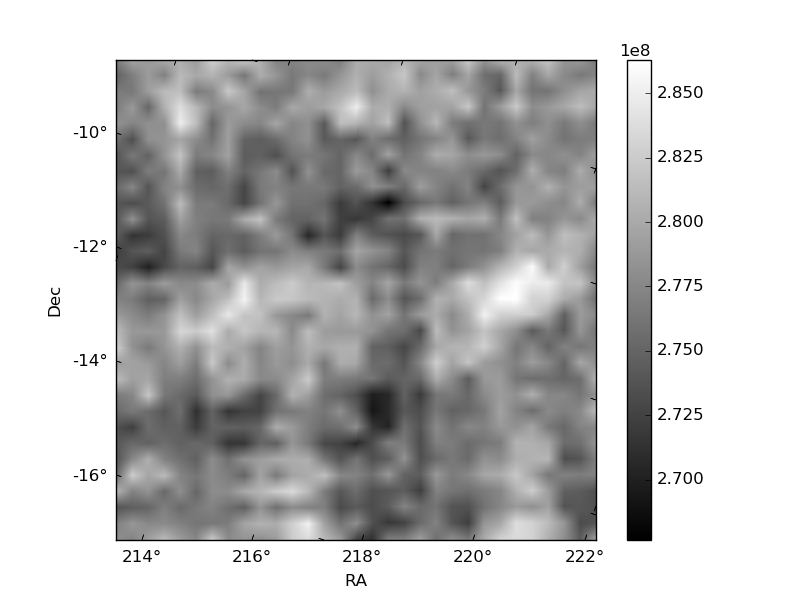
Quadrant B |
|---|---|---|---|
| Quadrant D | 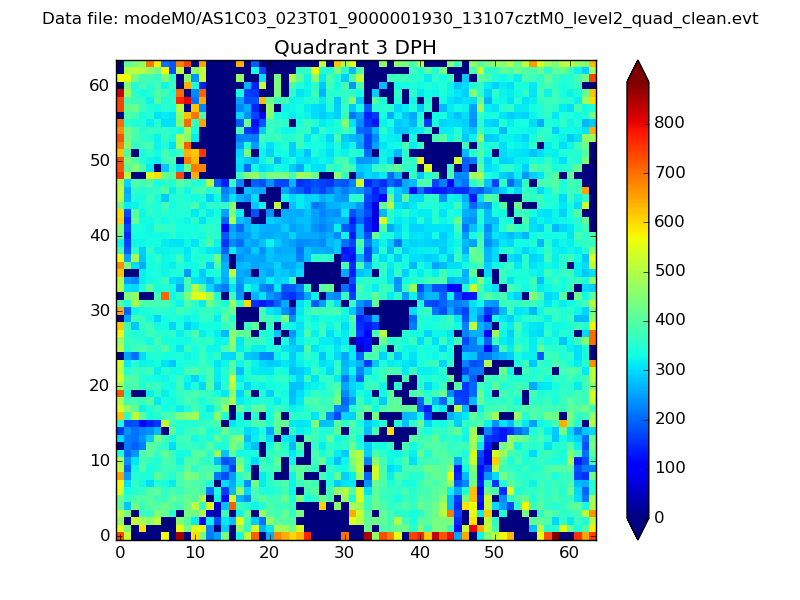 |
 |
Quadrant C |
| Plot type | Count rate plots | Images |
|---|---|---|
| Comparison with Poisson distribution Blue bars denote a histogram of data divided into 1 sec bins. Red curve is a Poisson curve with rate = median count rate of data. |
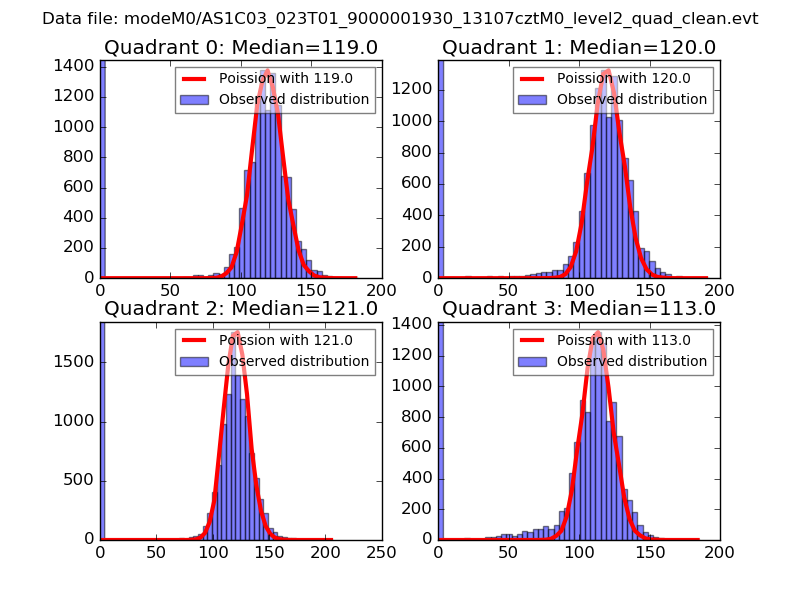 |
 |
| Quadrant-wise count rates Data is divided into 100 sec bins |
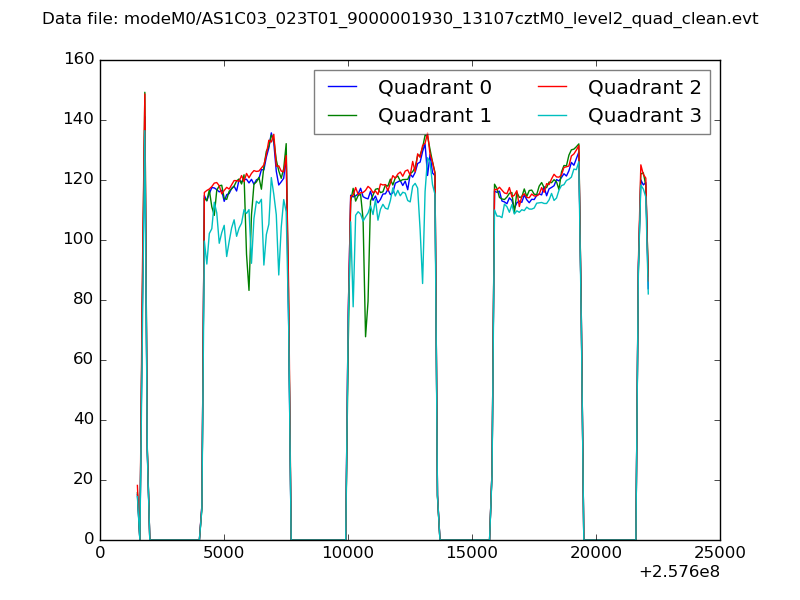 |
|
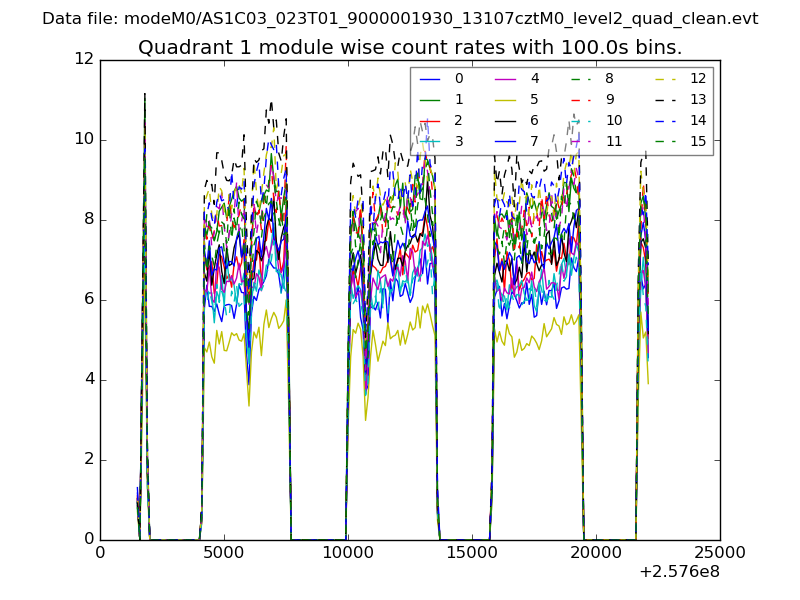
| Module-wise count rates for Quadrant A Data is divided into 100 sec bins |
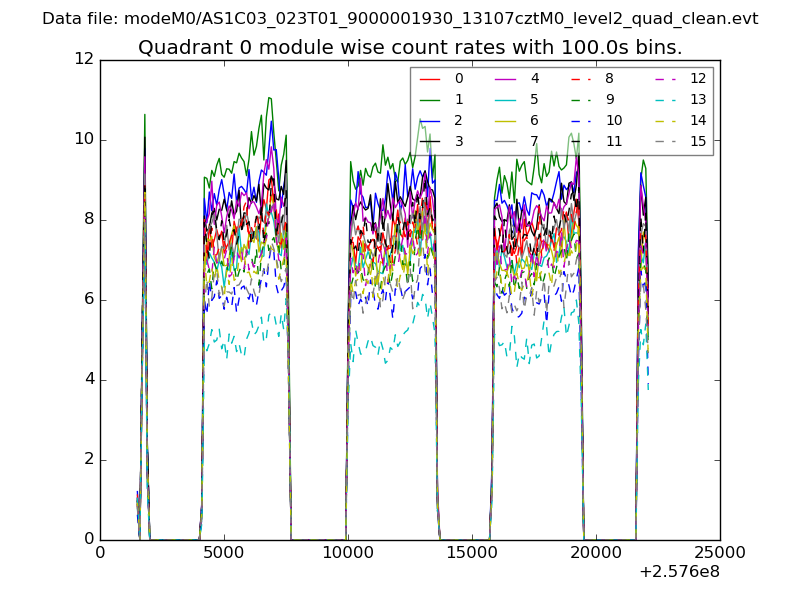 |
 |
| Module-wise count rates for Quadrant B Data is divided into 100 sec bins |
 |
 |
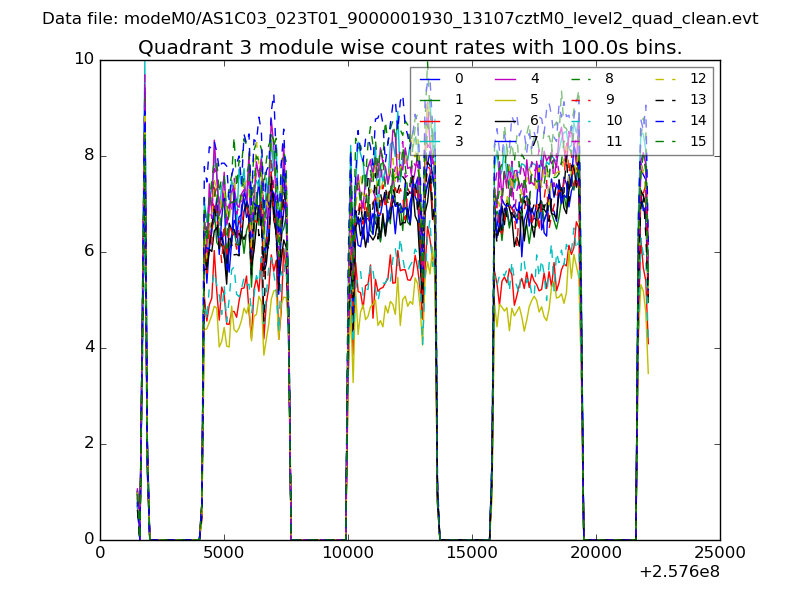
| Module-wise count rates for Quadrant C Data is divided into 100 sec bins |
 |
 |
| Module-wise count rates for Quadrant D Data is divided into 100 sec bins |
 |
 |
| Parameter | Plot |
|---|---|
| CZT HV Monitor | 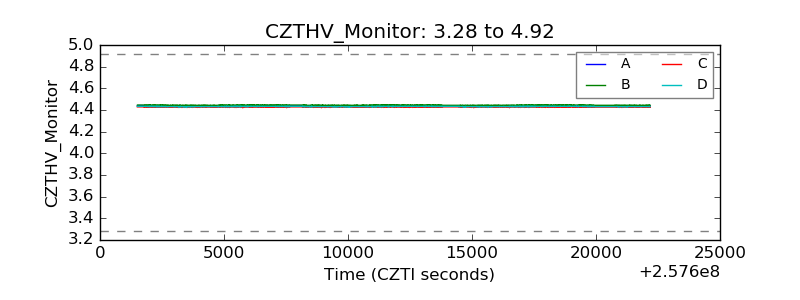 |
| D_VDD | 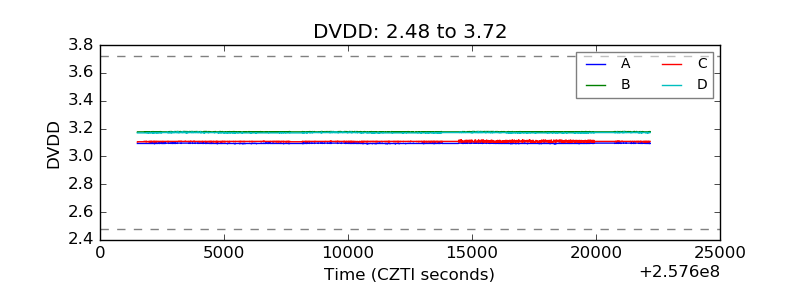 |
| Temperature 1 | 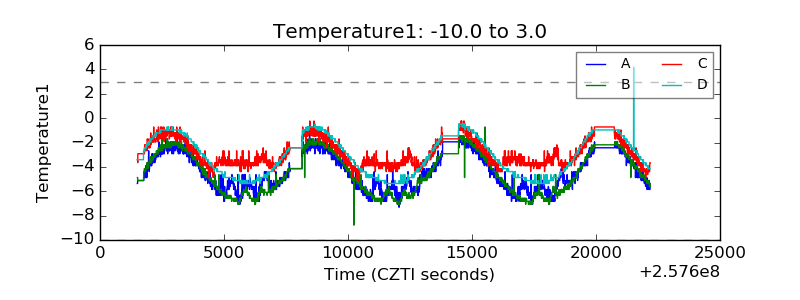 |
| Veto HV Monitor | 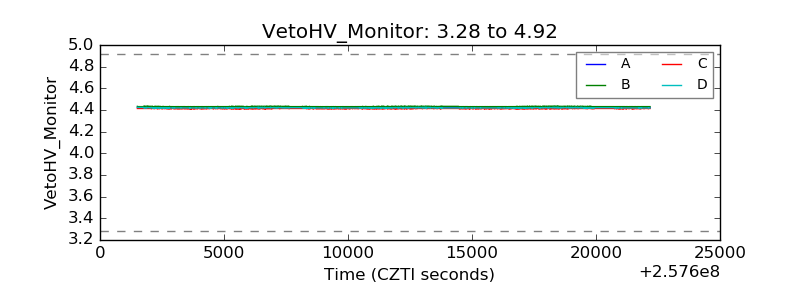 |
| Veto LLD |  |
| Alpha Counter | 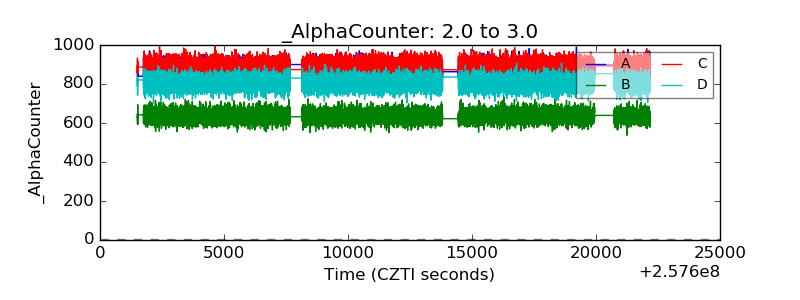 |
| _CPM_Rate | 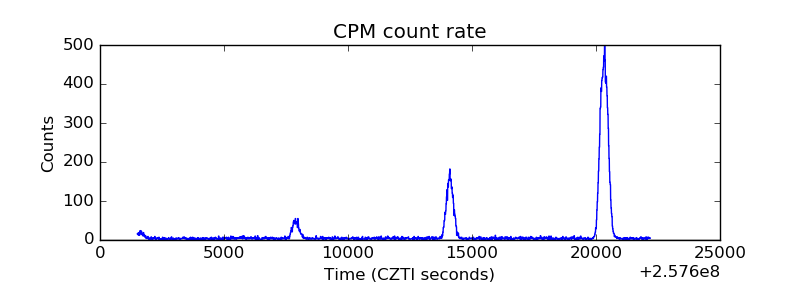 |
| CZT Counter | 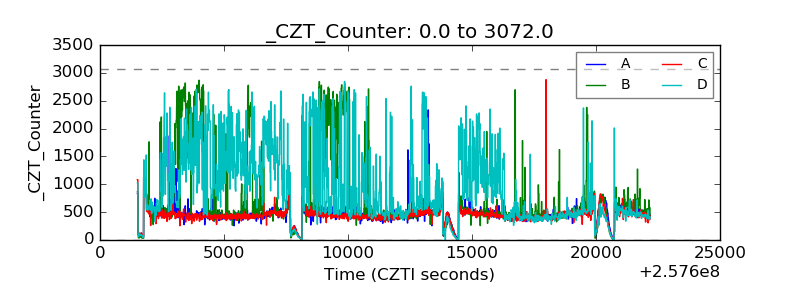 |
| +2.5 Volts monitor |  |
| +5 Volts monitor | 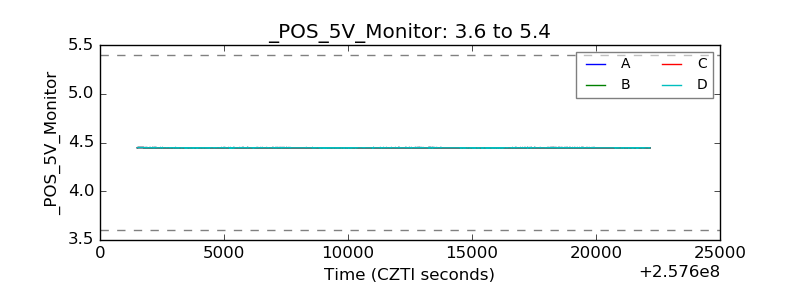 |
| _ROLL_ROT | 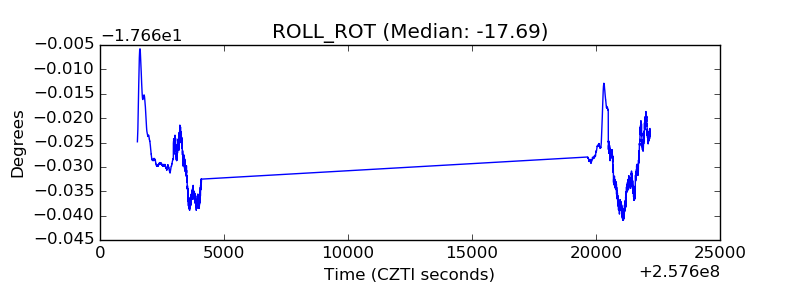 |
| _Roll_DEC | 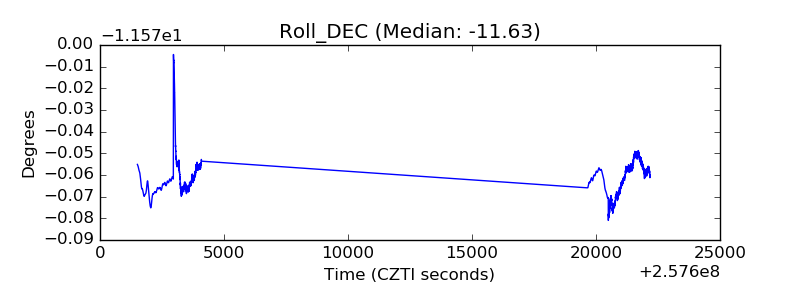 |
| _Roll_RA |  |
| Veto Counter | 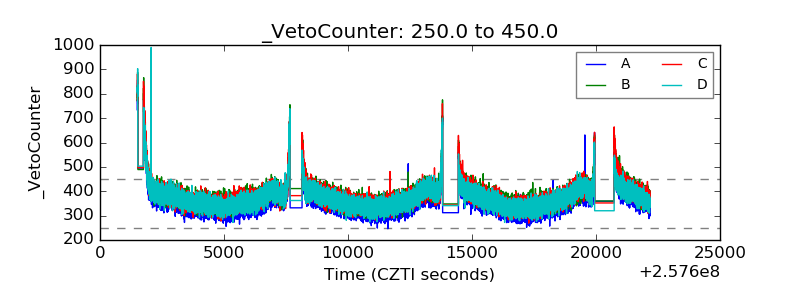 |