| Param | Original file | Final file |
|---|---|---|
| Filename | modeM0/AS1C03_023T01_9000001930_13112cztM0_level2.evt | modeM0/AS1C03_023T01_9000001930_13112cztM0_level2_quad_clean.evt |
| Size (bytes) | 487,163,520 | 14,451,840 |
| Size | 464.6 MB | 13.8 MB |
| Events in quadrant A | 2,900,473 | 6,686 |
| Events in quadrant B | 4,016,391 | 6,906 |
| Events in quadrant C | 2,789,635 | 6,806 |
| Events in quadrant D | 4,647,973 | 4,825 |
| Mode M0 | |||
|---|---|---|---|
| Quadrant | BADHDUFLAG | Total packets | Discarded packets |
| A | 0 | 12521 | 2 |
| B | 0 | 15873 | 2 |
| C | 0 | 12184 | 2 |
| D | 0 | 17841 | 2 |
| Mode M9 | |||
|---|---|---|---|
| Quadrant | BADHDUFLAG | Total packets | Discarded packets |
| A | 0 | 16 | 0 |
| B | 0 | 16 | 0 |
| C | 0 | 16 | 0 |
| D | 0 | 17 | 0 |
| Mode SS | |||
|---|---|---|---|
| Quadrant | BADHDUFLAG | Total packets | Discarded packets |
| A | 0 | 120 | 0 |
| B | 0 | 120 | 0 |
| C | 0 | 120 | 0 |
| D | 0 | 120 | 0 |
| Quadrant | Total seconds | Saturated seconds | Saturation percentage |
|---|---|---|---|
| A | 5880 | 24 | 0.408163% |
| B | 5880 | 373 | 6.343537% |
| C | 5880 | 10 | 0.170068% |
| D | 5880 | 439 | 7.465986% |
Noise dominated data is calculated using 1-second bins in cleaned event files. If a bin has >2000 counts, and if more than 50% of those come from <1% of pixels, then it is considered to be noise-dominated and hence unusable.
| Quadrant | # 1 sec bins | Bins with >0 counts | Bins with >2000 counts | High rate bins dominated by noise | Noise dominated (total time) | Noise dominated (detector-on time) | Marked lightcurve |
|---|---|---|---|---|---|---|---|
| A | 7076 | 5882 | 4 | 4 | 0.06% | 0.07% | 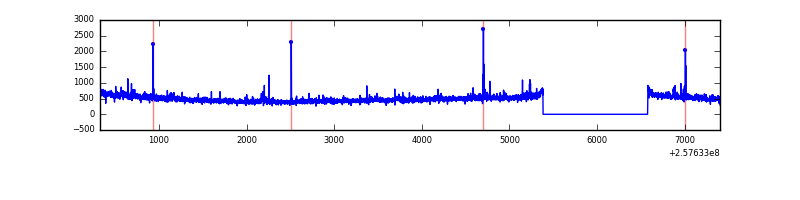 |
| B | 7076 | 5882 | 209 | 209 | 2.95% | 3.55% | 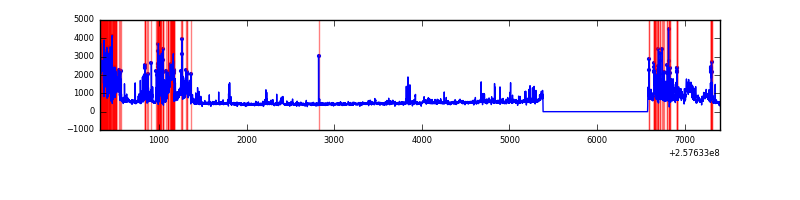 |
| C | 7076 | 5882 | 0 | 0 | 0.00% | 0.00% | 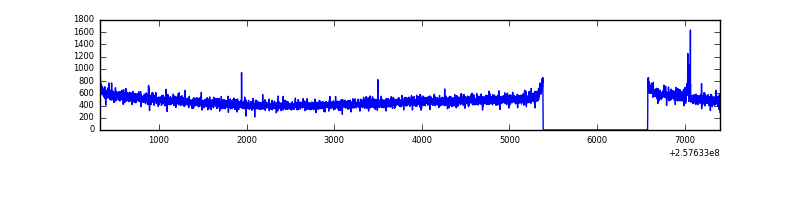 |
| D | 7076 | 5882 | 361 | 361 | 5.10% | 6.14% | 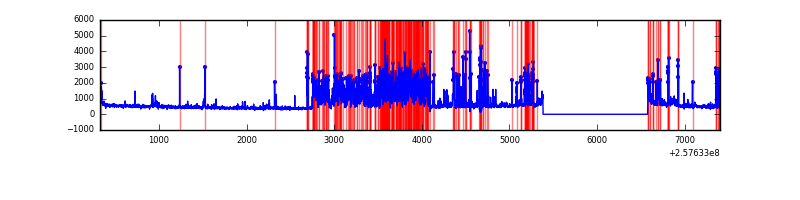 |
Top three noisy pixels from each quadrant. If the there are fewer than three noisy pixels in the level2.evt file, extra rows are filled as -1
| Pixel properties | Quadrant properties | ||||||
|---|---|---|---|---|---|---|---|
| Quadrant | DetID | PixID | Counts | Sigma | Mean | Median | Sigma |
| A | 12 | 189 | 57914 | 390.42 | 720 | 705 | 146.5 |
| A | 1 | 162 | 24339 | 161.29 | 720 | 705 | 146.5 |
| A | 15 | 223 | 12490 | 80.43 | 720 | 705 | 146.5 |
| B | 0 | 85 | 1069487 | 7925.07 | 709 | 692 | 134.9 |
| B | 3 | 64 | 142477 | 1051.33 | 709 | 692 | 134.9 |
| B | 12 | 111 | 15335 | 108.58 | 709 | 692 | 134.9 |
| C | 15 | 208 | 15545 | 89.46 | 709 | 714 | 165.8 |
| C | 0 | 207 | 8738 | 48.4 | 709 | 714 | 165.8 |
| C | 13 | 61 | 5187 | 26.98 | 709 | 714 | 165.8 |
| D | 1 | 52 | 1615368 | 9717.99 | 681 | 661 | 166.2 |
| D | 10 | 157 | 256381 | 1539.03 | 681 | 661 | 166.2 |
| D | 8 | 195 | 74333 | 443.39 | 681 | 661 | 166.2 |
Histogram calculated using DETX and DETY for each event in the final _common_clean file
| Quadrant A | 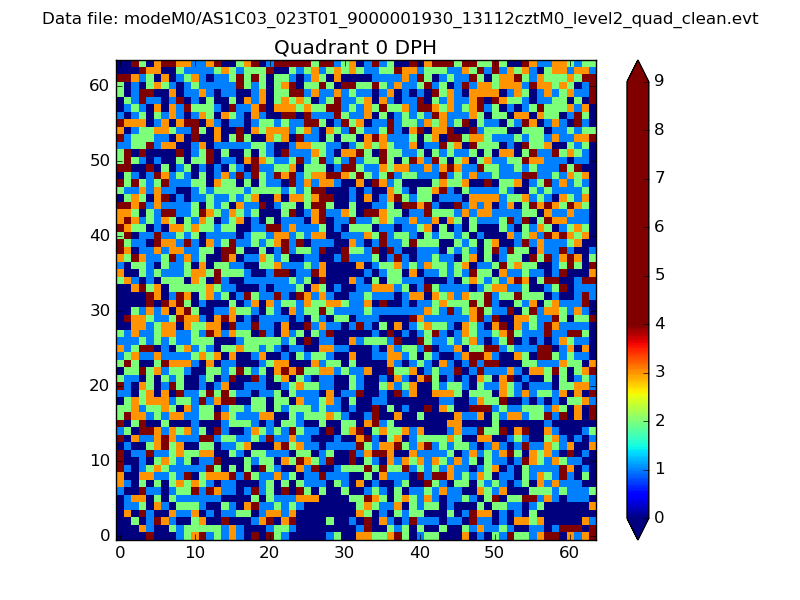 |
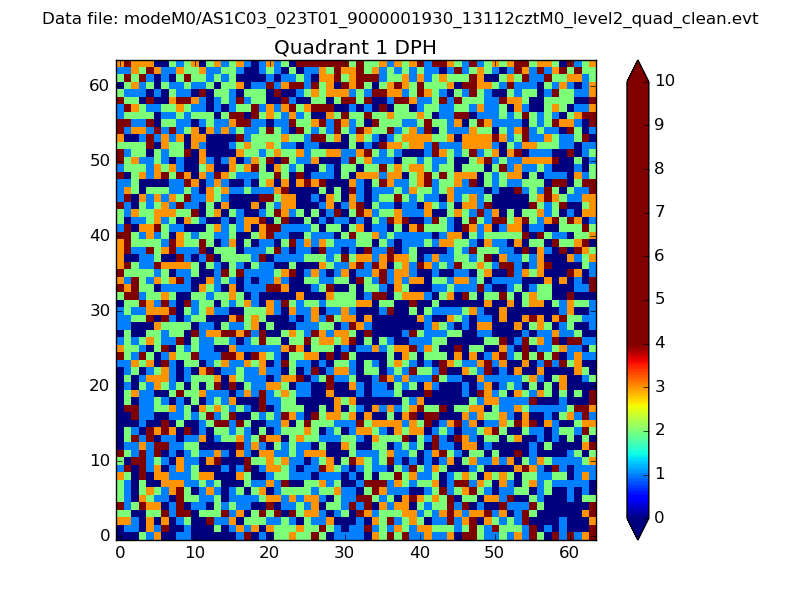 |
Quadrant B |
|---|---|---|---|
| Quadrant D | 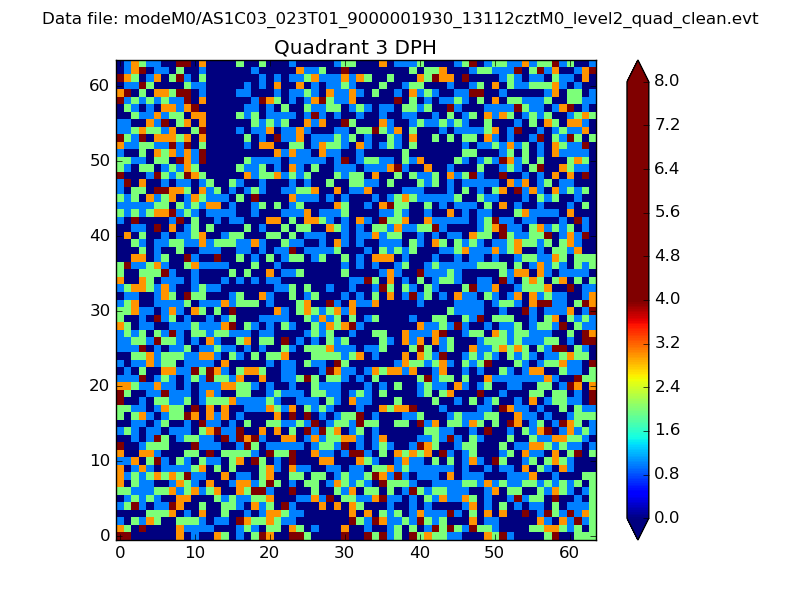 |
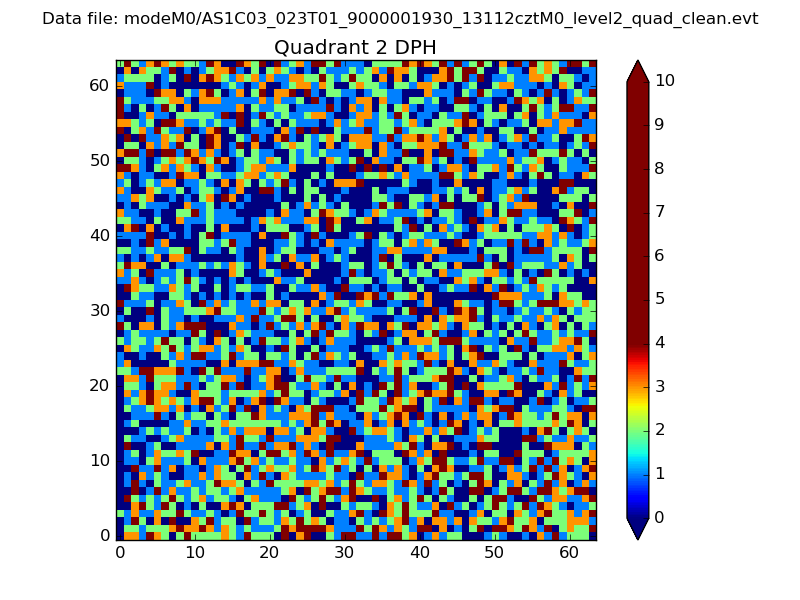 |
Quadrant C |
| Plot type | Count rate plots | Images |
|---|---|---|
| Comparison with Poisson distribution Blue bars denote a histogram of data divided into 1 sec bins. Red curve is a Poisson curve with rate = median count rate of data. |
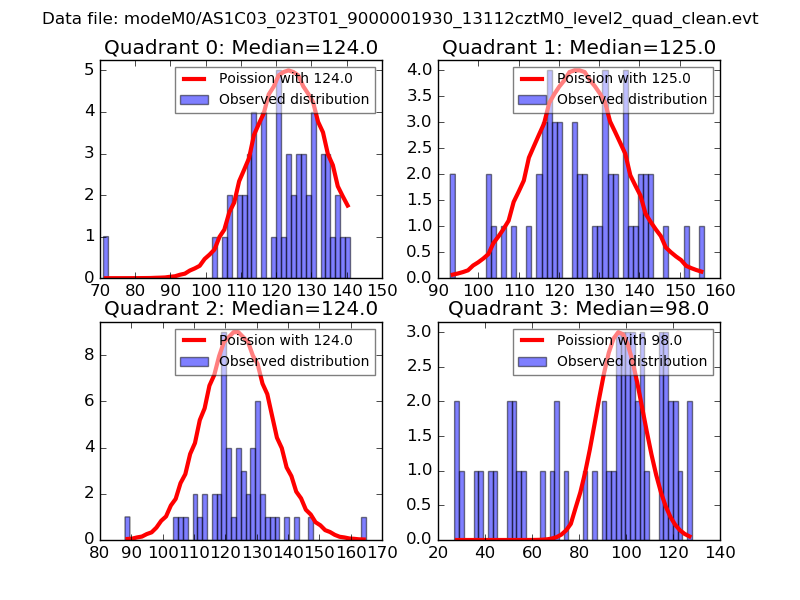 |
 |
| Quadrant-wise count rates Data is divided into 100 sec bins |
 |
|
| Module-wise count rates for Quadrant A Data is divided into 100 sec bins |
 |
 |
| Module-wise count rates for Quadrant B Data is divided into 100 sec bins |
 |
 |
| Module-wise count rates for Quadrant C Data is divided into 100 sec bins |
 |
 |
| Module-wise count rates for Quadrant D Data is divided into 100 sec bins |
 |
 |
| Parameter | Plot |
|---|---|
| CZT HV Monitor | 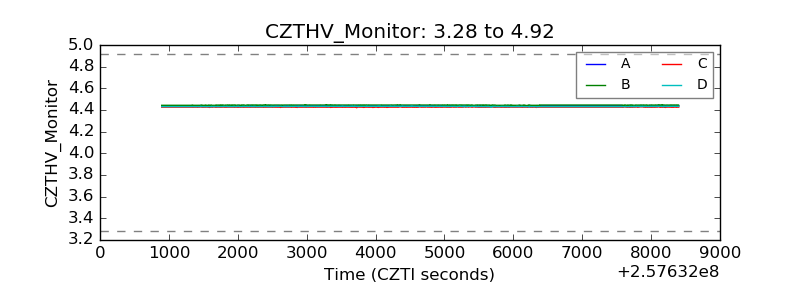 |
| D_VDD | 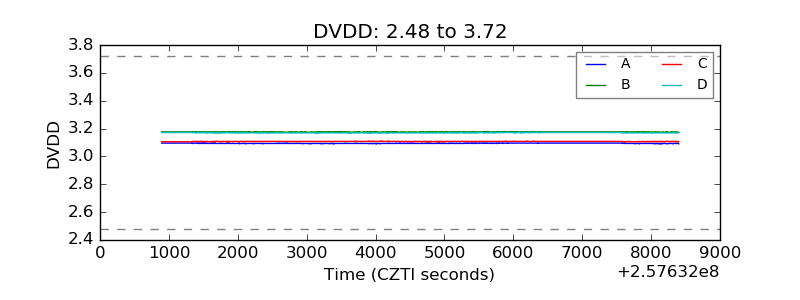 |
| Temperature 1 | 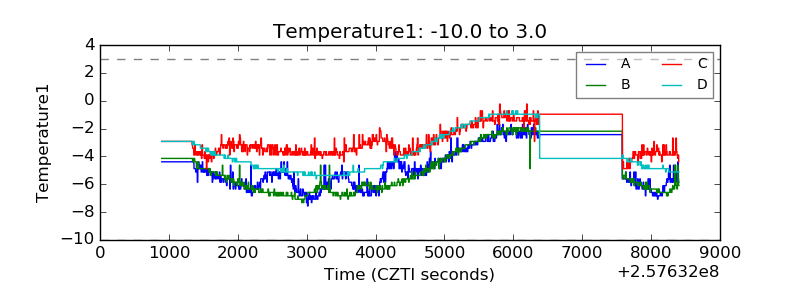 |
| Veto HV Monitor | 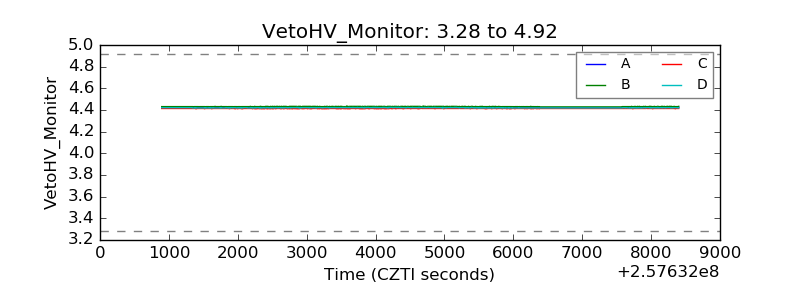 |
| Veto LLD | 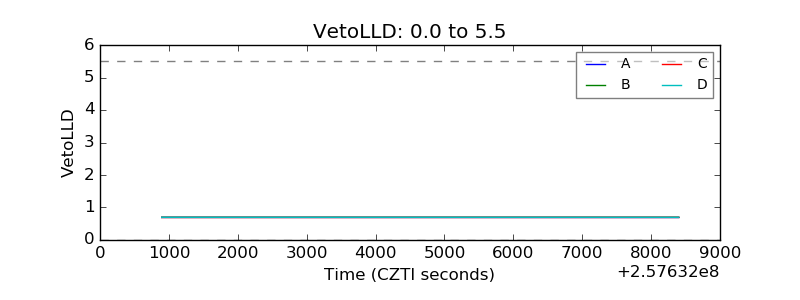 |
| Alpha Counter | 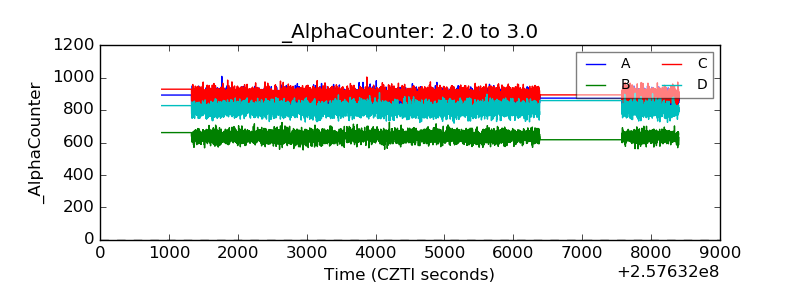 |
| _CPM_Rate | 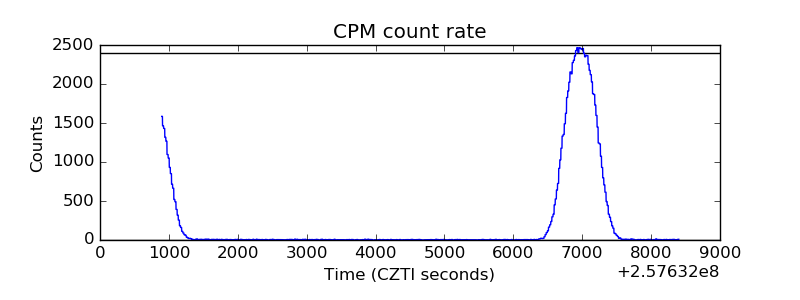 |
| CZT Counter | 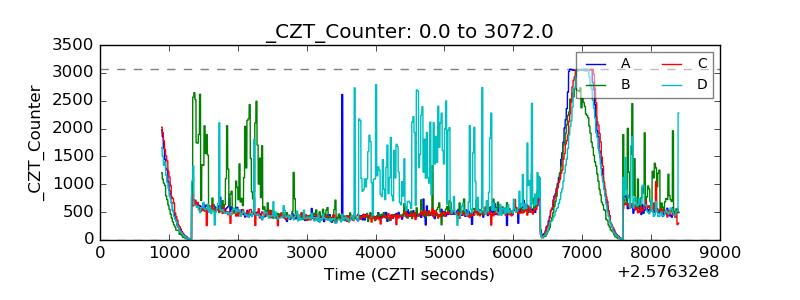 |
| +2.5 Volts monitor |  |
| +5 Volts monitor |  |
| _ROLL_ROT | 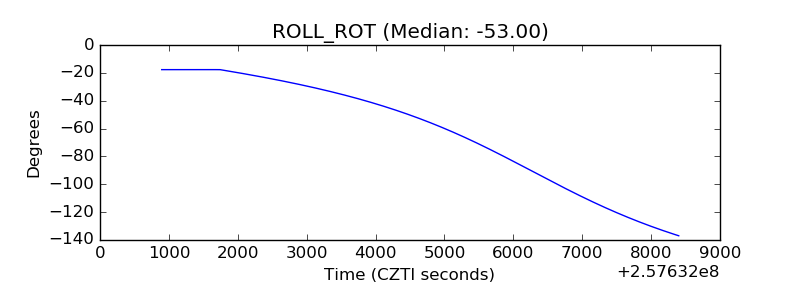 |
| _Roll_DEC | 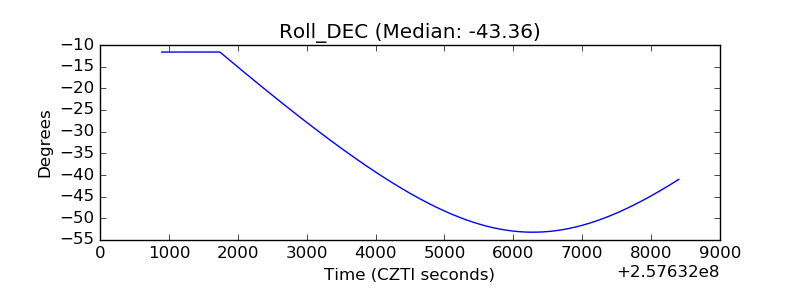 |
| _Roll_RA | 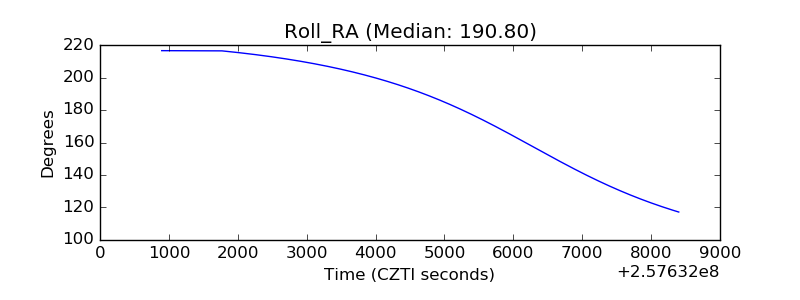 |
| Veto Counter | 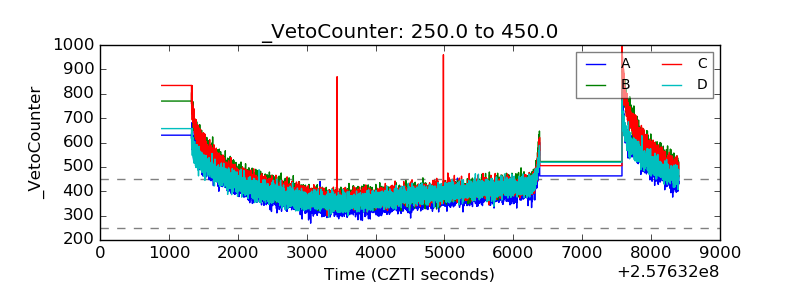 |