| Param | Original file | Final file |
|---|---|---|
| Filename | modeM0/AS1G08_037T01_9000001928cztM0_level2.fits | modeM0/AS1G08_037T01_9000001928cztM0_level2_quad_clean.evt |
| Size (bytes) | 294,865,920 | 300,366,720 |
| Size | 281.2 MB | 286.5 MB |
| Events in quadrant A | 1,815,430 | 1,887,152 |
| Events in quadrant B | 1,516,038 | 1,581,171 |
| Events in quadrant C | 1,804,340 | 1,786,592 |
| Events in quadrant D | 1,537,554 | 1,588,623 |
| Mode SS | |||
|---|---|---|---|
| Quadrant | BADHDUFLAG | Total packets | Discarded packets |
| A | 0 | 668 | 0 |
| B | 0 | 668 | 0 |
| C | 0 | 668 | 0 |
| D | 0 | 668 | 0 |
| Mode M9 | |||
|---|---|---|---|
| Quadrant | BADHDUFLAG | Total packets | Discarded packets |
| A | 0 | 35 | 0 |
| B | 0 | 35 | 0 |
| C | 0 | 35 | 0 |
| D | 0 | 35 | 0 |
| Mode M0 | |||
|---|---|---|---|
| Quadrant | BADHDUFLAG | Total packets | Discarded packets |
| A | 0 | 71502 | 0 |
| B | 0 | 113848 | 0 |
| C | 0 | 70261 | 0 |
| D | 0 | 81605 | 0 |
| Quadrant | Total seconds | Saturated seconds | Saturation percentage |
|---|---|---|---|
| A | 32783 | 649 | 1.979685% |
| B | 32783 | 7378 | 22.505567% |
| C | 32783 | 485 | 1.479425% |
| D | 32783 | 1359 | 4.145441% |
Noise dominated data is calculated using 1-second bins in cleaned event files. If a bin has >2000 counts, and if more than 50% of those come from <1% of pixels, then it is considered to be noise-dominated and hence unusable.
| Quadrant | # 1 sec bins | Bins with >0 counts | Bins with >2000 counts | High rate bins dominated by noise | Noise dominated (total time) | Noise dominated (detector-on time) | Marked lightcurve |
|---|---|---|---|---|---|---|---|
| A | 41501 | 32774 | 0 | 0 | 0.00% | 0.00% | 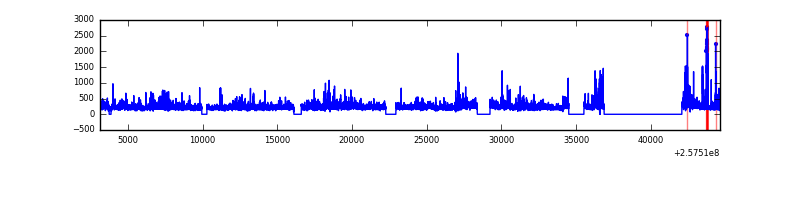 |
| B | 41501 | 31621 | 0 | 0 | 0.00% | 0.00% |  |
| C | 41501 | 32783 | 0 | 0 | 0.00% | 0.00% |  |
| D | 41501 | 32738 | 0 | 0 | 0.00% | 0.00% | 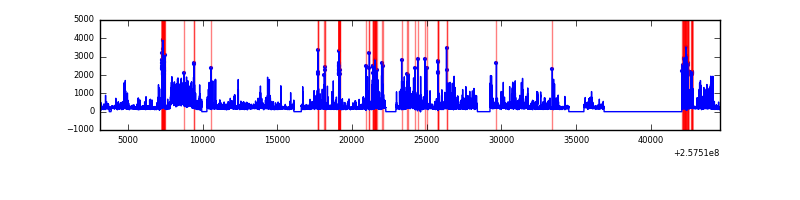 |
Top three noisy pixels from each quadrant. If the there are fewer than three noisy pixels in the level2.evt file, extra rows are filled as -1
| Pixel properties | Quadrant properties | ||||||
|---|---|---|---|---|---|---|---|
| Quadrant | DetID | PixID | Counts | Sigma | Mean | Median | Sigma |
| A | 0 | 29 | 1854 | 12.05 | 471 | 440 | 117.3 |
| A | 14 | 188 | 1819 | 11.76 | 471 | 440 | 117.3 |
| A | 14 | 204 | 1590 | 9.8 | 471 | 440 | 117.3 |
| B | 2 | 9 | 1368 | 12.13 | 399 | 379 | 81.5 |
| B | 3 | 17 | 1057 | 8.32 | 399 | 379 | 81.5 |
| B | 14 | 254 | 1034 | 8.04 | 399 | 379 | 81.5 |
| C | 12 | 241 | 1264 | 6.62 | 476 | 442 | 124.2 |
| C | 3 | 126 | 1257 | 6.56 | 476 | 442 | 124.2 |
| C | 3 | 158 | 1204 | 6.14 | 476 | 442 | 124.2 |
| D | 3 | 14 | 1145 | 6.26 | 439 | 397 | 119.5 |
| D | 6 | 231 | 1131 | 6.14 | 439 | 397 | 119.5 |
| D | 3 | 31 | 1130 | 6.13 | 439 | 397 | 119.5 |
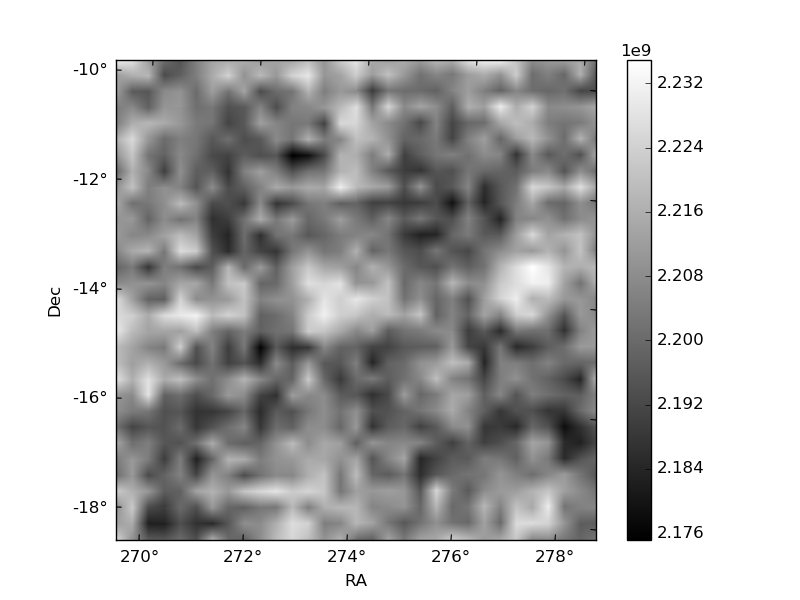
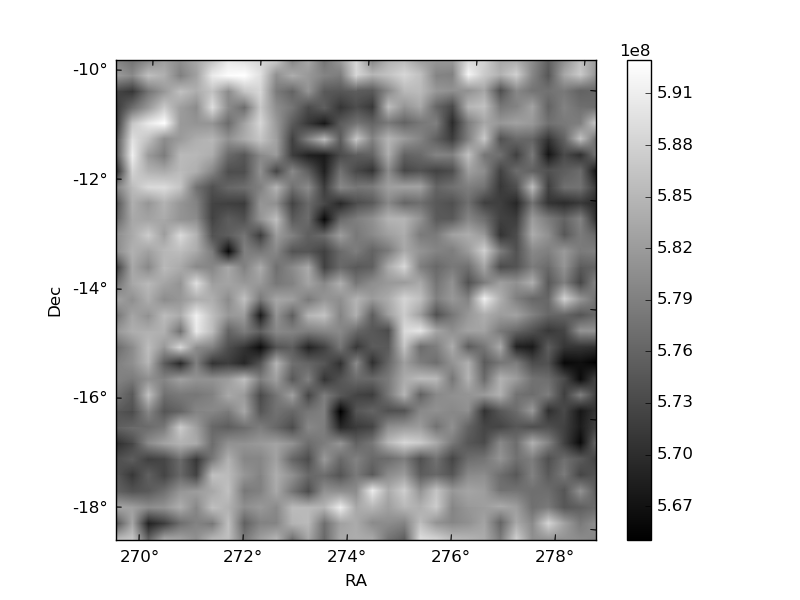
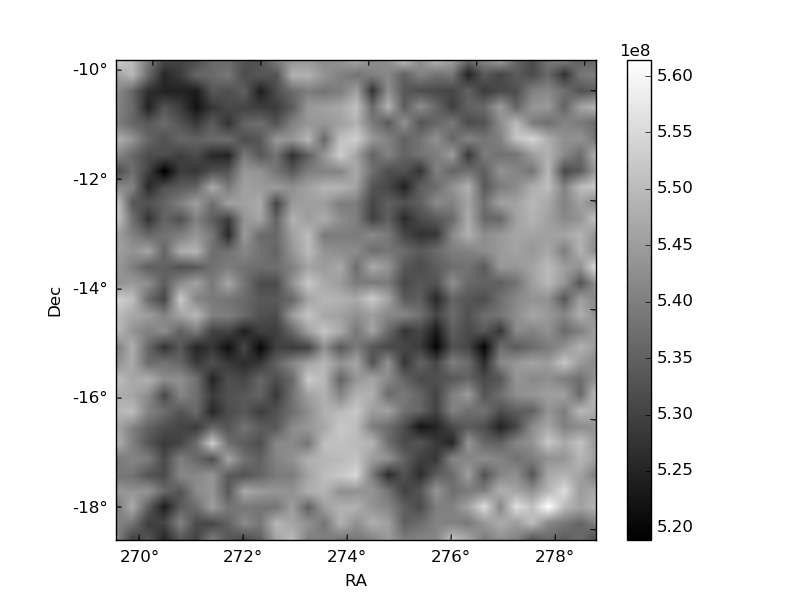
Histogram calculated using DETX and DETY for each event in the final _common_clean file
| Quadrant A | 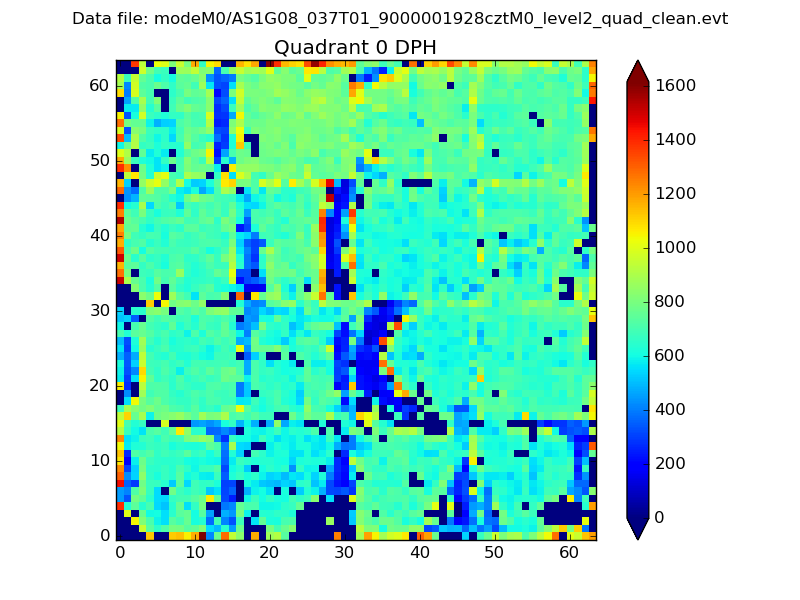 |
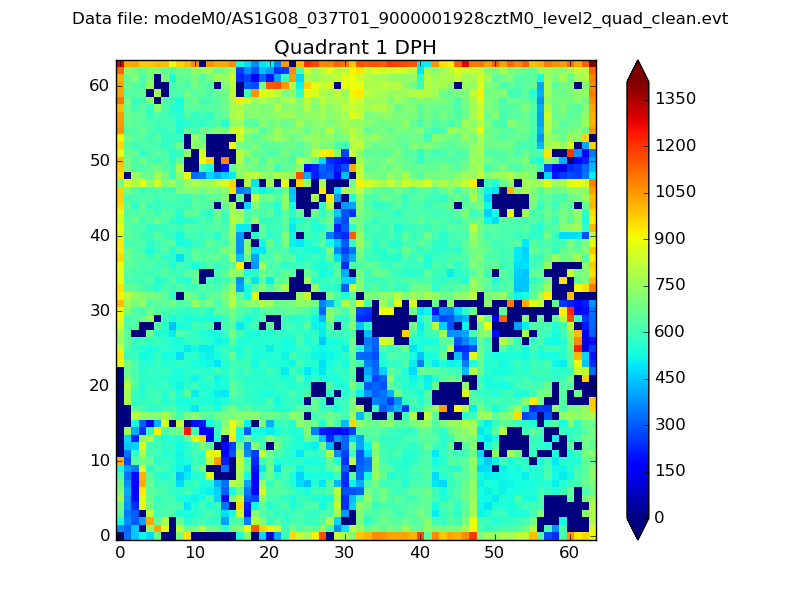 |
Quadrant B |
|---|---|---|---|
| Quadrant D |  |
 |
Quadrant C |
| Plot type | Count rate plots | Images |
|---|---|---|
| Comparison with Poisson distribution Blue bars denote a histogram of data divided into 1 sec bins. Red curve is a Poisson curve with rate = median count rate of data. |
 |
 |
| Quadrant-wise count rates Data is divided into 100 sec bins |
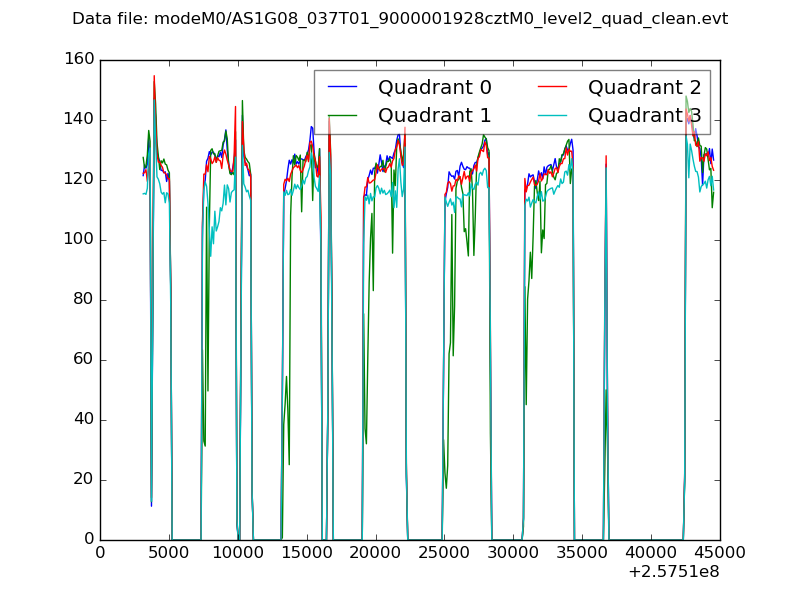 |
|
| Module-wise count rates for Quadrant A Data is divided into 100 sec bins |
 |
 |
| Module-wise count rates for Quadrant B Data is divided into 100 sec bins |
 |
 |
| Module-wise count rates for Quadrant C Data is divided into 100 sec bins |
 |
 |
| Module-wise count rates for Quadrant D Data is divided into 100 sec bins |
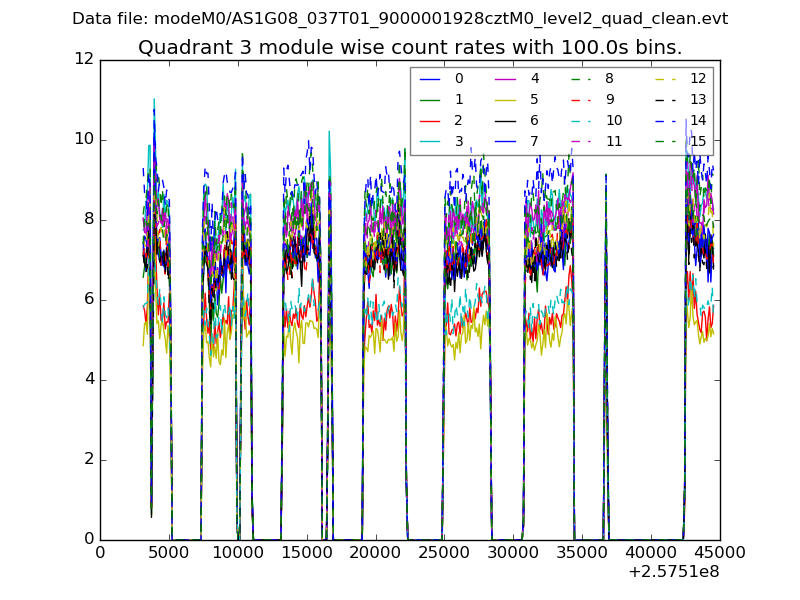 |
 |
| Parameter | Plot |
|---|---|
| CZT HV Monitor |  |
| D_VDD |  |
| Temperature 1 |  |
| Veto HV Monitor |  |
| Veto LLD |  |
| Alpha Counter |  |
| _CPM_Rate |  |
| CZT Counter |  |
| +2.5 Volts monitor |  |
| +5 Volts monitor |  |
| _ROLL_ROT |  |
| _Roll_DEC |  |
| _Roll_RA | 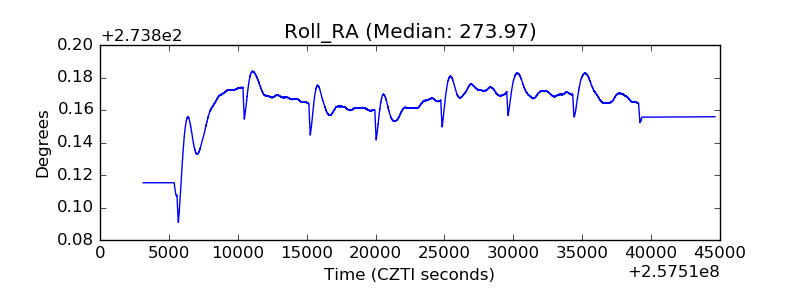 |
| Veto Counter |  |