| Param | Original file | Final file |
|---|---|---|
| Filename | modeM0/AS1G08_037T01_9000001928_13093cztM0_level2.evt | modeM0/AS1G08_037T01_9000001928_13093cztM0_level2_quad_clean.evt |
| Size (bytes) | 2,197,702,080 | 292,792,320 |
| Size | 2.0 GB | 279.2 MB |
| Events in quadrant A | 12,827,609 | 1,871,093 |
| Events in quadrant B | 23,818,413 | 1,681,107 |
| Events in quadrant C | 12,565,989 | 1,856,418 |
| Events in quadrant D | 15,657,000 | 1,735,785 |
| Mode SS | |||
|---|---|---|---|
| Quadrant | BADHDUFLAG | Total packets | Discarded packets |
| A | 0 | 510 | 0 |
| B | 0 | 510 | 0 |
| C | 0 | 510 | 0 |
| D | 0 | 510 | 0 |
| Mode M9 | |||
|---|---|---|---|
| Quadrant | BADHDUFLAG | Total packets | Discarded packets |
| A | 0 | 25 | 0 |
| B | 0 | 25 | 0 |
| C | 0 | 25 | 0 |
| D | 0 | 25 | 0 |
| Mode M0 | |||
|---|---|---|---|
| Quadrant | BADHDUFLAG | Total packets | Discarded packets |
| A | 0 | 53564 | 6 |
| B | 0 | 87166 | 5 |
| C | 0 | 54185 | 5 |
| D | 0 | 63341 | 5 |
| Quadrant | Total seconds | Saturated seconds | Saturation percentage |
|---|---|---|---|
| A | 25026 | 508 | 2.029889% |
| B | 25026 | 6001 | 23.979062% |
| C | 25026 | 458 | 1.830097% |
| D | 25026 | 1214 | 4.850955% |
Noise dominated data is calculated using 1-second bins in cleaned event files. If a bin has >2000 counts, and if more than 50% of those come from <1% of pixels, then it is considered to be noise-dominated and hence unusable.
| Quadrant | # 1 sec bins | Bins with >0 counts | Bins with >2000 counts | High rate bins dominated by noise | Noise dominated (total time) | Noise dominated (detector-on time) | Marked lightcurve |
|---|---|---|---|---|---|---|---|
| A | 27522 | 25032 | 3 | 3 | 0.01% | 0.01% | 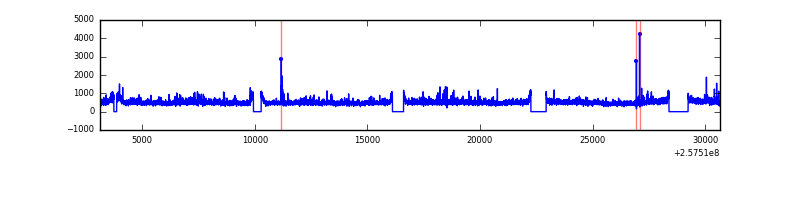 |
| B | 27522 | 25032 | 3408 | 3408 | 12.38% | 13.61% | 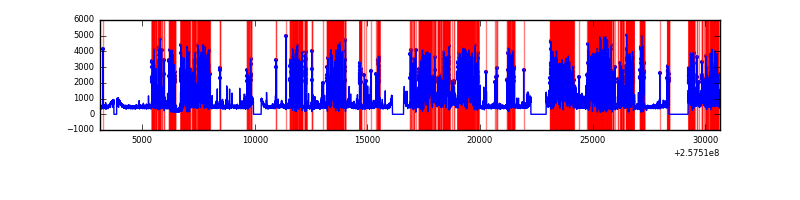 |
| C | 27522 | 25032 | 78 | 78 | 0.28% | 0.31% | 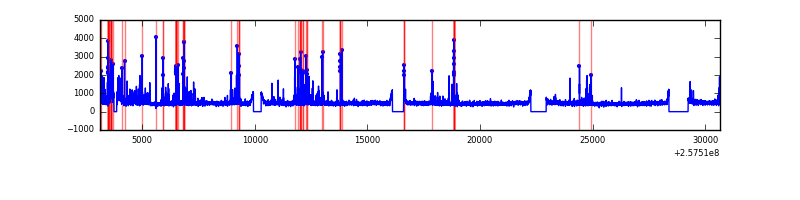 |
| D | 27522 | 25032 | 640 | 640 | 2.33% | 2.56% | 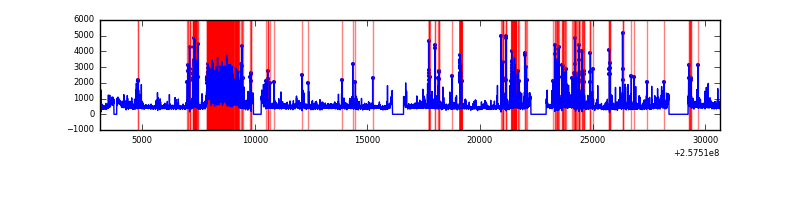 |
Top three noisy pixels from each quadrant. If the there are fewer than three noisy pixels in the level2.evt file, extra rows are filled as -1
| Pixel properties | Quadrant properties | ||||||
|---|---|---|---|---|---|---|---|
| Quadrant | DetID | PixID | Counts | Sigma | Mean | Median | Sigma |
| A | 12 | 189 | 548807 | 888.31 | 3013 | 2945 | 614.5 |
| A | 8 | 15 | 401112 | 647.96 | 3013 | 2945 | 614.5 |
| A | 0 | 23 | 107677 | 170.44 | 3013 | 2945 | 614.5 |
| B | 4 | 239 | 9411224 | 18953.19 | 2608 | 2540 | 496.4 |
| B | 0 | 85 | 2890303 | 5817.21 | 2608 | 2540 | 496.4 |
| B | 3 | 64 | 525952 | 1054.38 | 2608 | 2540 | 496.4 |
| C | 15 | 208 | 1079256 | 1580.81 | 2934 | 2947 | 680.9 |
| C | 13 | 61 | 21176 | 26.77 | 2934 | 2947 | 680.9 |
| C | 14 | 234 | 20431 | 25.68 | 2934 | 2947 | 680.9 |
| D | 1 | 52 | 3024134 | 4317.63 | 2901 | 2826 | 699.8 |
| D | 14 | 34 | 1224346 | 1745.62 | 2901 | 2826 | 699.8 |
| D | 8 | 195 | 252327 | 356.55 | 2901 | 2826 | 699.8 |
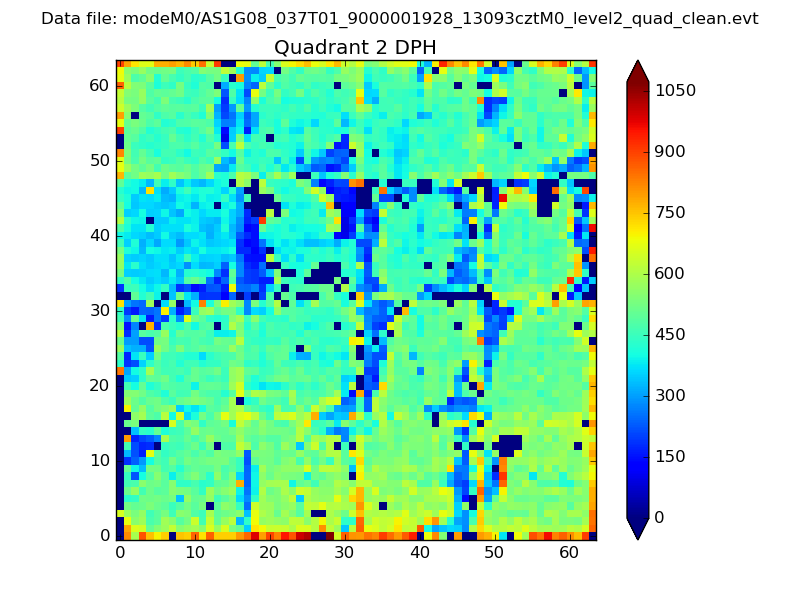
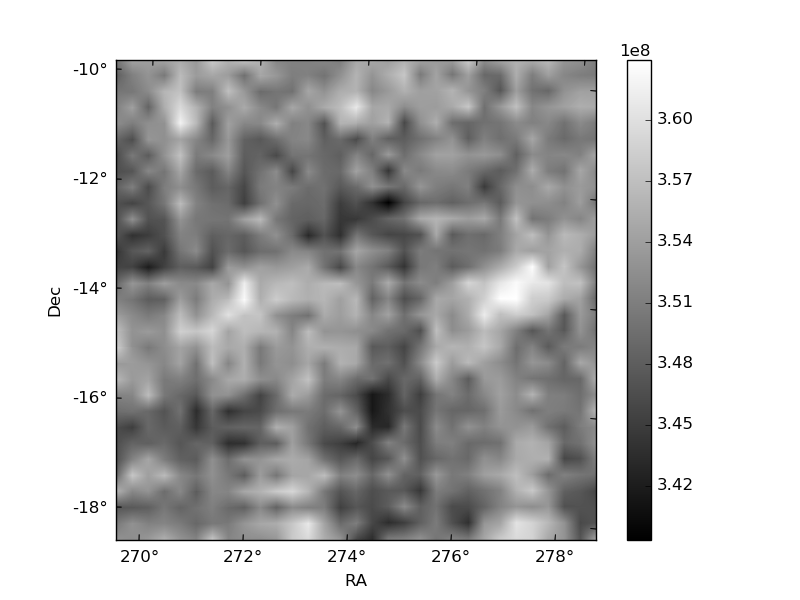
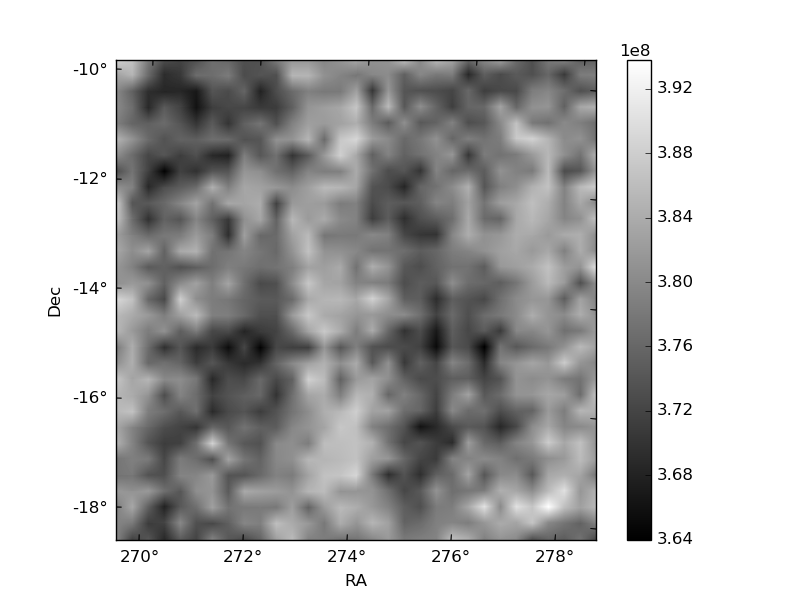
Histogram calculated using DETX and DETY for each event in the final _common_clean file
| Quadrant A | 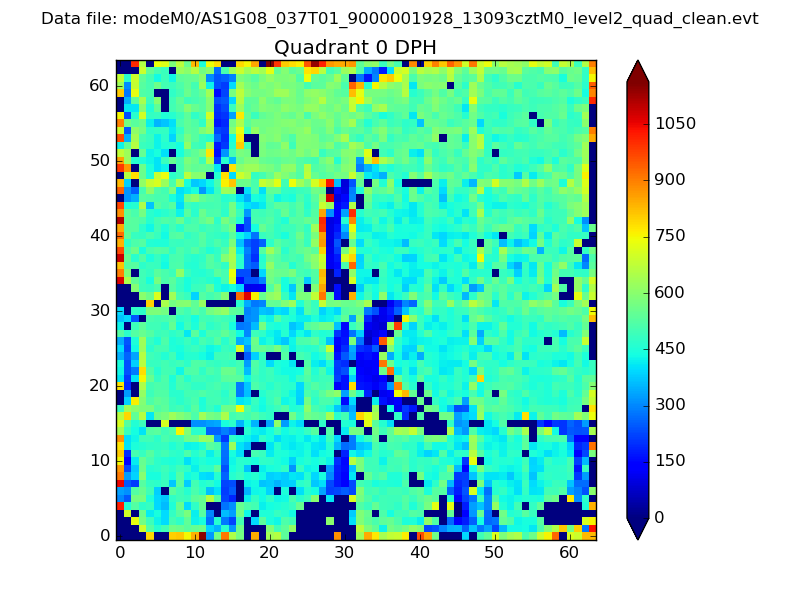 |
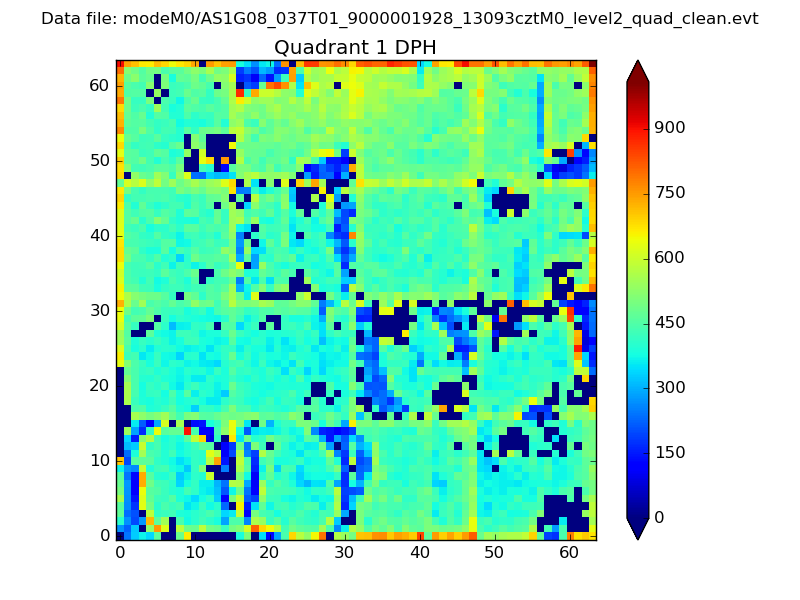 |
Quadrant B |
|---|---|---|---|
| Quadrant D | 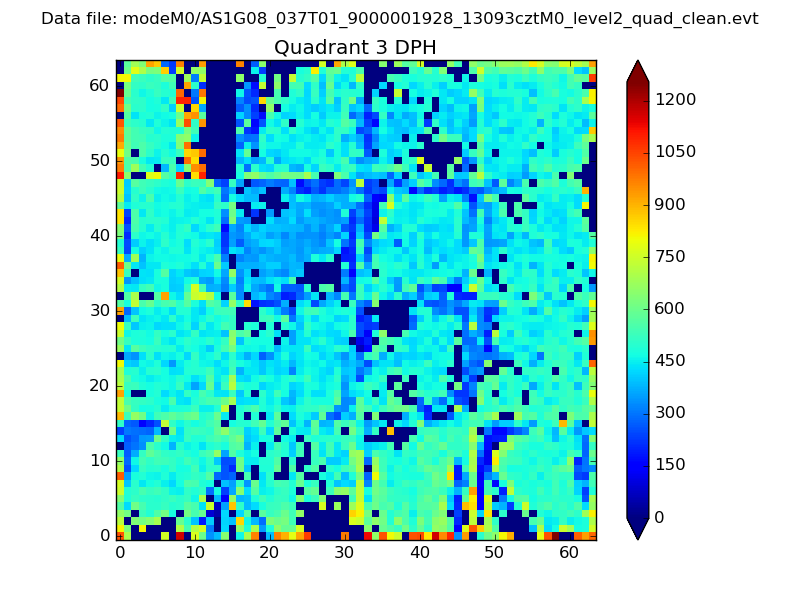 |
 |
Quadrant C |
| Plot type | Count rate plots | Images |
|---|---|---|
| Comparison with Poisson distribution Blue bars denote a histogram of data divided into 1 sec bins. Red curve is a Poisson curve with rate = median count rate of data. |
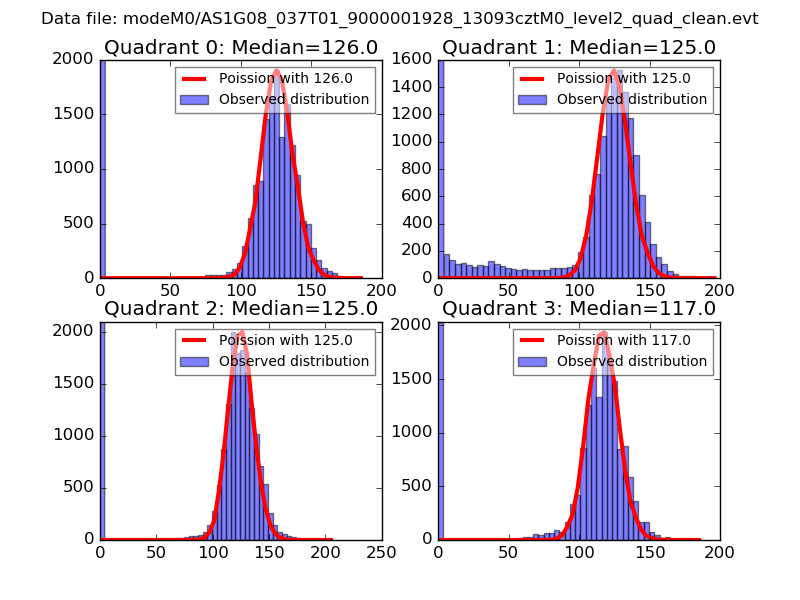 |
 |
| Quadrant-wise count rates Data is divided into 100 sec bins |
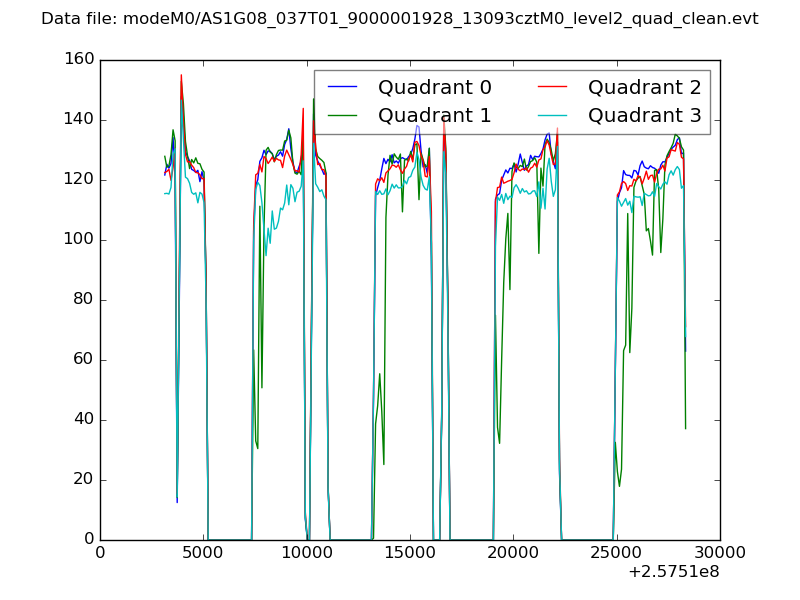 |
|
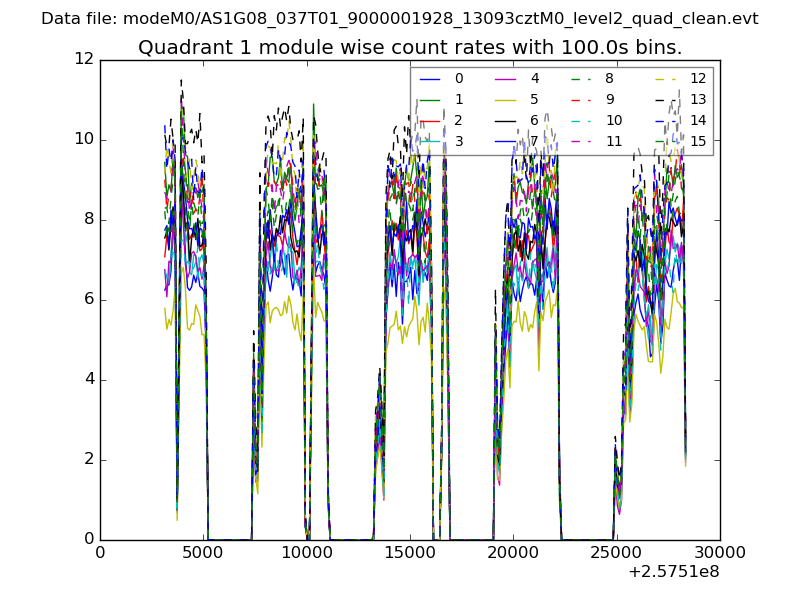
| Module-wise count rates for Quadrant A Data is divided into 100 sec bins |
 |
 |
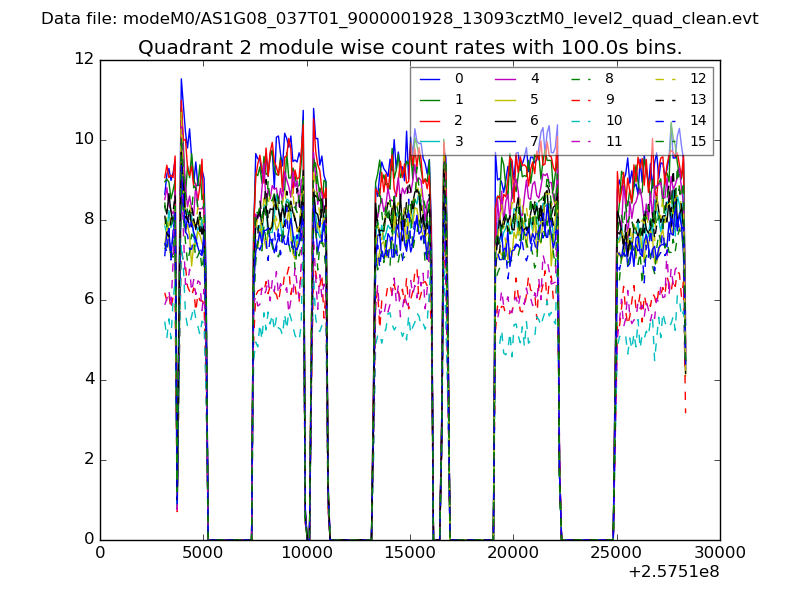
| Module-wise count rates for Quadrant B Data is divided into 100 sec bins |
 |
 |
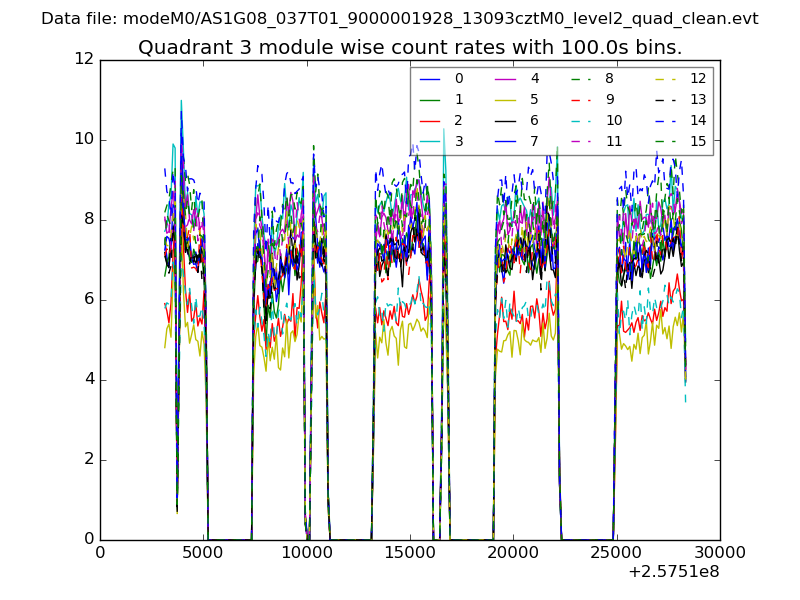
| Module-wise count rates for Quadrant C Data is divided into 100 sec bins |
 |
 |
| Module-wise count rates for Quadrant D Data is divided into 100 sec bins |
 |
 |
| Parameter | Plot |
|---|---|
| CZT HV Monitor |  |
| D_VDD | 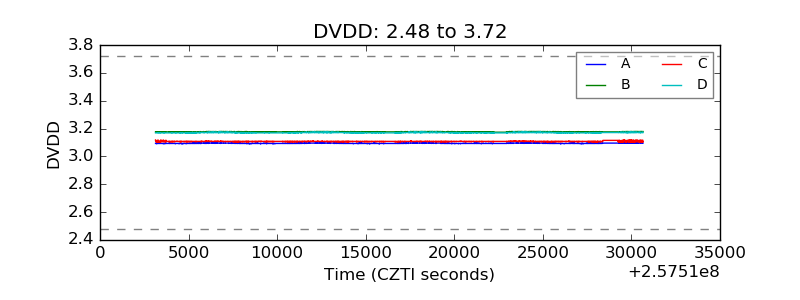 |
| Temperature 1 | 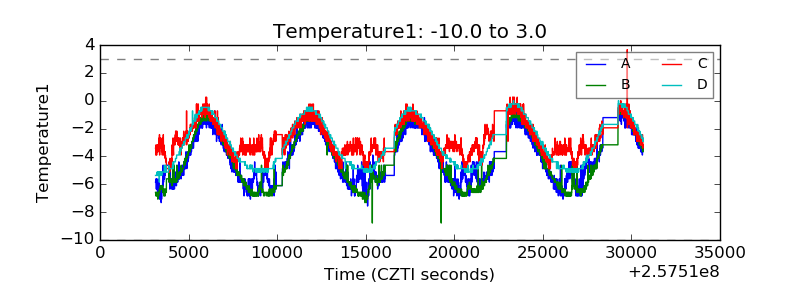 |
| Veto HV Monitor | 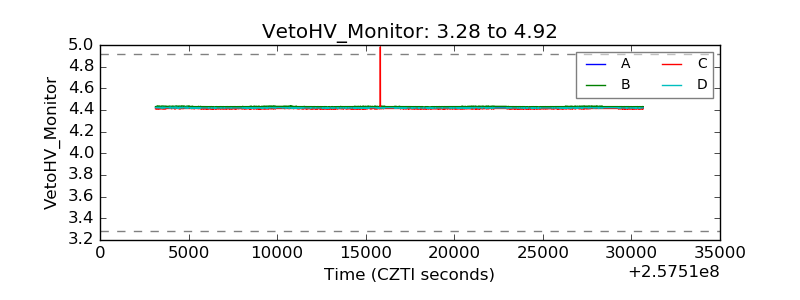 |
| Veto LLD | 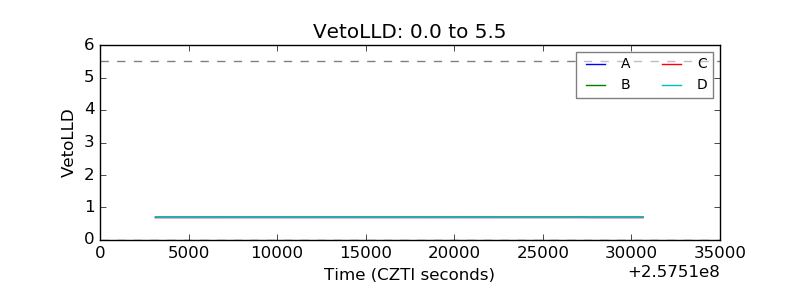 |
| Alpha Counter | 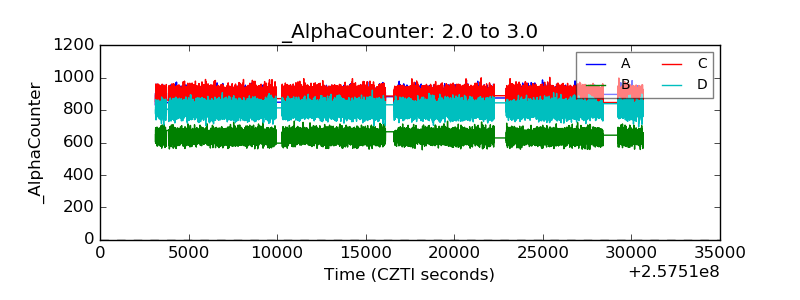 |
| _CPM_Rate | 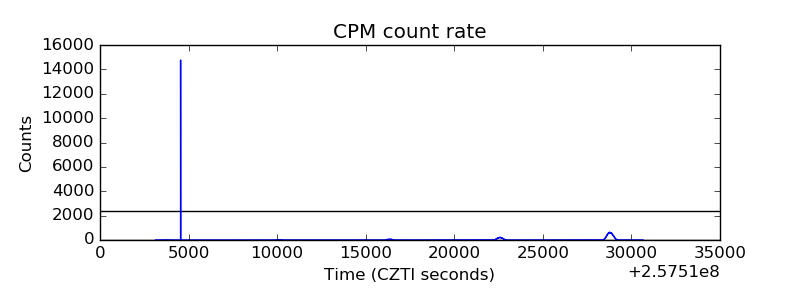 |
| CZT Counter | 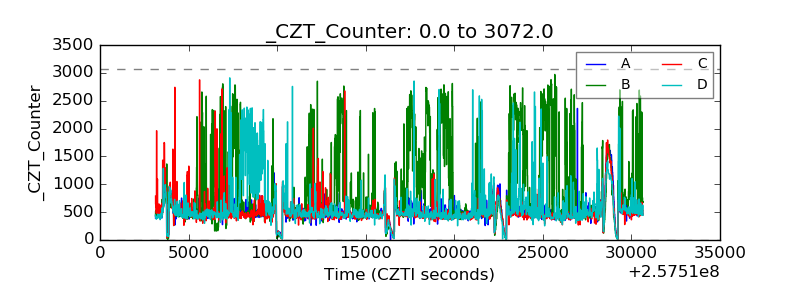 |
| +2.5 Volts monitor |  |
| +5 Volts monitor |  |
| _ROLL_ROT | 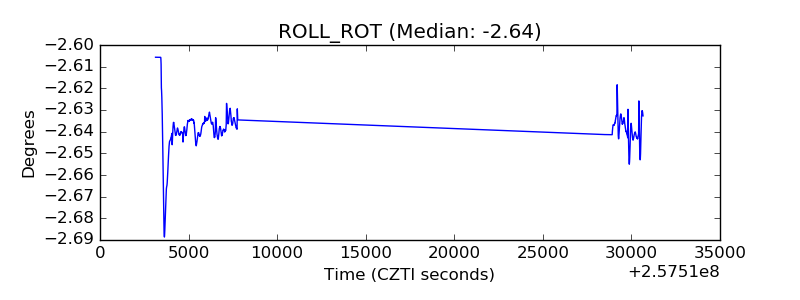 |
| _Roll_DEC | 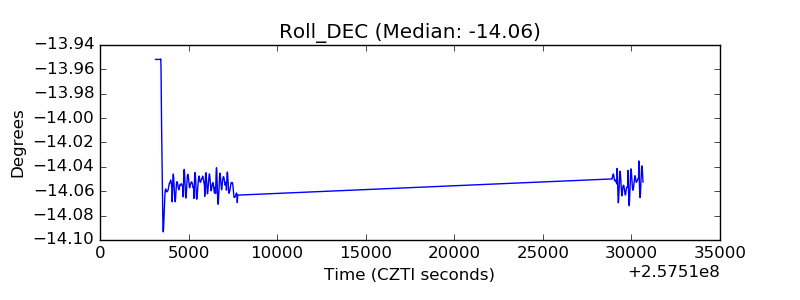 |
| _Roll_RA | 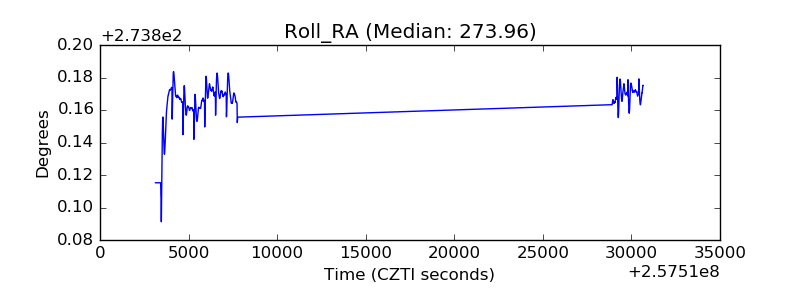 |
| Veto Counter | 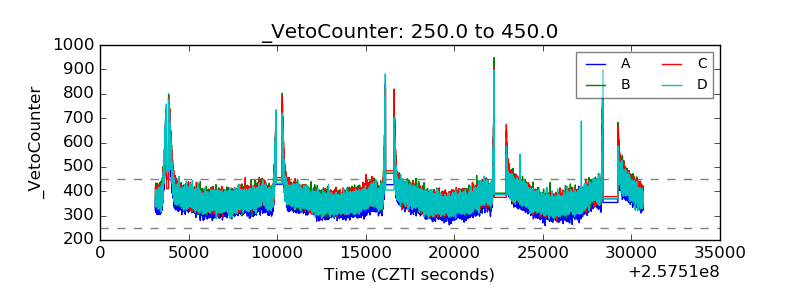 |