| Param | Original file | Final file |
|---|---|---|
| Filename | modeM0/AS1G08_037T01_9000001928_13094cztM0_level2.evt | modeM0/AS1G08_037T01_9000001928_13094cztM0_level2_quad_clean.evt |
| Size (bytes) | 543,651,840 | 74,260,800 |
| Size | 518.5 MB | 70.8 MB |
| Events in quadrant A | 3,374,228 | 474,120 |
| Events in quadrant B | 6,483,033 | 420,444 |
| Events in quadrant C | 2,960,981 | 468,782 |
| Events in quadrant D | 3,222,803 | 449,274 |
| Mode SS | |||
|---|---|---|---|
| Quadrant | BADHDUFLAG | Total packets | Discarded packets |
| A | 0 | 126 | 0 |
| B | 0 | 126 | 0 |
| C | 0 | 126 | 0 |
| D | 0 | 126 | 0 |
| Mode M9 | |||
|---|---|---|---|
| Quadrant | BADHDUFLAG | Total packets | Discarded packets |
| A | 0 | 10 | 0 |
| B | 0 | 10 | 0 |
| C | 0 | 10 | 0 |
| D | 0 | 10 | 0 |
| Mode M0 | |||
|---|---|---|---|
| Quadrant | BADHDUFLAG | Total packets | Discarded packets |
| A | 0 | 14012 | 2 |
| B | 0 | 23512 | 1 |
| C | 0 | 12929 | 1 |
| D | 0 | 13760 | 1 |
| Quadrant | Total seconds | Saturated seconds | Saturation percentage |
|---|---|---|---|
| A | 6245 | 83 | 1.329063% |
| B | 6245 | 1368 | 21.905524% |
| C | 6245 | 24 | 0.384307% |
| D | 6245 | 26 | 0.416333% |
Noise dominated data is calculated using 1-second bins in cleaned event files. If a bin has >2000 counts, and if more than 50% of those come from <1% of pixels, then it is considered to be noise-dominated and hence unusable.
| Quadrant | # 1 sec bins | Bins with >0 counts | Bins with >2000 counts | High rate bins dominated by noise | Noise dominated (total time) | Noise dominated (detector-on time) | Marked lightcurve |
|---|---|---|---|---|---|---|---|
| A | 7261 | 6247 | 35 | 35 | 0.48% | 0.56% | 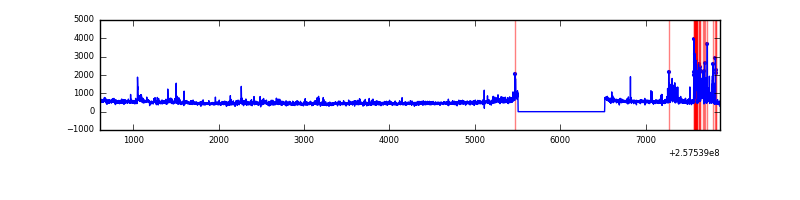 |
| B | 7261 | 6247 | 922 | 922 | 12.70% | 14.76% | 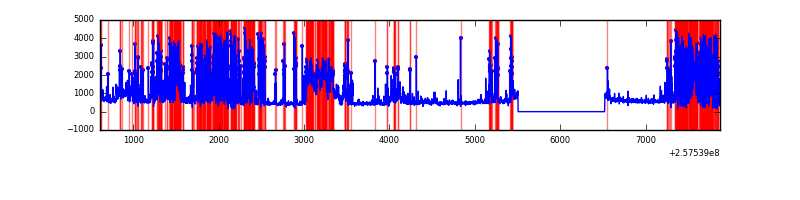 |
| C | 7261 | 6247 | 7 | 7 | 0.10% | 0.11% | 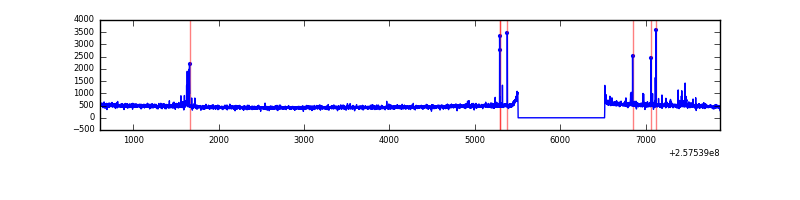 |
| D | 7261 | 6247 | 14 | 14 | 0.19% | 0.22% | 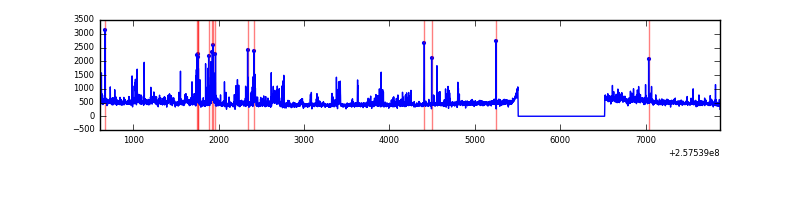 |
Top three noisy pixels from each quadrant. If the there are fewer than three noisy pixels in the level2.evt file, extra rows are filled as -1
| Pixel properties | Quadrant properties | ||||||
|---|---|---|---|---|---|---|---|
| Quadrant | DetID | PixID | Counts | Sigma | Mean | Median | Sigma |
| A | 15 | 223 | 169344 | 1100.23 | 749 | 733 | 153.3 |
| A | 12 | 189 | 146489 | 951.09 | 749 | 733 | 153.3 |
| A | 15 | 239 | 74563 | 481.76 | 749 | 733 | 153.3 |
| B | 4 | 239 | 2823386 | 22019.06 | 674 | 657 | 128.2 |
| B | 0 | 85 | 740081 | 5767.97 | 674 | 657 | 128.2 |
| B | 0 | 219 | 127848 | 992.17 | 674 | 657 | 128.2 |
| C | 15 | 208 | 57005 | 328.86 | 732 | 736 | 171.1 |
| C | 8 | 112 | 17939 | 100.54 | 732 | 736 | 171.1 |
| C | 14 | 234 | 13254 | 73.16 | 732 | 736 | 171.1 |
| D | 8 | 195 | 165560 | 930.15 | 728 | 708 | 177.2 |
| D | 14 | 34 | 138060 | 774.99 | 728 | 708 | 177.2 |
| D | 1 | 52 | 123800 | 694.53 | 728 | 708 | 177.2 |
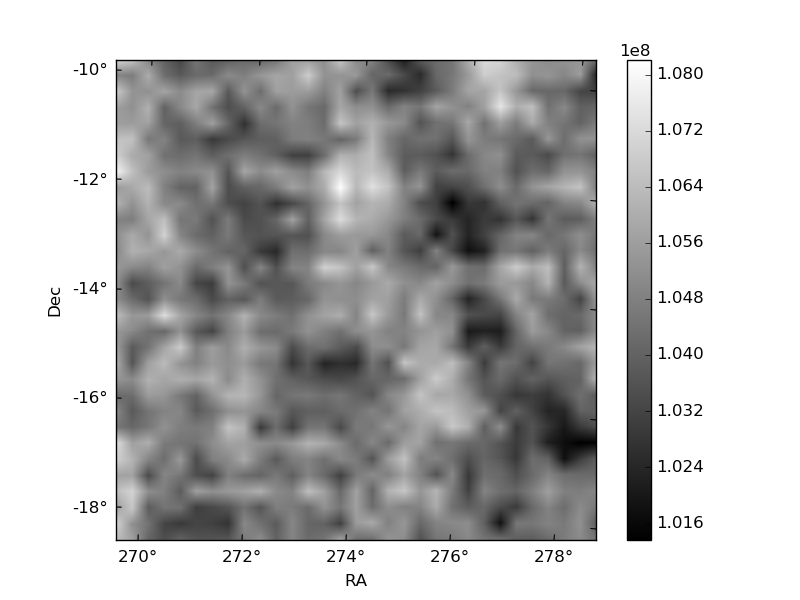
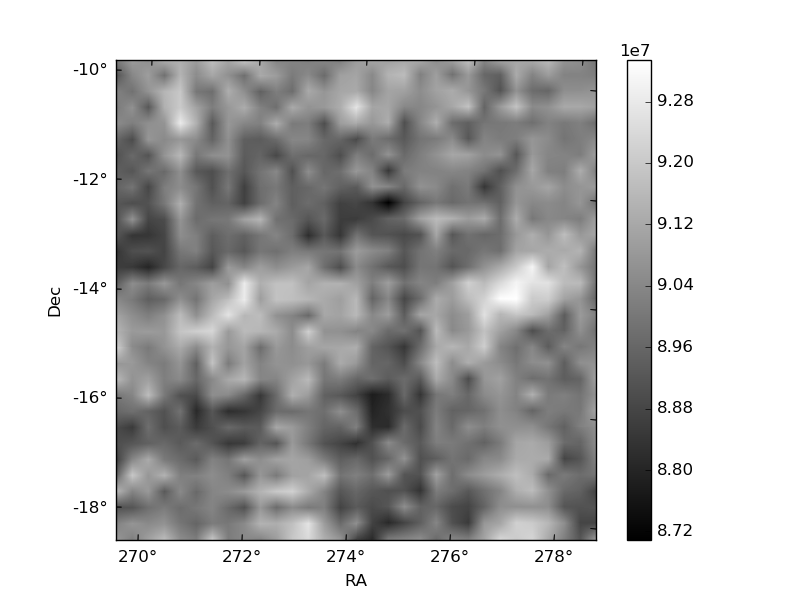
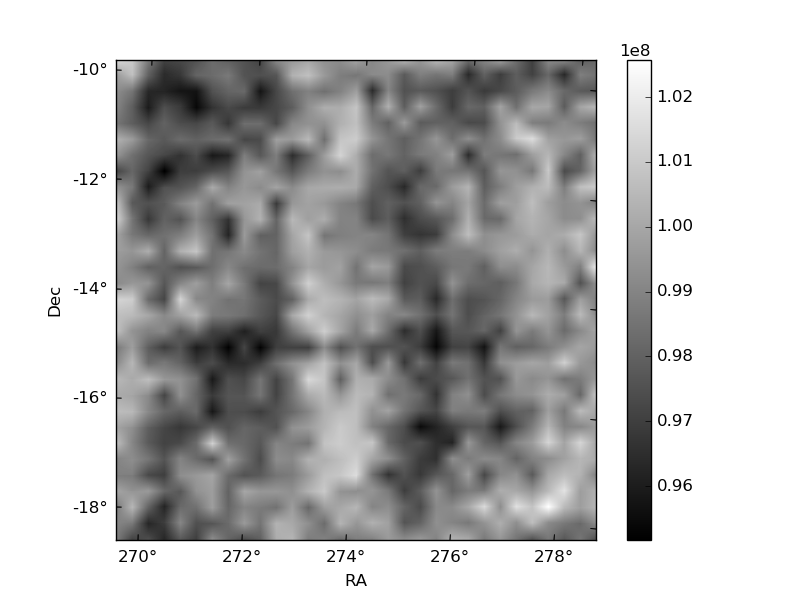
Histogram calculated using DETX and DETY for each event in the final _common_clean file
| Quadrant A | 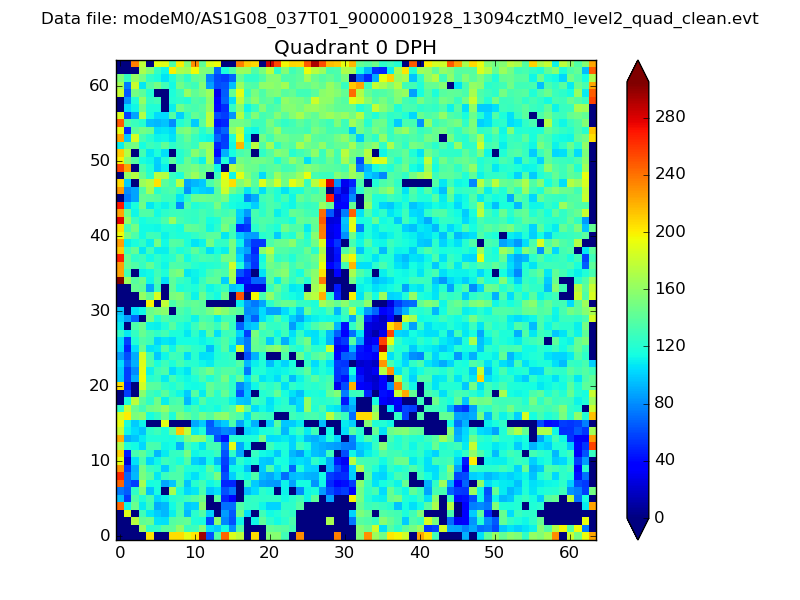 |
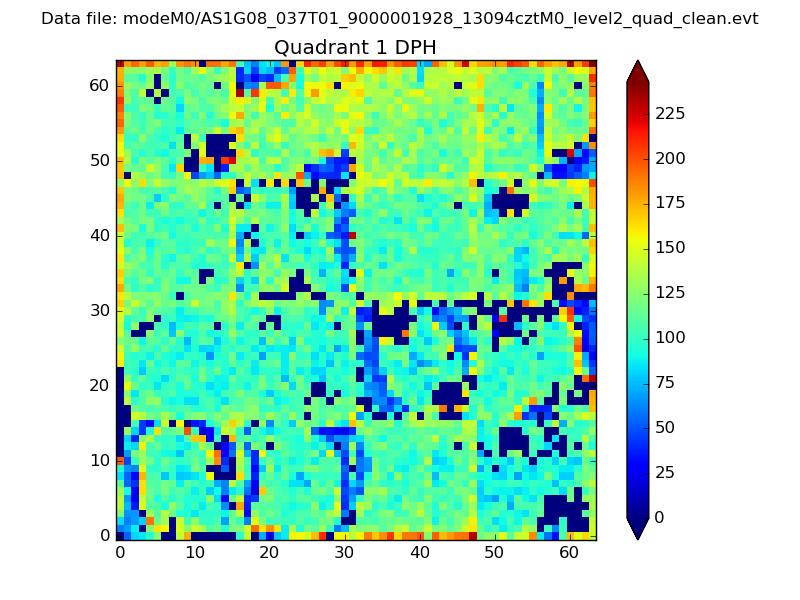 |
Quadrant B |
|---|---|---|---|
| Quadrant D | 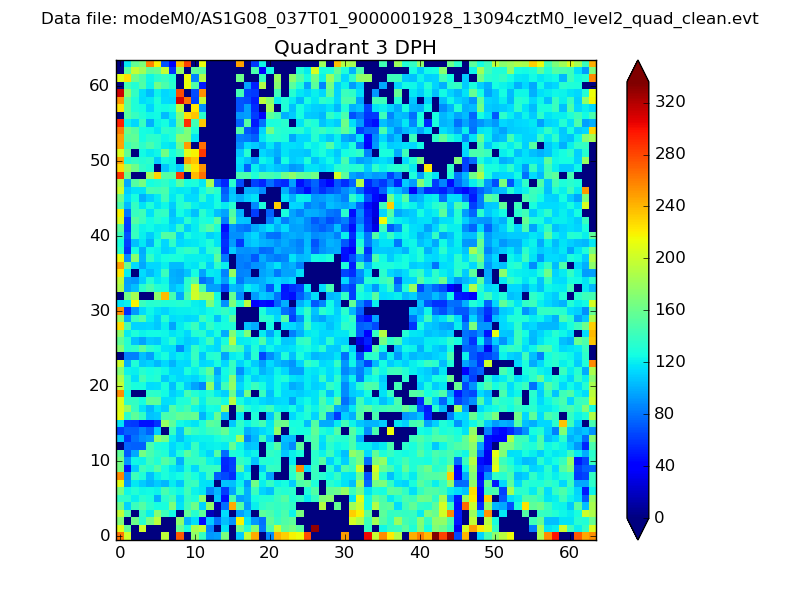 |
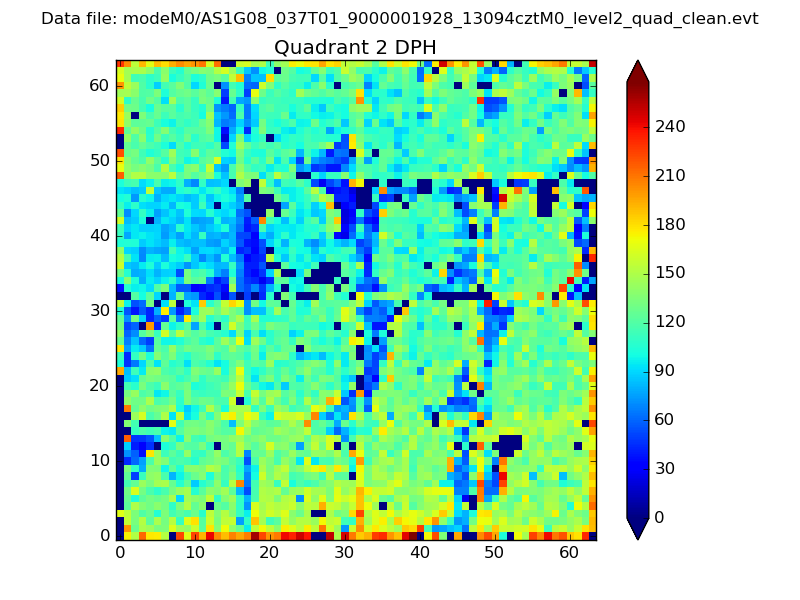 |
Quadrant C |
| Plot type | Count rate plots | Images |
|---|---|---|
| Comparison with Poisson distribution Blue bars denote a histogram of data divided into 1 sec bins. Red curve is a Poisson curve with rate = median count rate of data. |
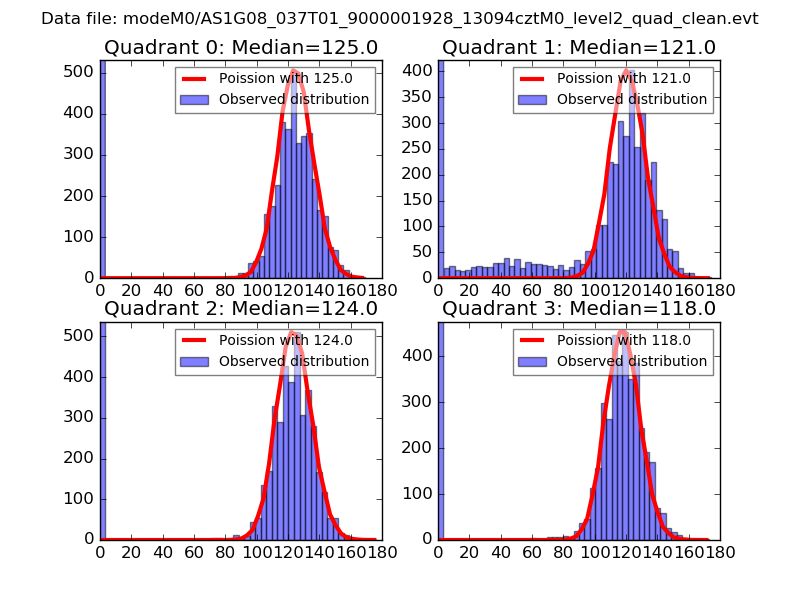 |
 |
| Quadrant-wise count rates Data is divided into 100 sec bins |
 |
|
| Module-wise count rates for Quadrant A Data is divided into 100 sec bins |
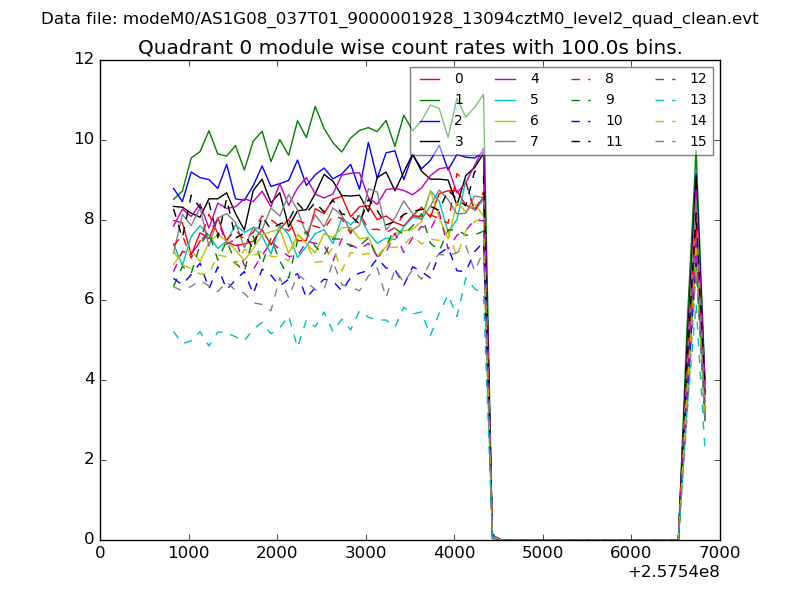 |
 |
| Module-wise count rates for Quadrant B Data is divided into 100 sec bins |
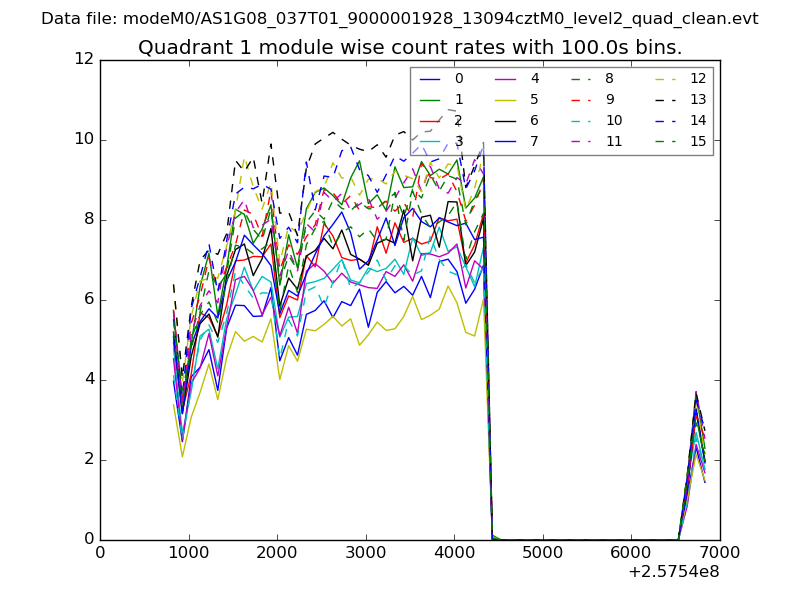 |
 |
| Module-wise count rates for Quadrant C Data is divided into 100 sec bins |
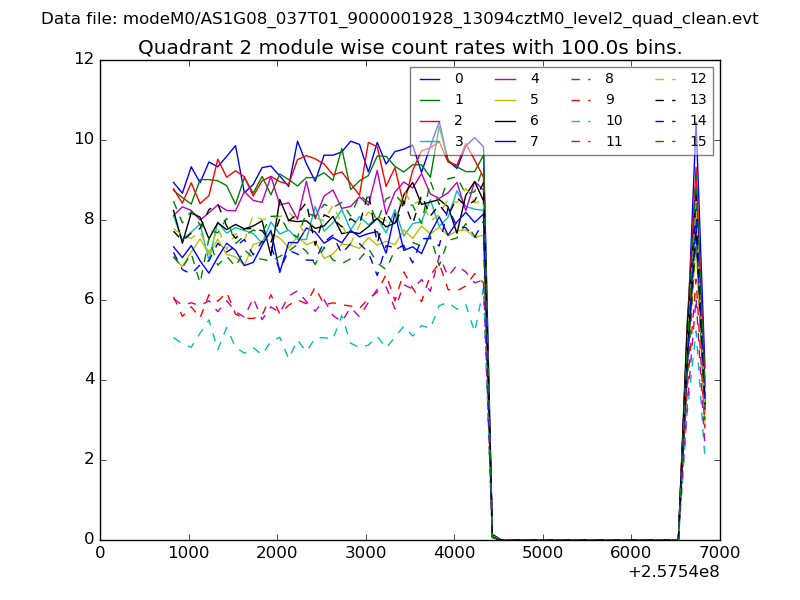 |
 |
| Module-wise count rates for Quadrant D Data is divided into 100 sec bins |
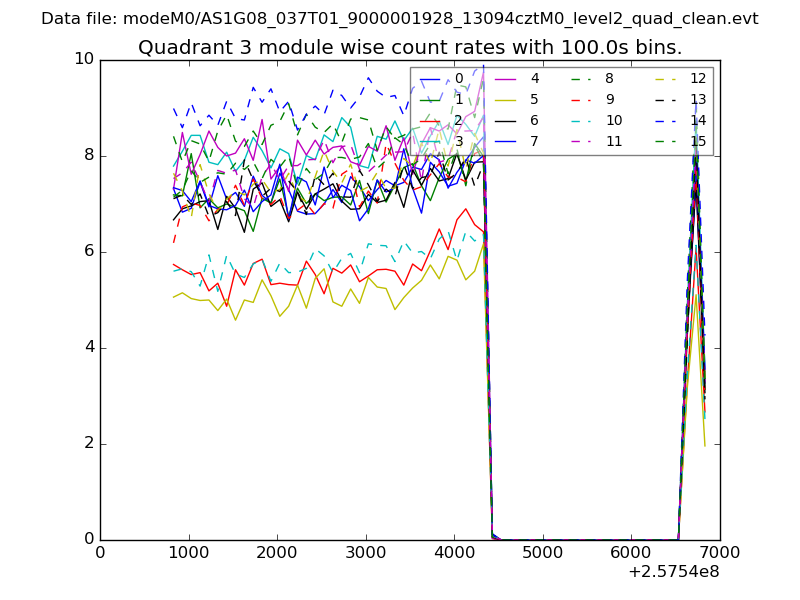 |
 |
| Parameter | Plot |
|---|---|
| CZT HV Monitor | 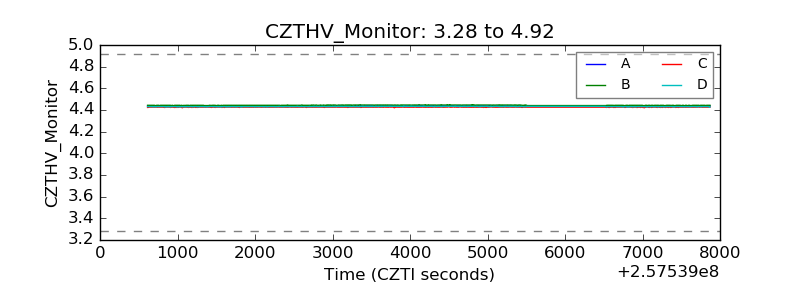 |
| D_VDD | 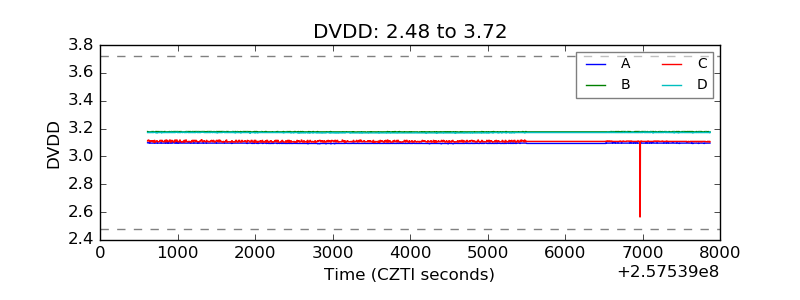 |
| Temperature 1 | 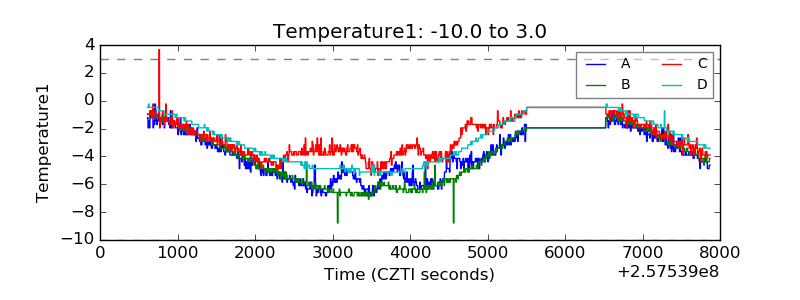 |
| Veto HV Monitor |  |
| Veto LLD | 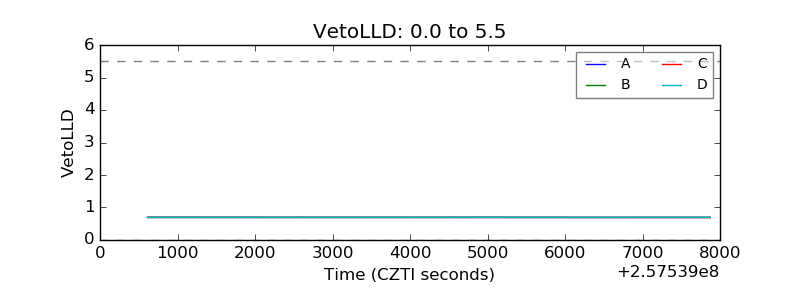 |
| Alpha Counter |  |
| _CPM_Rate | 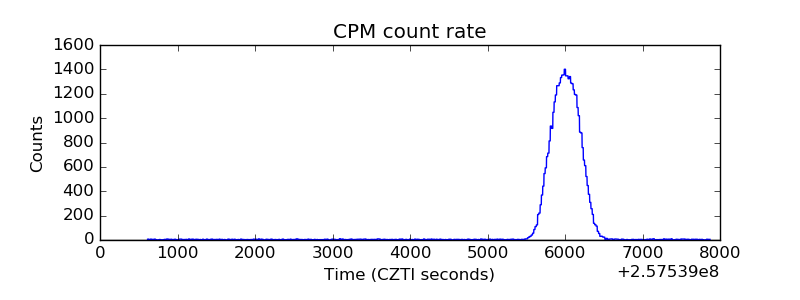 |
| CZT Counter | 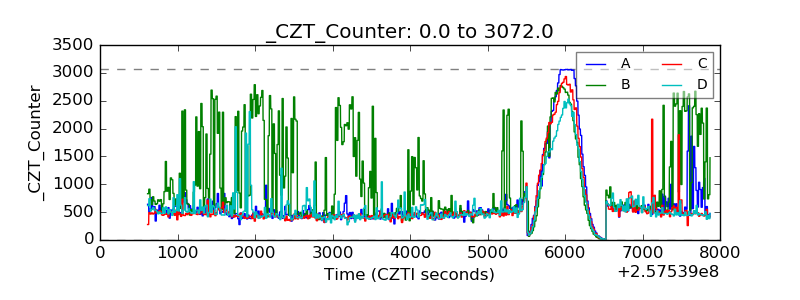 |
| +2.5 Volts monitor |  |
| +5 Volts monitor |  |
| _ROLL_ROT | 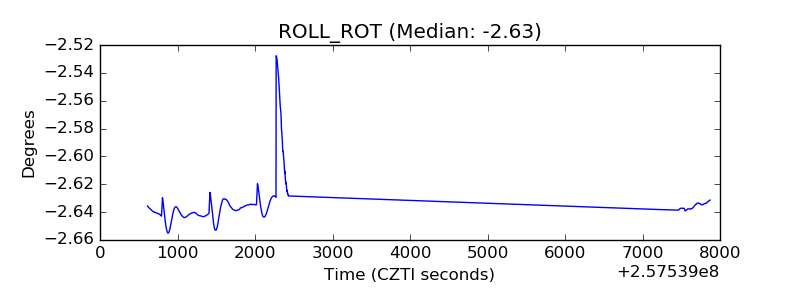 |
| _Roll_DEC | 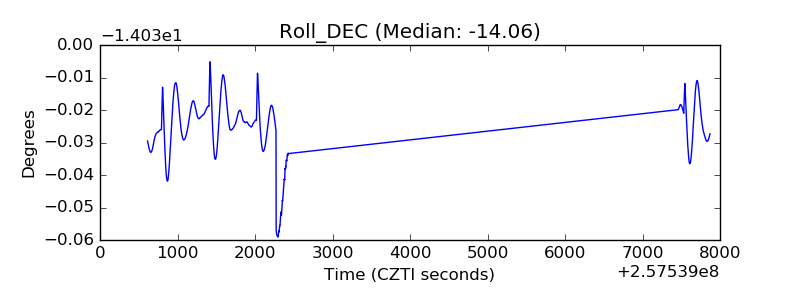 |
| _Roll_RA |  |
| Veto Counter | 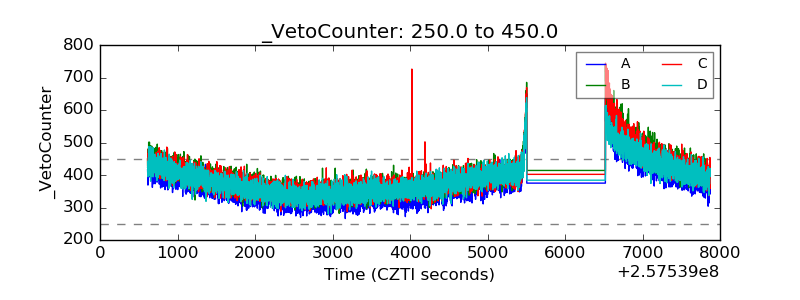 |