| Param | Original file | Final file |
|---|---|---|
| Filename | modeM0/AS1G08_037T01_9000001928_13097cztM0_level2.evt | modeM0/AS1G08_037T01_9000001928_13097cztM0_level2_quad_clean.evt |
| Size (bytes) | 217,157,760 | 42,344,640 |
| Size | 207.1 MB | 40.4 MB |
| Events in quadrant A | 1,538,262 | 279,343 |
| Events in quadrant B | 1,947,472 | 279,547 |
| Events in quadrant C | 1,212,108 | 279,464 |
| Events in quadrant D | 1,703,251 | 260,154 |
| Mode SS | |||
|---|---|---|---|
| Quadrant | BADHDUFLAG | Total packets | Discarded packets |
| A | 0 | 52 | 0 |
| B | 0 | 52 | 0 |
| C | 0 | 52 | 0 |
| D | 0 | 52 | 0 |
| Mode M0 | |||
|---|---|---|---|
| Quadrant | BADHDUFLAG | Total packets | Discarded packets |
| A | 0 | 6289 | 0 |
| B | 0 | 7440 | 0 |
| C | 0 | 5303 | 0 |
| D | 0 | 6837 | 0 |
| Quadrant | Total seconds | Saturated seconds | Saturation percentage |
|---|---|---|---|
| A | 2554 | 62 | 2.427565% |
| B | 2554 | 244 | 9.553641% |
| C | 2554 | 4 | 0.156617% |
| D | 2554 | 122 | 4.776821% |
Noise dominated data is calculated using 1-second bins in cleaned event files. If a bin has >2000 counts, and if more than 50% of those come from <1% of pixels, then it is considered to be noise-dominated and hence unusable.
| Quadrant | # 1 sec bins | Bins with >0 counts | Bins with >2000 counts | High rate bins dominated by noise | Noise dominated (total time) | Noise dominated (detector-on time) | Marked lightcurve |
|---|---|---|---|---|---|---|---|
| A | 2555 | 2555 | 58 | 58 | 2.27% | 2.27% | 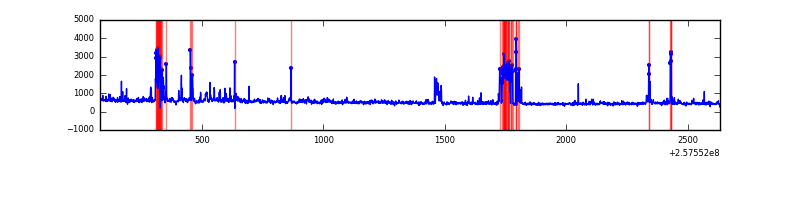 |
| B | 2555 | 2555 | 168 | 168 | 6.58% | 6.58% | 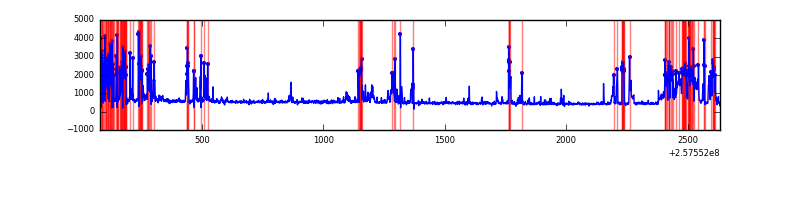 |
| C | 2555 | 2555 | 2 | 2 | 0.08% | 0.08% | 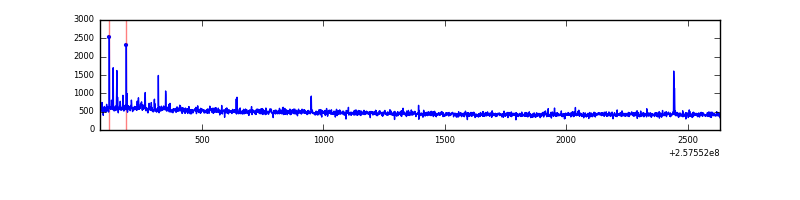 |
| D | 2555 | 2555 | 93 | 93 | 3.64% | 3.64% | 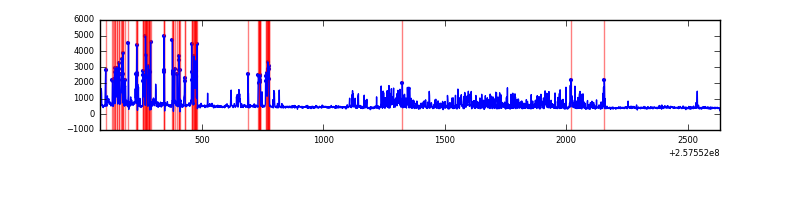 |
Top three noisy pixels from each quadrant. If the there are fewer than three noisy pixels in the level2.evt file, extra rows are filled as -1
| Pixel properties | Quadrant properties | ||||||
|---|---|---|---|---|---|---|---|
| Quadrant | DetID | PixID | Counts | Sigma | Mean | Median | Sigma |
| A | 15 | 223 | 180784 | 2872.93 | 301 | 296 | 62.8 |
| A | 15 | 239 | 70206 | 1112.8 | 301 | 296 | 62.8 |
| A | 12 | 189 | 58866 | 932.29 | 301 | 296 | 62.8 |
| B | 0 | 85 | 368744 | 6475.2 | 295 | 290 | 56.9 |
| B | 4 | 239 | 327563 | 5751.49 | 295 | 290 | 56.9 |
| B | 3 | 64 | 60666 | 1061.05 | 295 | 290 | 56.9 |
| C | 15 | 208 | 17363 | 241.39 | 300 | 303 | 70.7 |
| C | 8 | 112 | 13090 | 180.93 | 300 | 303 | 70.7 |
| C | 12 | 4 | 4776 | 63.29 | 300 | 303 | 70.7 |
| D | 1 | 52 | 308628 | 4335.93 | 285 | 278 | 71.1 |
| D | 10 | 157 | 218274 | 3065.4 | 285 | 278 | 71.1 |
| D | 12 | 110 | 47976 | 670.72 | 285 | 278 | 71.1 |
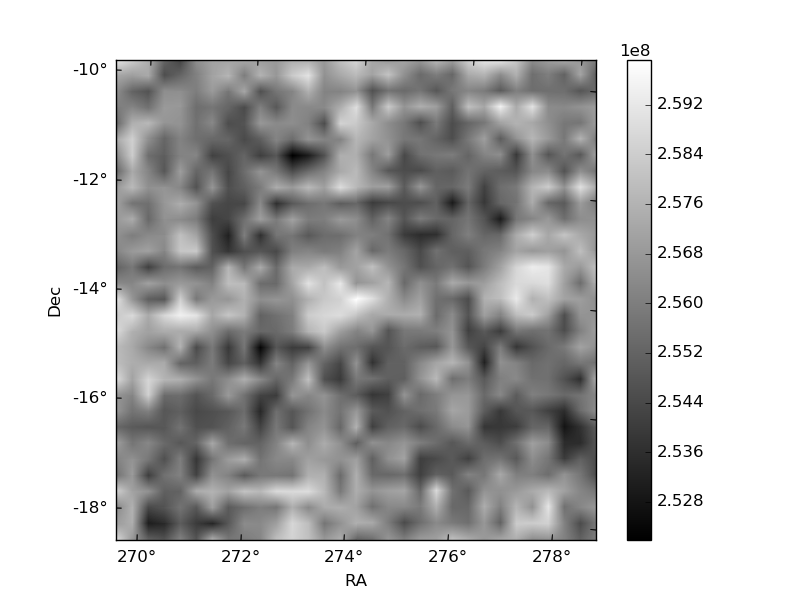
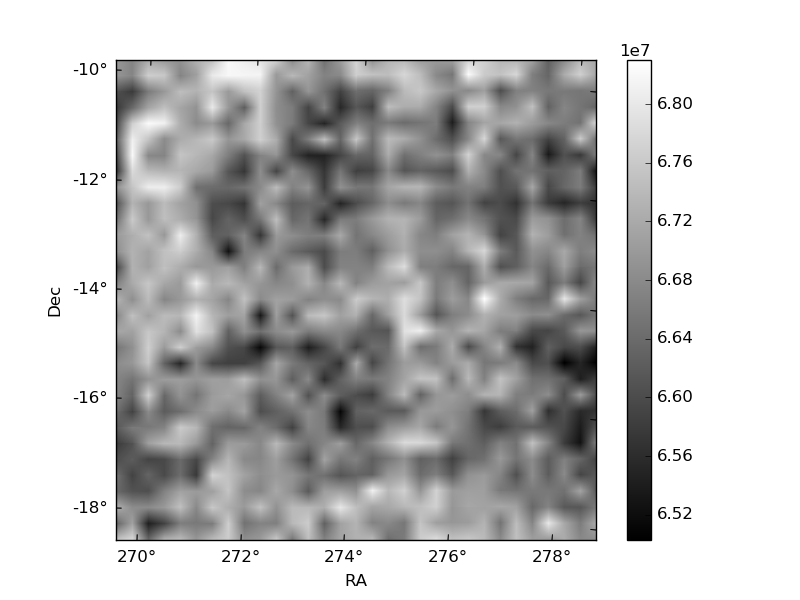
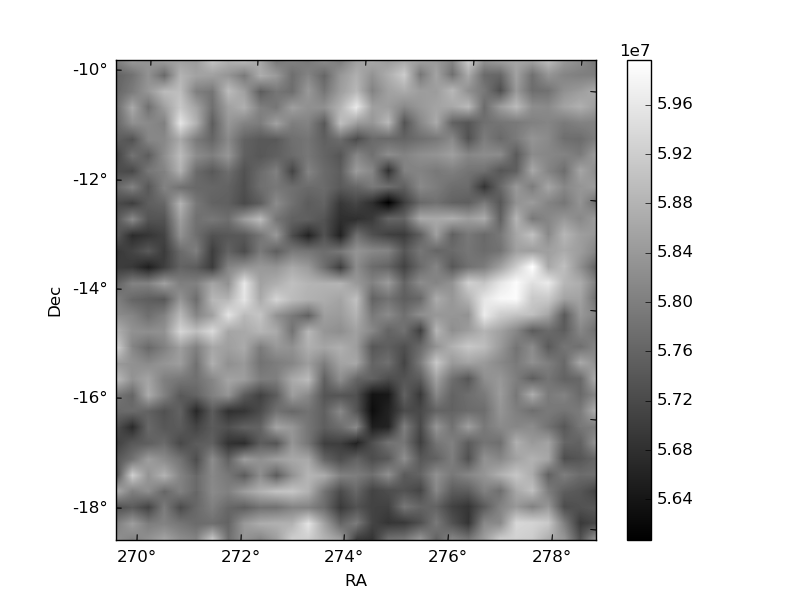
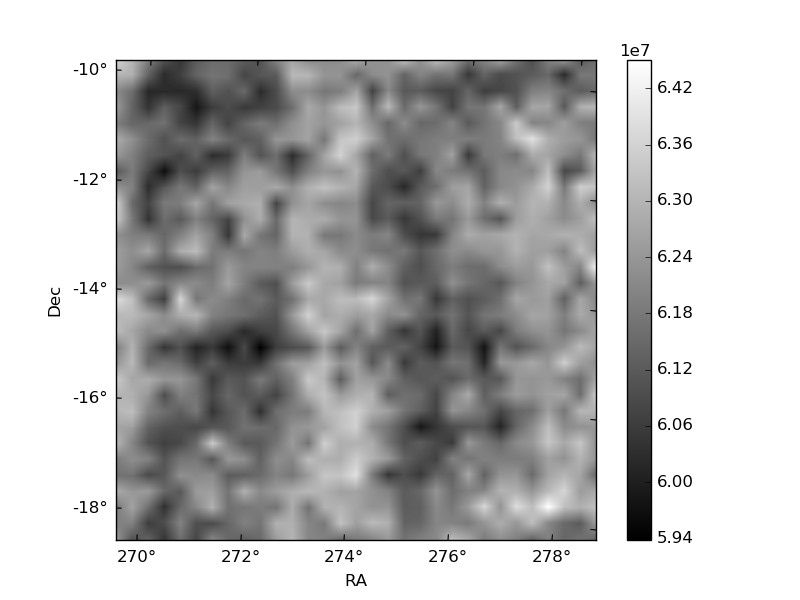
Histogram calculated using DETX and DETY for each event in the final _common_clean file
| Quadrant A | 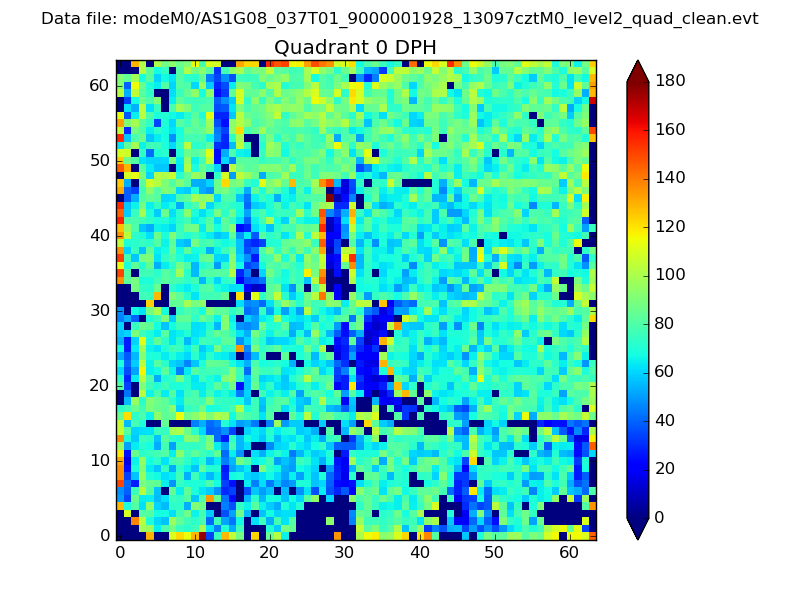 |
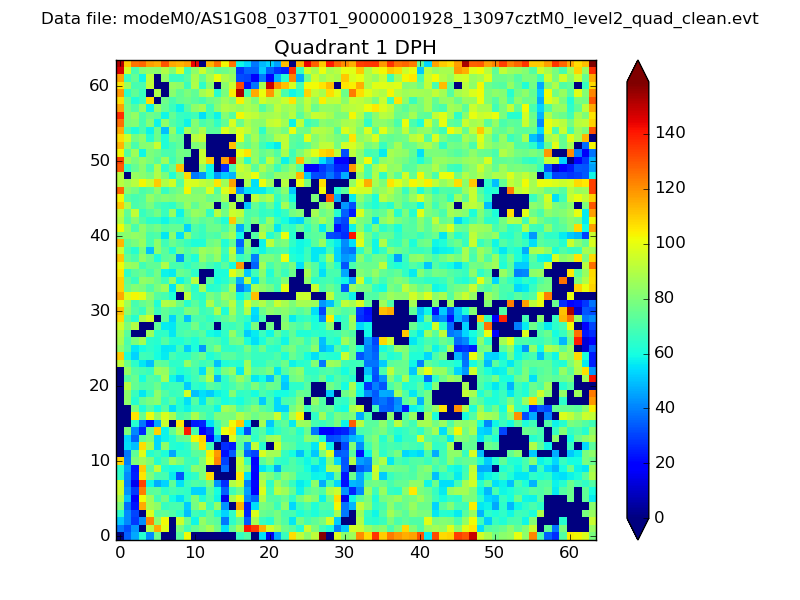 |
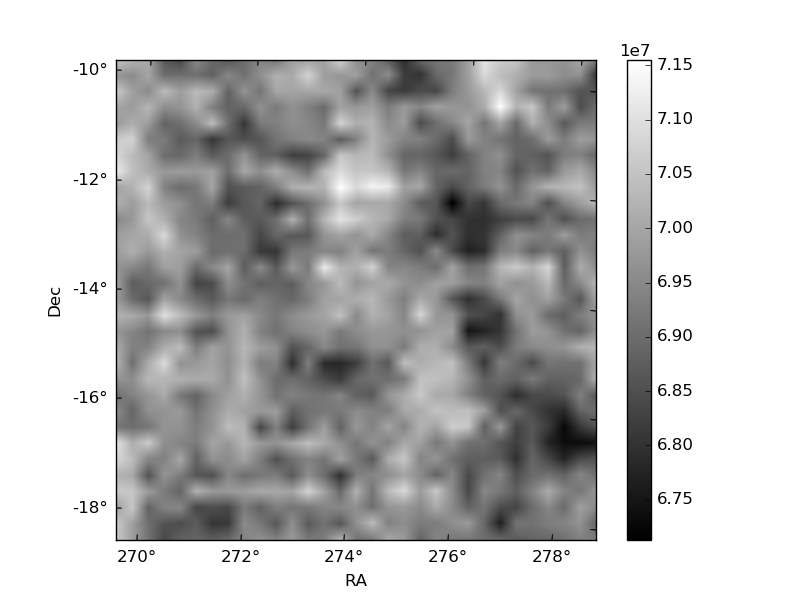
Quadrant B |
|---|---|---|---|
| Quadrant D | 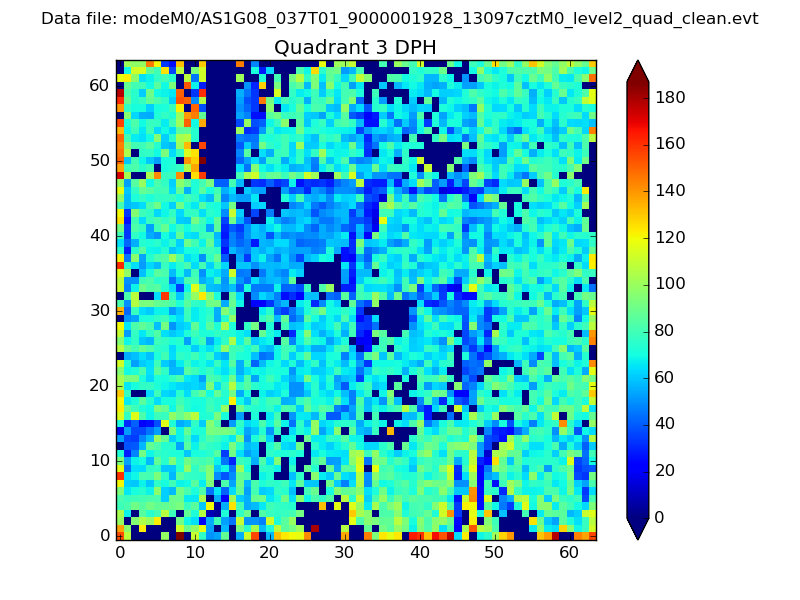 |
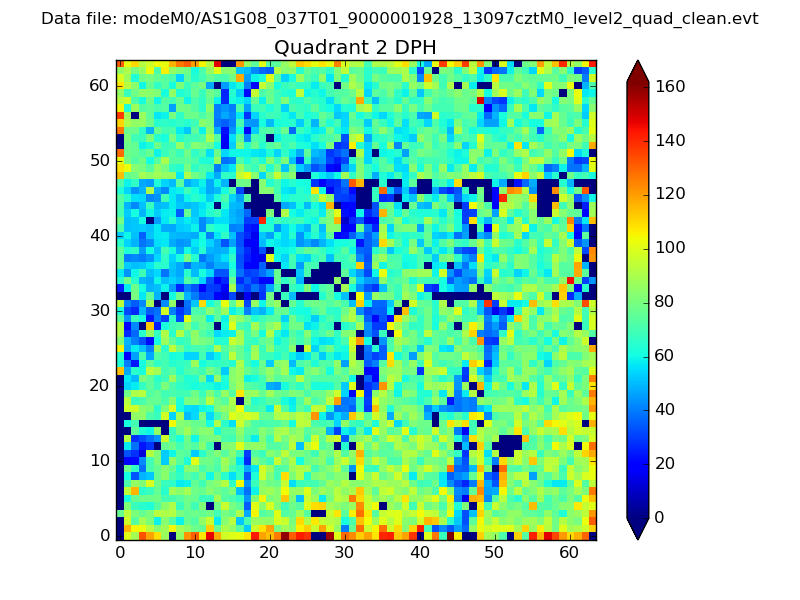 |
Quadrant C |
| Plot type | Count rate plots | Images |
|---|---|---|
| Comparison with Poisson distribution Blue bars denote a histogram of data divided into 1 sec bins. Red curve is a Poisson curve with rate = median count rate of data. |
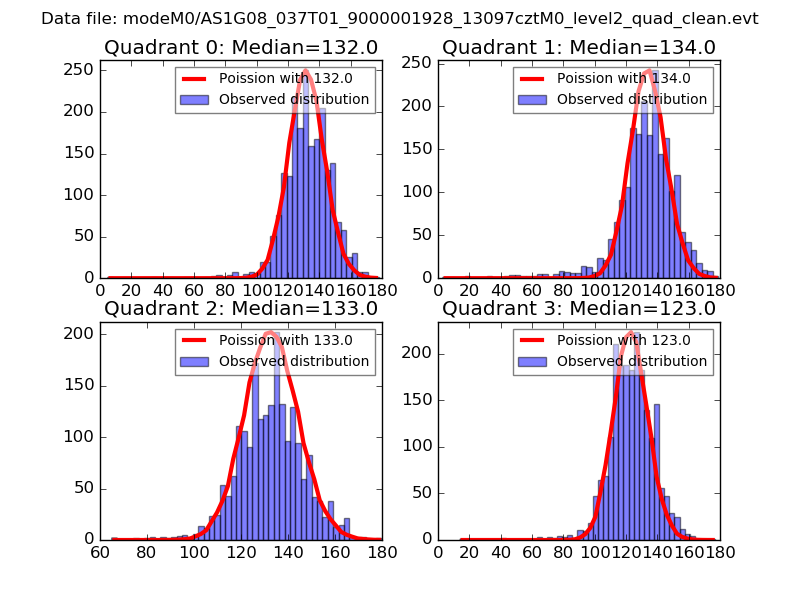 |
 |
| Quadrant-wise count rates Data is divided into 100 sec bins |
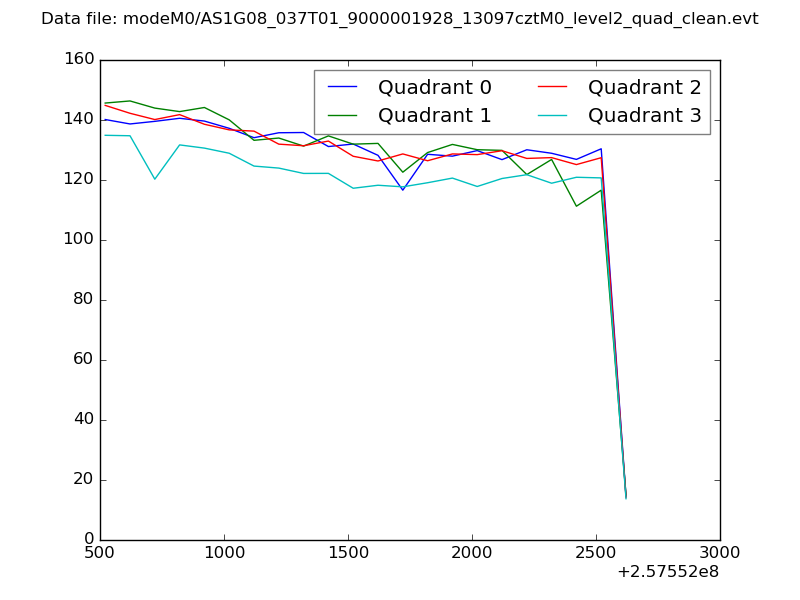 |
|
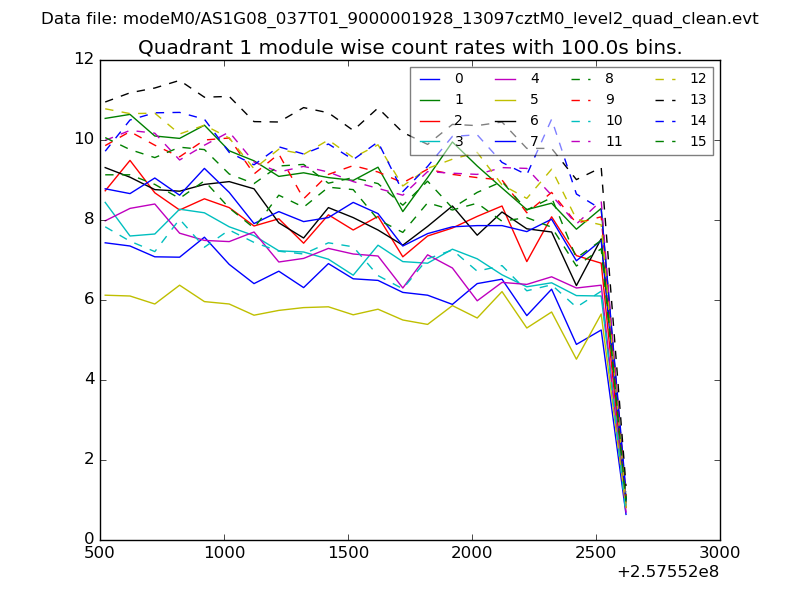
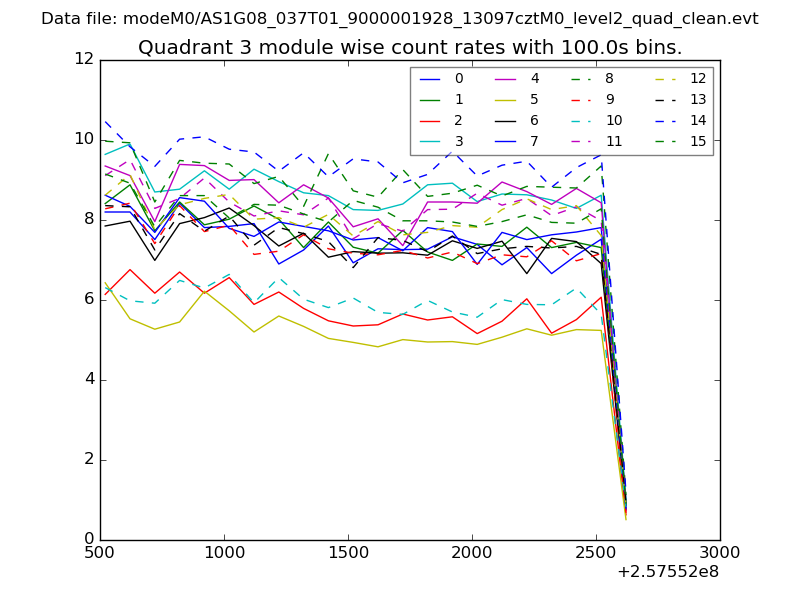
| Module-wise count rates for Quadrant A Data is divided into 100 sec bins |
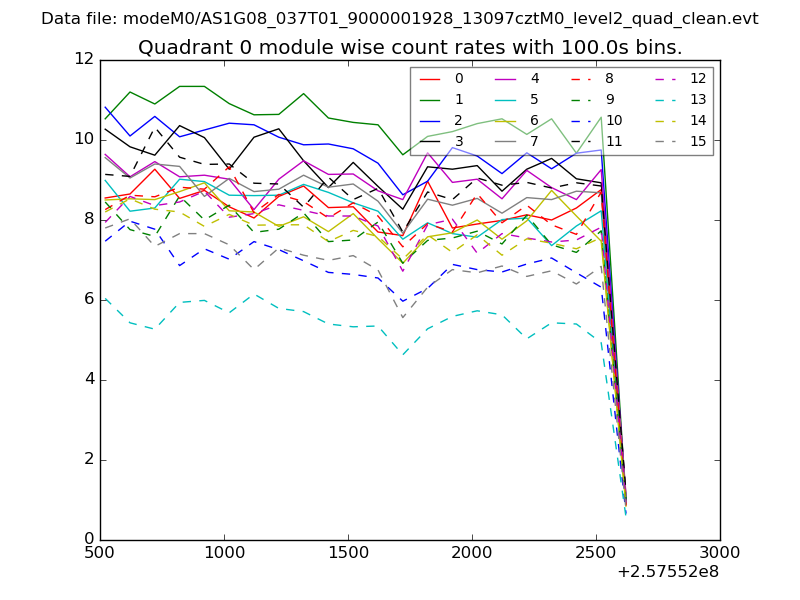 |
 |
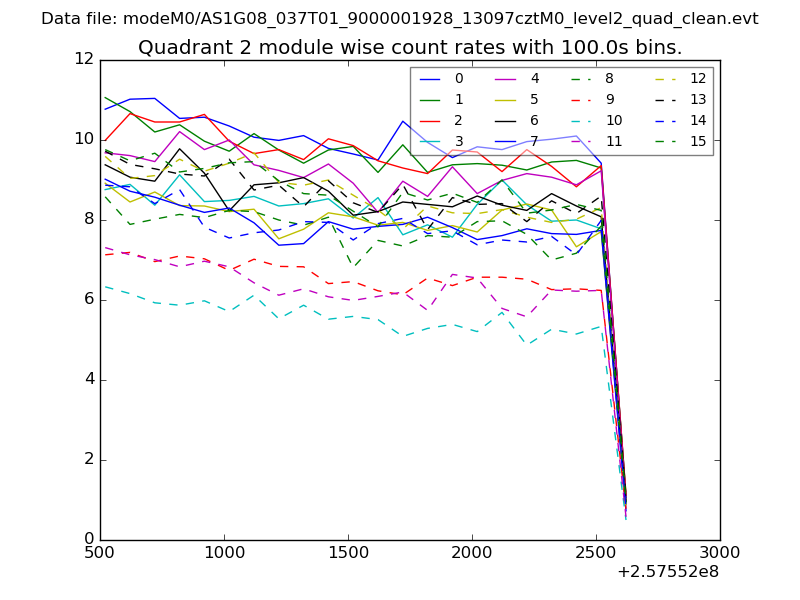
| Module-wise count rates for Quadrant B Data is divided into 100 sec bins |
 |
 |
| Module-wise count rates for Quadrant C Data is divided into 100 sec bins |
 |
 |
| Module-wise count rates for Quadrant D Data is divided into 100 sec bins |
 |
 |
| Parameter | Plot |
|---|---|
| CZT HV Monitor | 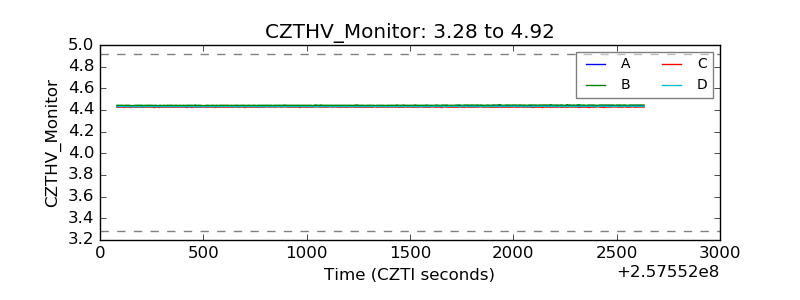 |
| D_VDD | 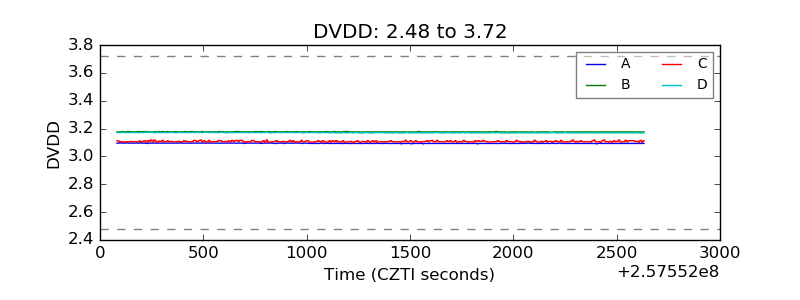 |
| Temperature 1 | 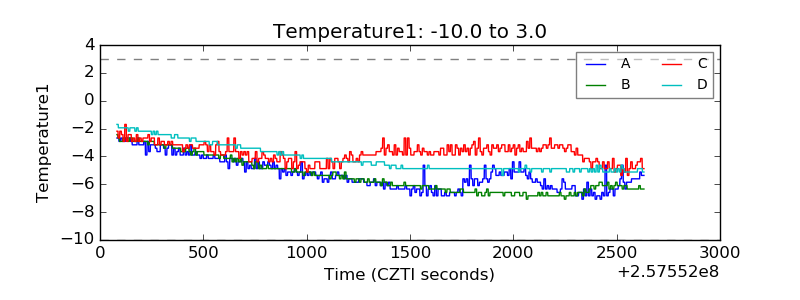 |
| Veto HV Monitor | 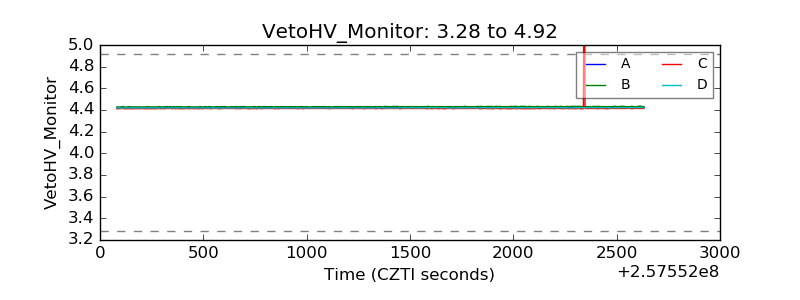 |
| Veto LLD | 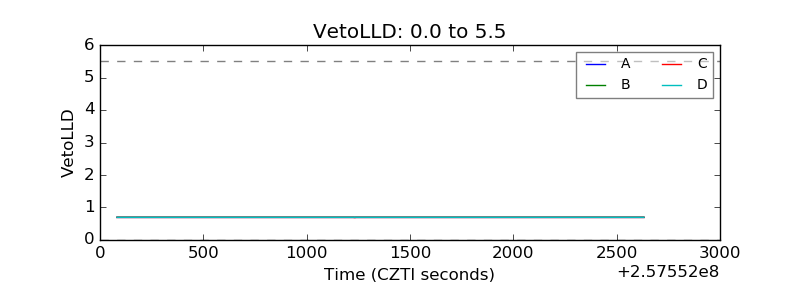 |
| Alpha Counter | 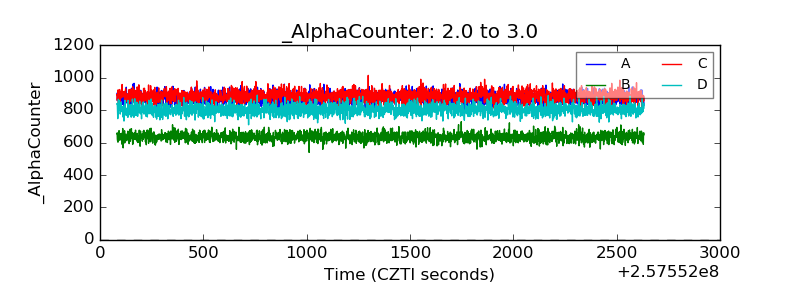 |
| _CPM_Rate | 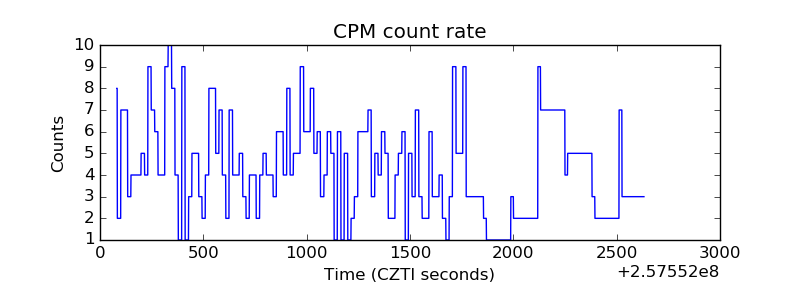 |
| CZT Counter | 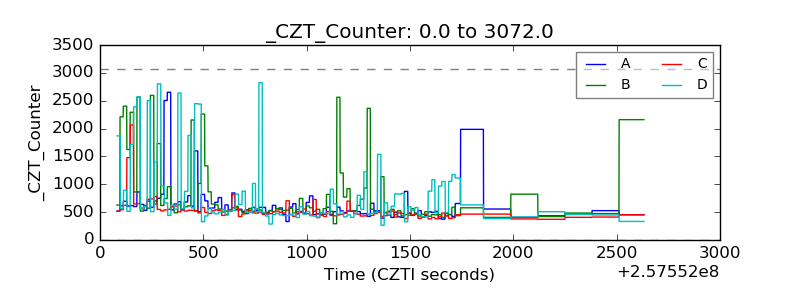 |
| +2.5 Volts monitor |  |
| +5 Volts monitor | 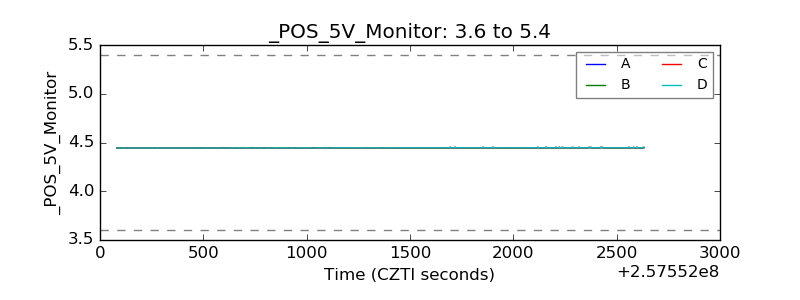 |
| _ROLL_ROT | 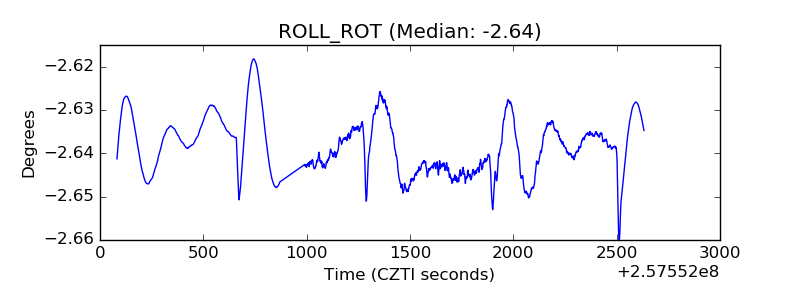 |
| _Roll_DEC | 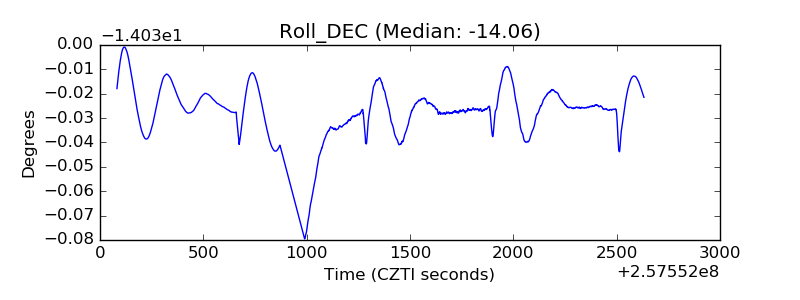 |
| _Roll_RA | 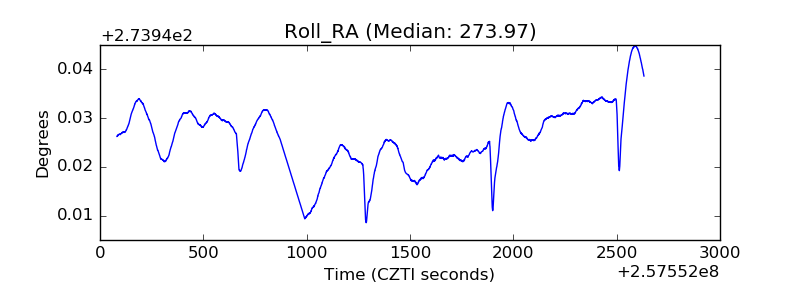 |
| Veto Counter | 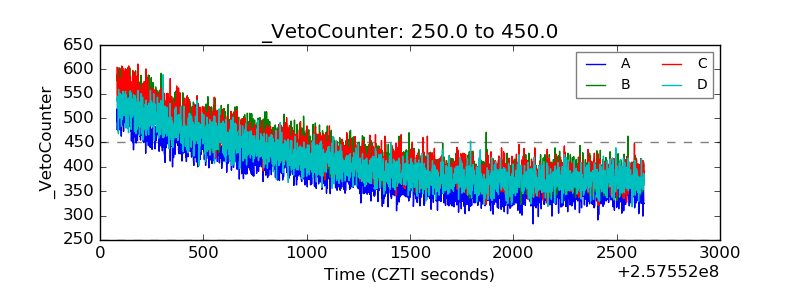 |