| Param | Original file | Final file |
|---|---|---|
| Filename | modeM0/AS1A04_017T01_9000001932_13112cztM0_level2.evt | modeM0/AS1A04_017T01_9000001932_13112cztM0_level2_quad_clean.evt |
| Size (bytes) | 551,943,360 | 29,154,240 |
| Size | 526.4 MB | 27.8 MB |
| Events in quadrant A | 2,489,460 | 178,458 |
| Events in quadrant B | 2,877,806 | 182,318 |
| Events in quadrant C | 1,901,100 | 181,083 |
| Events in quadrant D | 9,182,474 | 64,311 |
| Mode M0 | |||
|---|---|---|---|
| Quadrant | BADHDUFLAG | Total packets | Discarded packets |
| A | 0 | 9885 | 2 |
| B | 0 | 10934 | 1 |
| C | 0 | 8011 | 1 |
| D | 0 | 29952 | 1 |
| Mode M9 | |||
|---|---|---|---|
| Quadrant | BADHDUFLAG | Total packets | Discarded packets |
| A | 0 | 13 | 0 |
| B | 0 | 13 | 0 |
| C | 0 | 13 | 0 |
| D | 0 | 13 | 0 |
| Mode SS | |||
|---|---|---|---|
| Quadrant | BADHDUFLAG | Total packets | Discarded packets |
| A | 0 | 80 | 0 |
| B | 0 | 80 | 0 |
| C | 0 | 80 | 0 |
| D | 0 | 80 | 0 |
| Quadrant | Total seconds | Saturated seconds | Saturation percentage |
|---|---|---|---|
| A | 3900 | 122 | 3.128205% |
| B | 3900 | 350 | 8.974359% |
| C | 3900 | 14 | 0.358974% |
| D | 3900 | 3240 | 83.076923% |
Noise dominated data is calculated using 1-second bins in cleaned event files. If a bin has >2000 counts, and if more than 50% of those come from <1% of pixels, then it is considered to be noise-dominated and hence unusable.
| Quadrant | # 1 sec bins | Bins with >0 counts | Bins with >2000 counts | High rate bins dominated by noise | Noise dominated (total time) | Noise dominated (detector-on time) | Marked lightcurve |
|---|---|---|---|---|---|---|---|
| A | 5176 | 3903 | 84 | 84 | 1.62% | 2.15% |  |
| B | 5176 | 3902 | 243 | 243 | 4.69% | 6.23% |  |
| C | 5176 | 3903 | 0 | 0 | 0.00% | 0.00% | 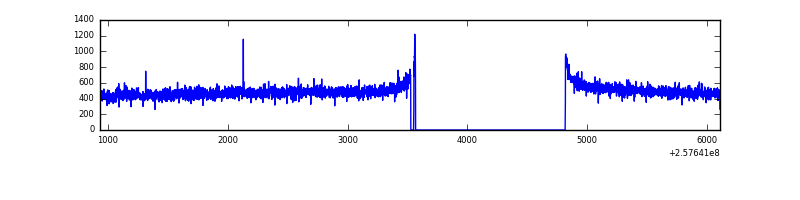 |
| D | 5176 | 3903 | 2757 | 2757 | 53.27% | 70.64% | 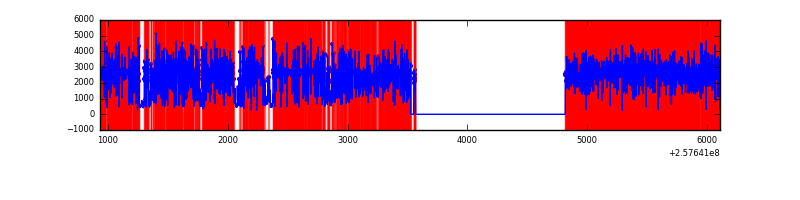 |
Top three noisy pixels from each quadrant. If the there are fewer than three noisy pixels in the level2.evt file, extra rows are filled as -1
| Pixel properties | Quadrant properties | ||||||
|---|---|---|---|---|---|---|---|
| Quadrant | DetID | PixID | Counts | Sigma | Mean | Median | Sigma |
| A | 15 | 223 | 285194 | 2801.7 | 496 | 487 | 101.6 |
| A | 15 | 239 | 141550 | 1388.15 | 496 | 487 | 101.6 |
| A | 12 | 189 | 112425 | 1101.54 | 496 | 487 | 101.6 |
| B | 0 | 85 | 701211 | 7473.83 | 488 | 476 | 93.8 |
| B | 4 | 239 | 117922 | 1252.64 | 488 | 476 | 93.8 |
| B | 3 | 64 | 113514 | 1205.63 | 488 | 476 | 93.8 |
| C | 0 | 207 | 4969 | 39.32 | 485 | 489 | 113.9 |
| C | 13 | 61 | 3533 | 26.72 | 485 | 489 | 113.9 |
| C | 8 | 112 | 2455 | 17.26 | 485 | 489 | 113.9 |
| D | 13 | 122 | 8027480 | 127662.67 | 256 | 249 | 62.9 |
| D | 1 | 52 | 128065 | 2032.75 | 256 | 249 | 62.9 |
| D | 10 | 157 | 38921 | 615.03 | 256 | 249 | 62.9 |
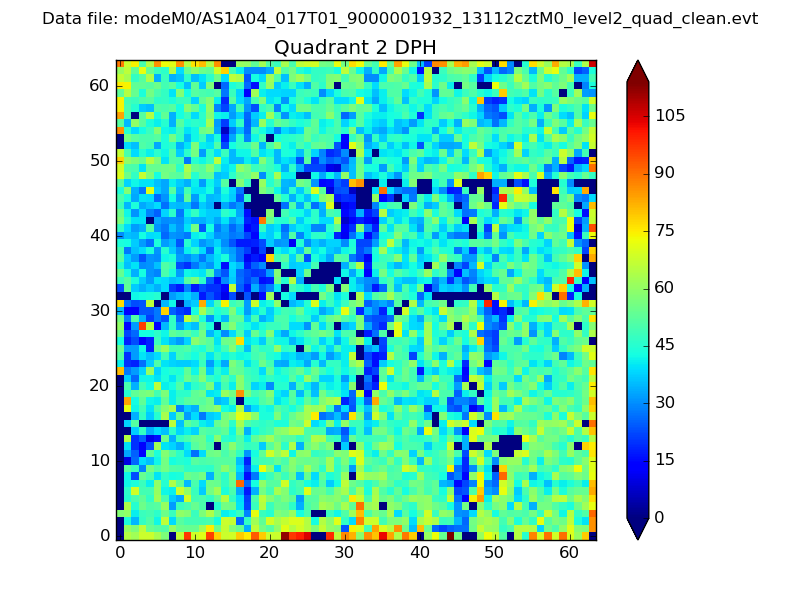
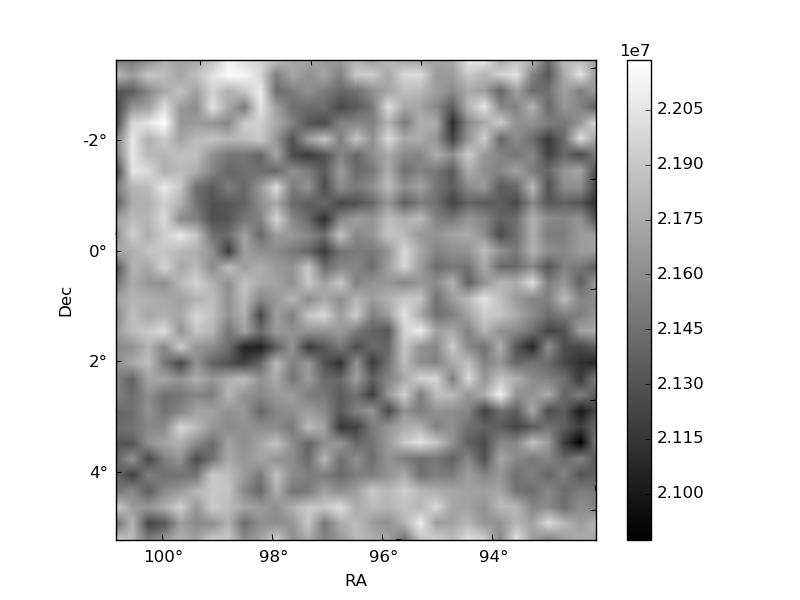
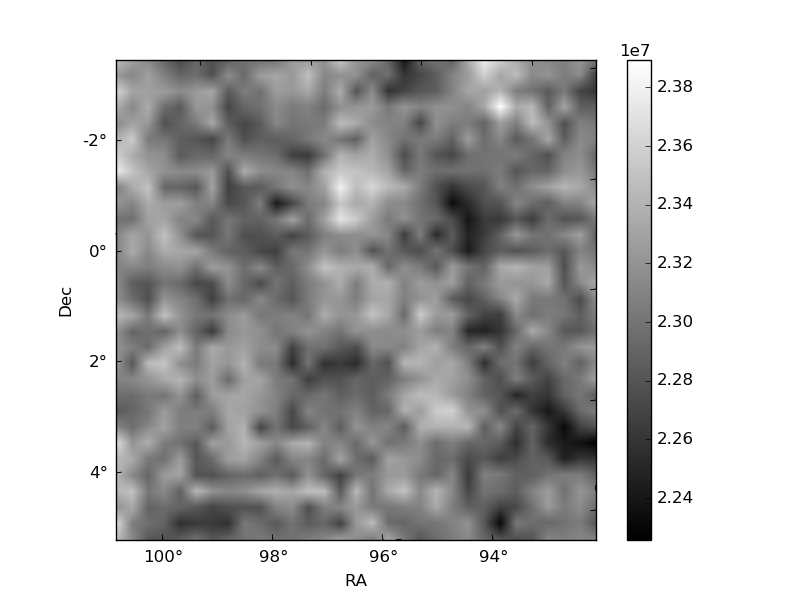
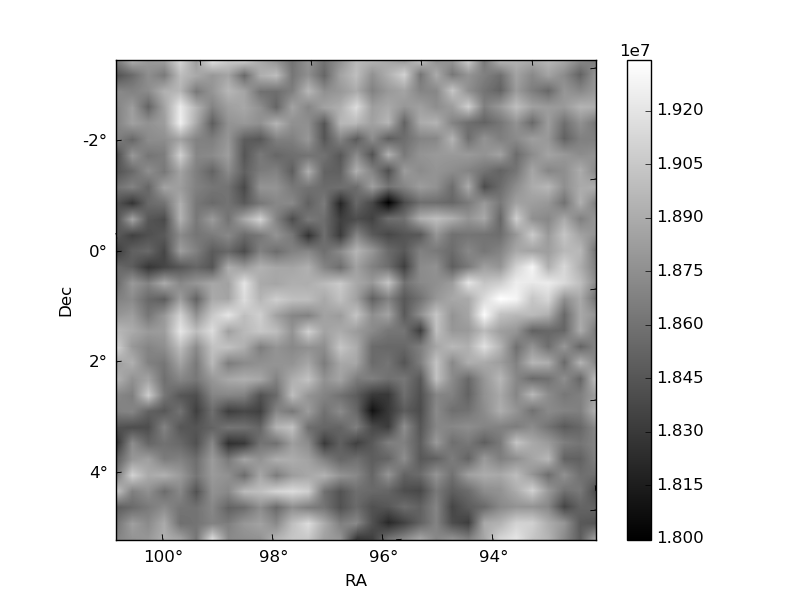
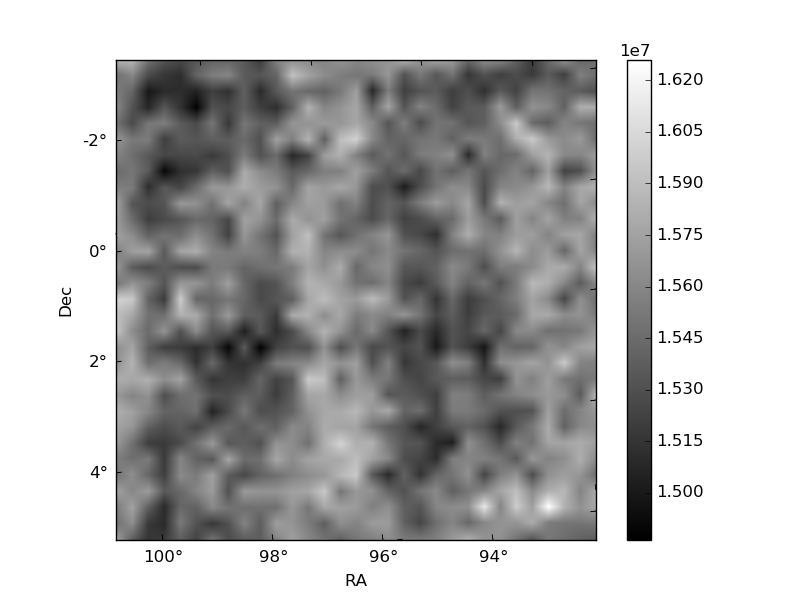
Histogram calculated using DETX and DETY for each event in the final _common_clean file
| Quadrant A | 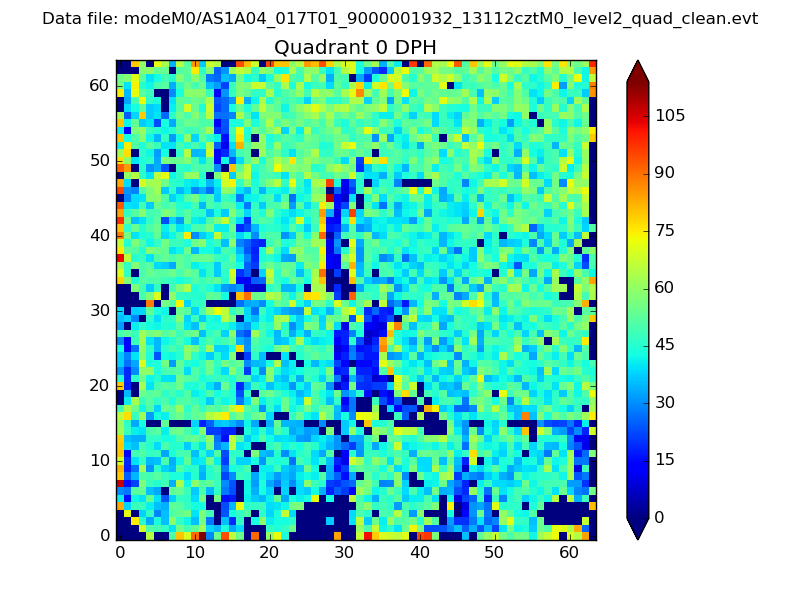 |
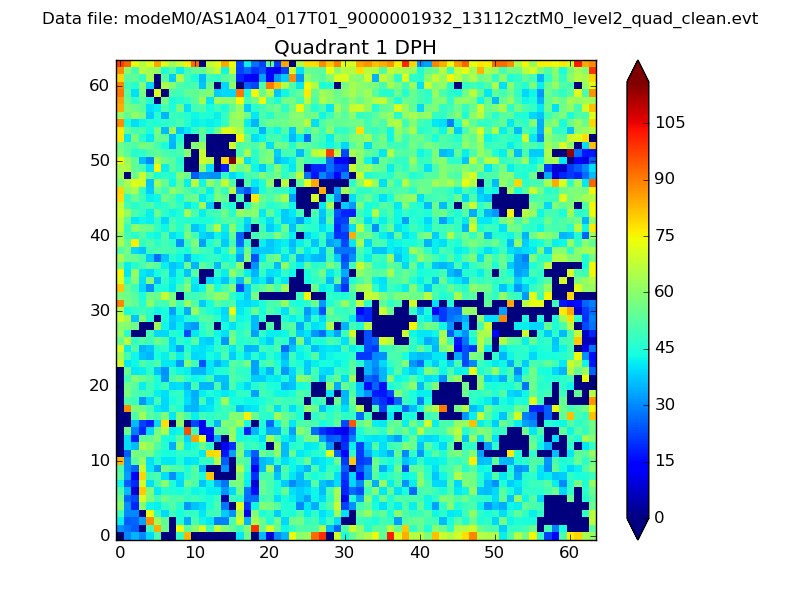 |
Quadrant B |
|---|---|---|---|
| Quadrant D | 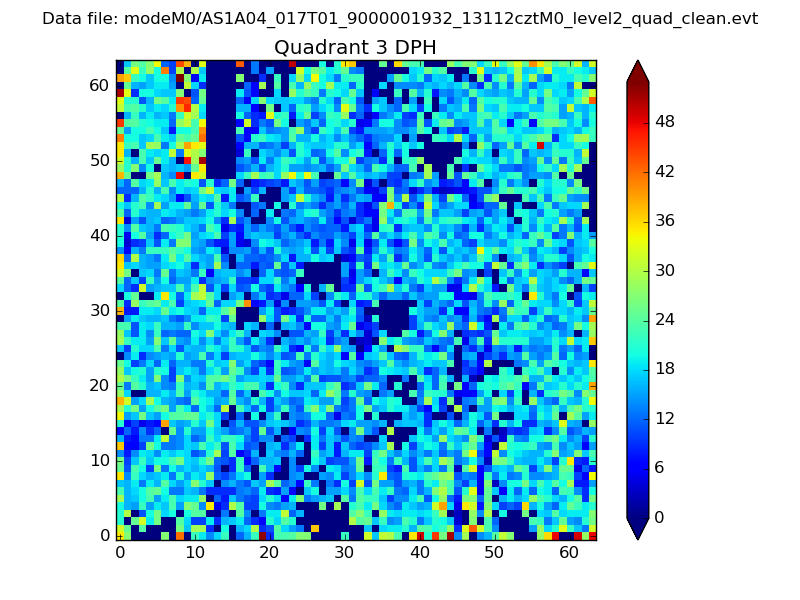 |
 |
Quadrant C |
| Plot type | Count rate plots | Images |
|---|---|---|
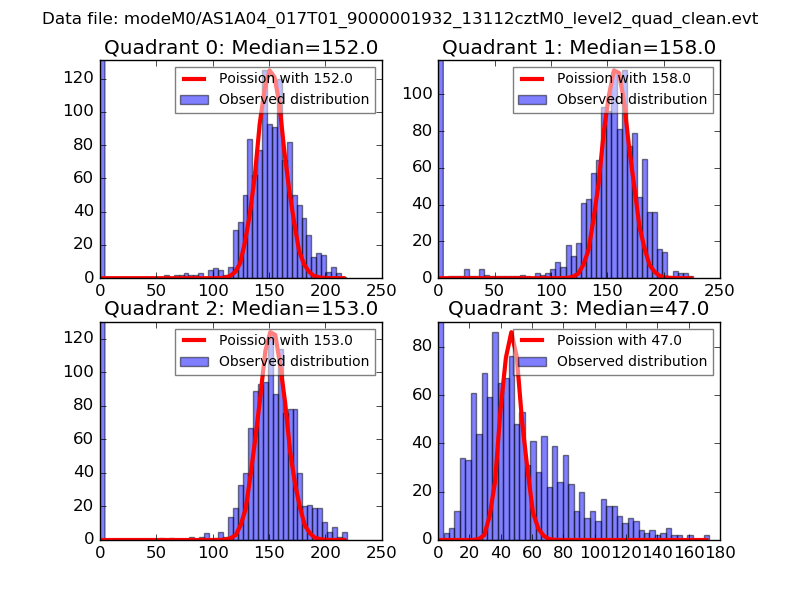
| Comparison with Poisson distribution Blue bars denote a histogram of data divided into 1 sec bins. Red curve is a Poisson curve with rate = median count rate of data. |
 |
 |
| Quadrant-wise count rates Data is divided into 100 sec bins |
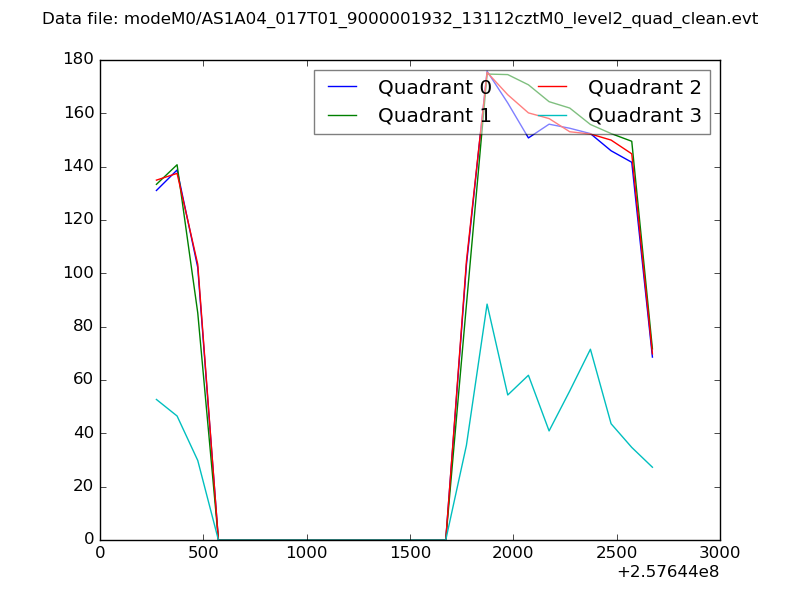 |
|
| Module-wise count rates for Quadrant A Data is divided into 100 sec bins |
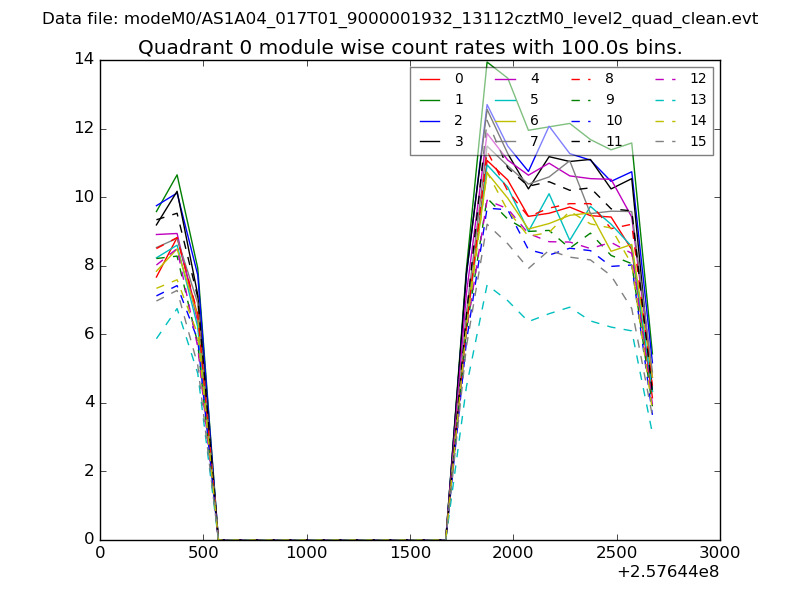 |
 |
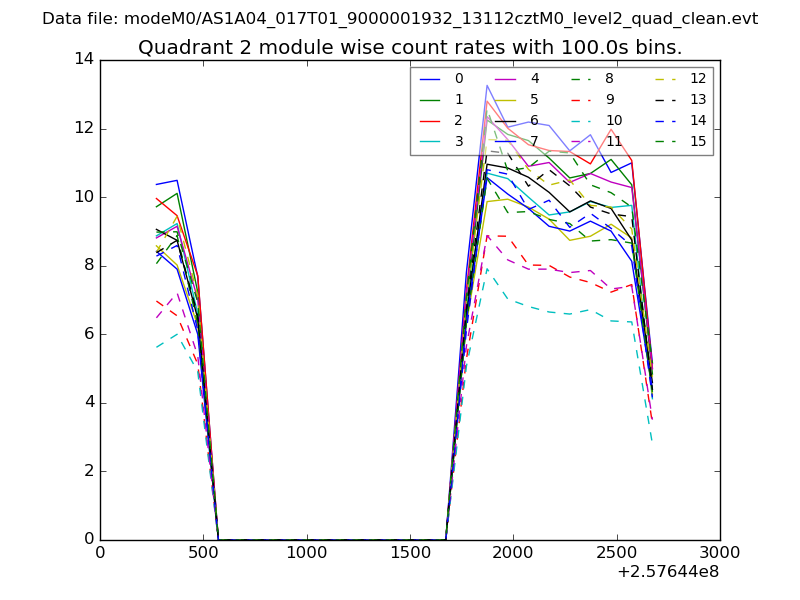
| Module-wise count rates for Quadrant B Data is divided into 100 sec bins |
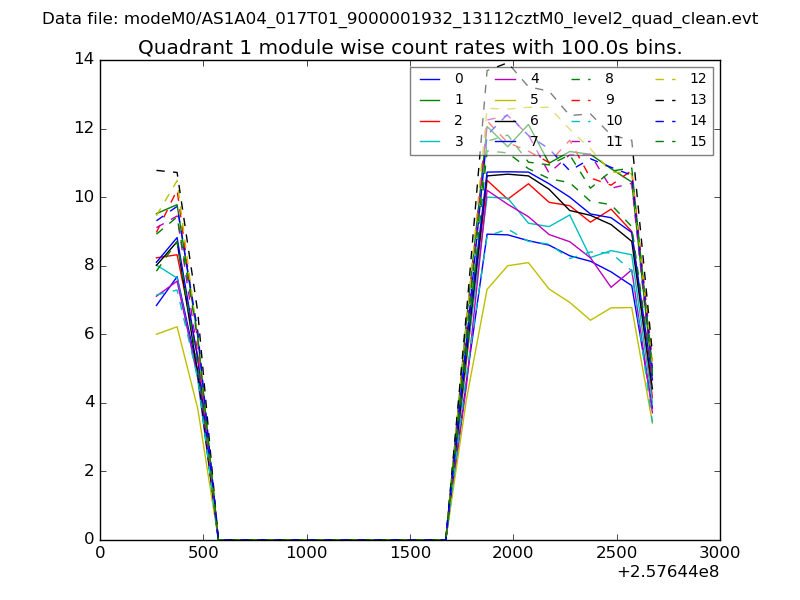 |
 |
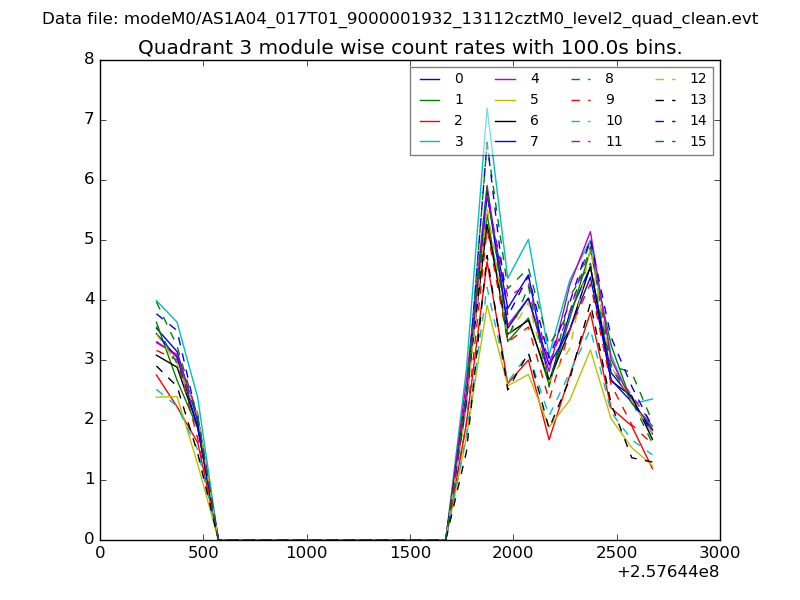
| Module-wise count rates for Quadrant C Data is divided into 100 sec bins |
 |
 |
| Module-wise count rates for Quadrant D Data is divided into 100 sec bins |
 |
 |
| Parameter | Plot |
|---|---|
| CZT HV Monitor | 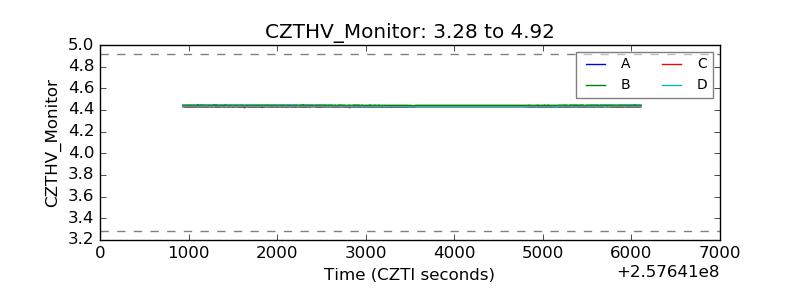 |
| D_VDD | 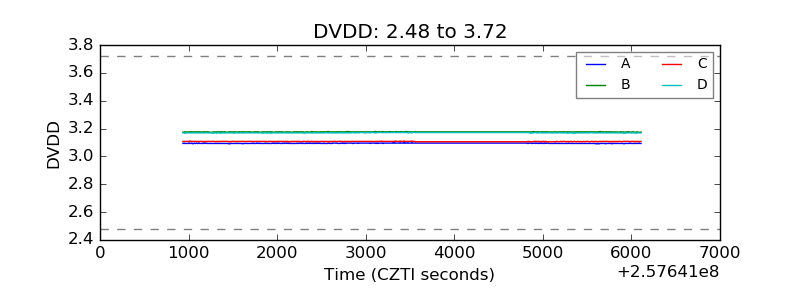 |
| Temperature 1 | 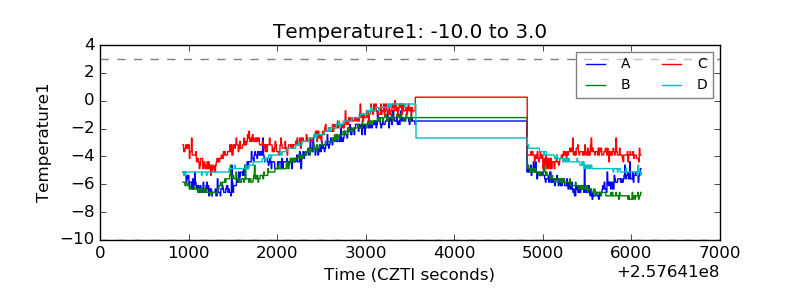 |
| Veto HV Monitor | 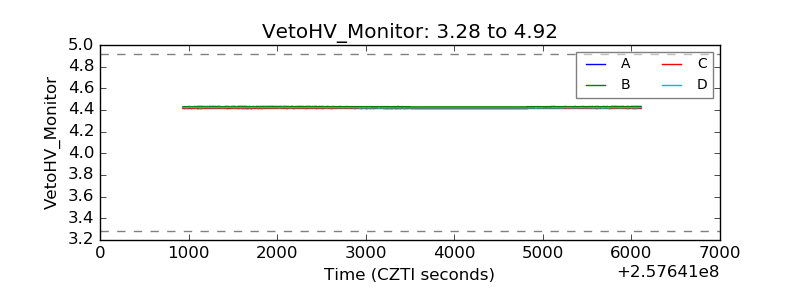 |
| Veto LLD | 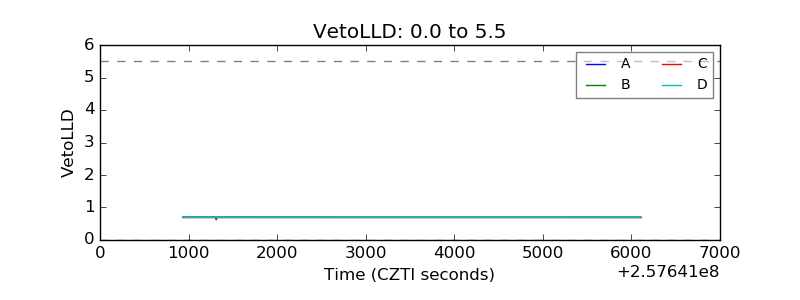 |
| Alpha Counter | 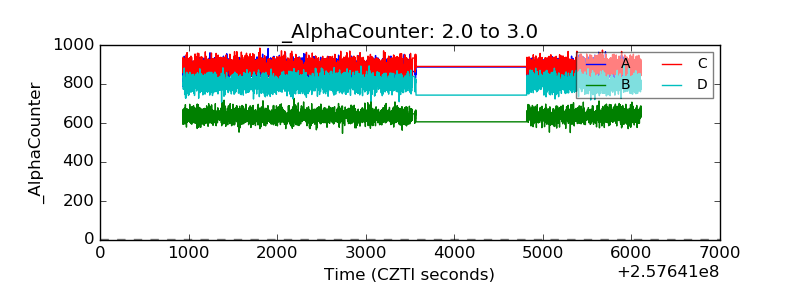 |
| _CPM_Rate | 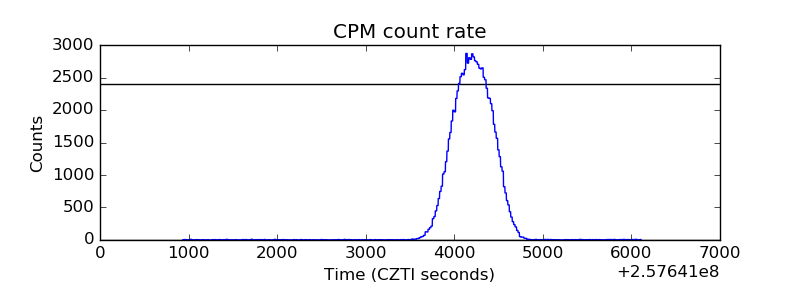 |
| CZT Counter | 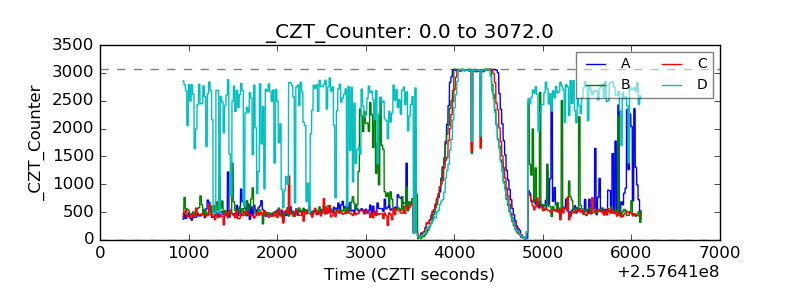 |
| +2.5 Volts monitor |  |
| +5 Volts monitor |  |
| _ROLL_ROT | 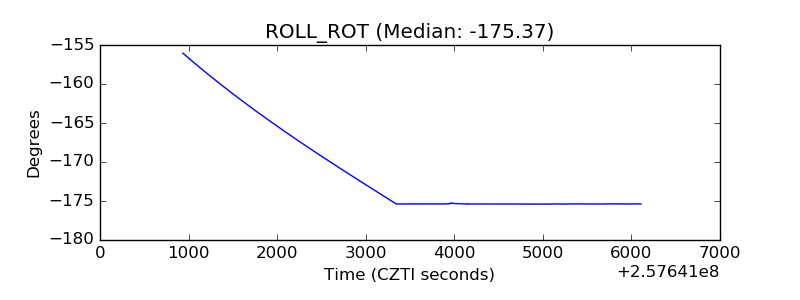 |
| _Roll_DEC | 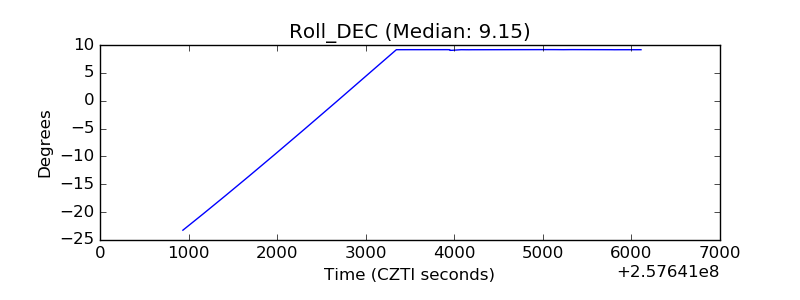 |
| _Roll_RA | 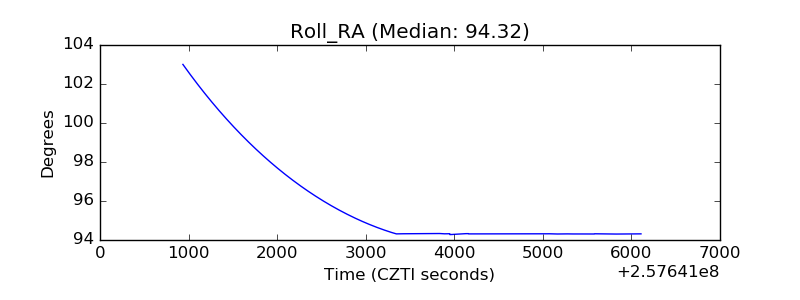 |
| Veto Counter | 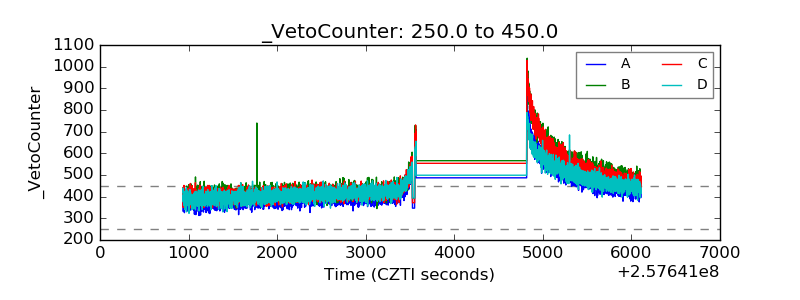 |