| Param | Original file | Final file |
|---|---|---|
| Filename | modeM0/AS1A04_017T01_9000001932_13113cztM0_level2.evt | modeM0/AS1A04_017T01_9000001932_13113cztM0_level2_quad_clean.evt |
| Size (bytes) | 679,296,960 | 64,111,680 |
| Size | 647.8 MB | 61.1 MB |
| Events in quadrant A | 3,897,353 | 407,236 |
| Events in quadrant B | 4,510,967 | 384,324 |
| Events in quadrant C | 2,997,081 | 414,509 |
| Events in quadrant D | 8,743,299 | 297,206 |
| Mode M0 | |||
|---|---|---|---|
| Quadrant | BADHDUFLAG | Total packets | Discarded packets |
| A | 0 | 15375 | 2 |
| B | 0 | 17267 | 1 |
| C | 0 | 12729 | 1 |
| D | 0 | 30232 | 1 |
| Mode M9 | |||
|---|---|---|---|
| Quadrant | BADHDUFLAG | Total packets | Discarded packets |
| A | 0 | 13 | 0 |
| B | 0 | 13 | 0 |
| C | 0 | 13 | 0 |
| D | 0 | 13 | 0 |
| Mode SS | |||
|---|---|---|---|
| Quadrant | BADHDUFLAG | Total packets | Discarded packets |
| A | 0 | 128 | 0 |
| B | 0 | 128 | 0 |
| C | 0 | 128 | 0 |
| D | 0 | 128 | 0 |
| Quadrant | Total seconds | Saturated seconds | Saturation percentage |
|---|---|---|---|
| A | 6260 | 162 | 2.587859% |
| B | 6260 | 622 | 9.936102% |
| C | 6260 | 6 | 0.095847% |
| D | 6260 | 1986 | 31.725240% |
Noise dominated data is calculated using 1-second bins in cleaned event files. If a bin has >2000 counts, and if more than 50% of those come from <1% of pixels, then it is considered to be noise-dominated and hence unusable.
| Quadrant | # 1 sec bins | Bins with >0 counts | Bins with >2000 counts | High rate bins dominated by noise | Noise dominated (total time) | Noise dominated (detector-on time) | Marked lightcurve |
|---|---|---|---|---|---|---|---|
| A | 7606 | 6262 | 121 | 121 | 1.59% | 1.93% | 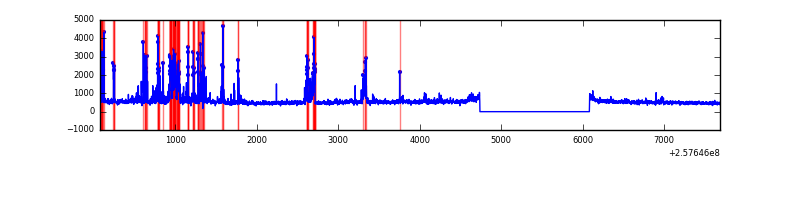 |
| B | 7606 | 6262 | 350 | 350 | 4.60% | 5.59% | 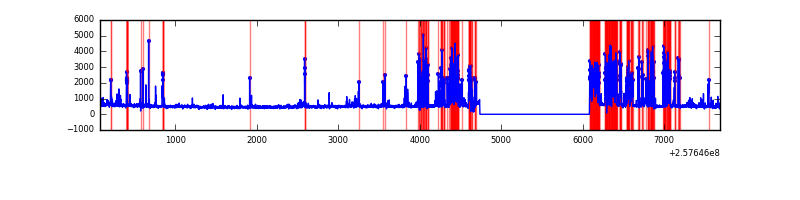 |
| C | 7606 | 6262 | 0 | 0 | 0.00% | 0.00% |  |
| D | 7606 | 6262 | 1781 | 1781 | 23.42% | 28.44% | 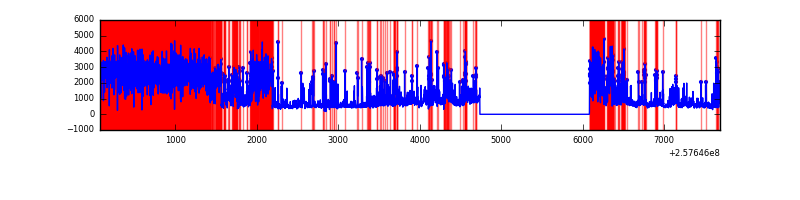 |
Top three noisy pixels from each quadrant. If the there are fewer than three noisy pixels in the level2.evt file, extra rows are filled as -1
| Pixel properties | Quadrant properties | ||||||
|---|---|---|---|---|---|---|---|
| Quadrant | DetID | PixID | Counts | Sigma | Mean | Median | Sigma |
| A | 15 | 223 | 468105 | 2974.08 | 781 | 769 | 157.1 |
| A | 15 | 239 | 213046 | 1350.91 | 781 | 769 | 157.1 |
| A | 12 | 189 | 159625 | 1010.94 | 781 | 769 | 157.1 |
| B | 4 | 239 | 1190339 | 8373.93 | 755 | 736 | 142.1 |
| B | 0 | 85 | 197203 | 1382.98 | 755 | 736 | 142.1 |
| B | 3 | 64 | 131739 | 922.16 | 755 | 736 | 142.1 |
| C | 13 | 61 | 5644 | 27.31 | 767 | 773 | 178.3 |
| C | 14 | 234 | 3531 | 15.47 | 767 | 773 | 178.3 |
| C | 0 | 207 | 3470 | 15.12 | 767 | 773 | 178.3 |
| D | 13 | 122 | 5527727 | 35604.02 | 637 | 620 | 155.2 |
| D | 1 | 52 | 468029 | 3010.91 | 637 | 620 | 155.2 |
| D | 10 | 157 | 202606 | 1301.14 | 637 | 620 | 155.2 |
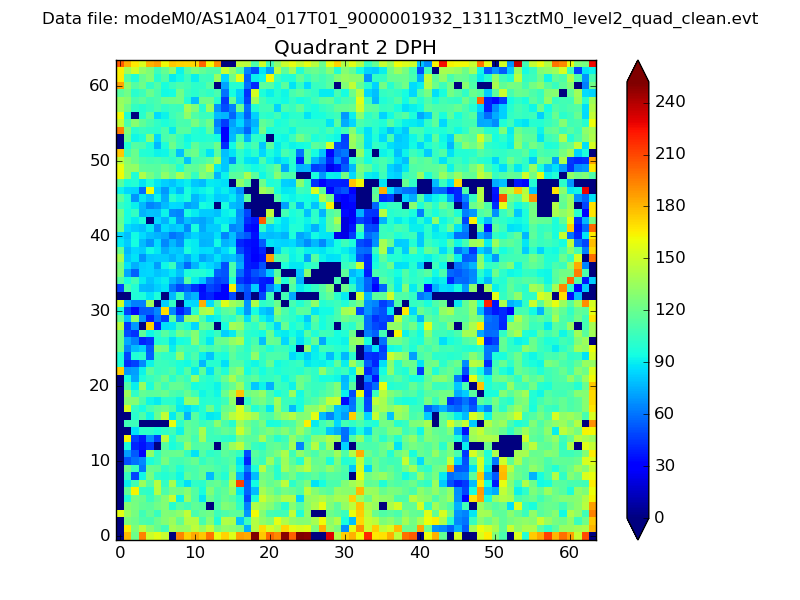
Histogram calculated using DETX and DETY for each event in the final _common_clean file
| Quadrant A | 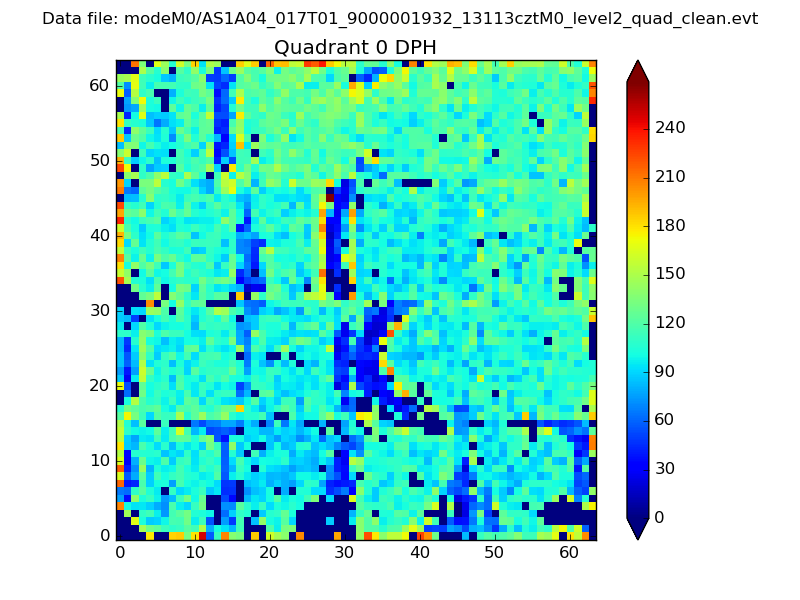 |
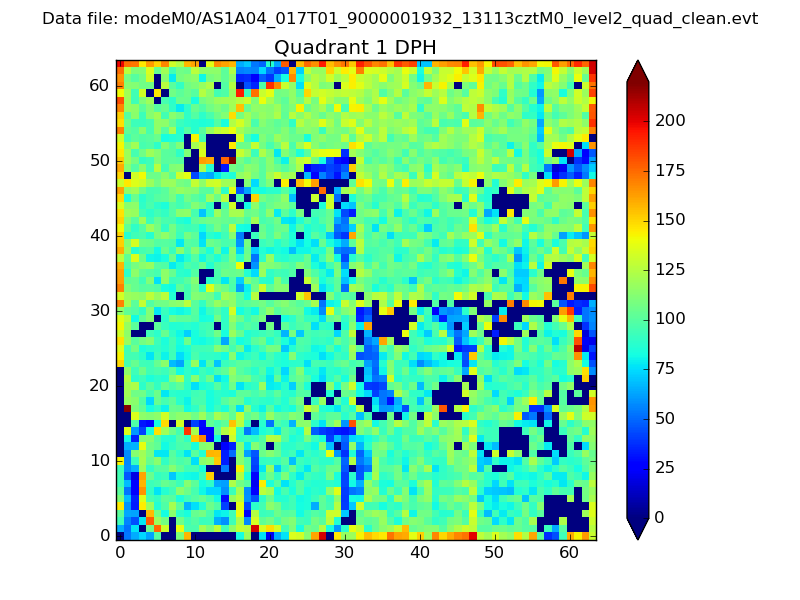 |
Quadrant B |
|---|---|---|---|
| Quadrant D | 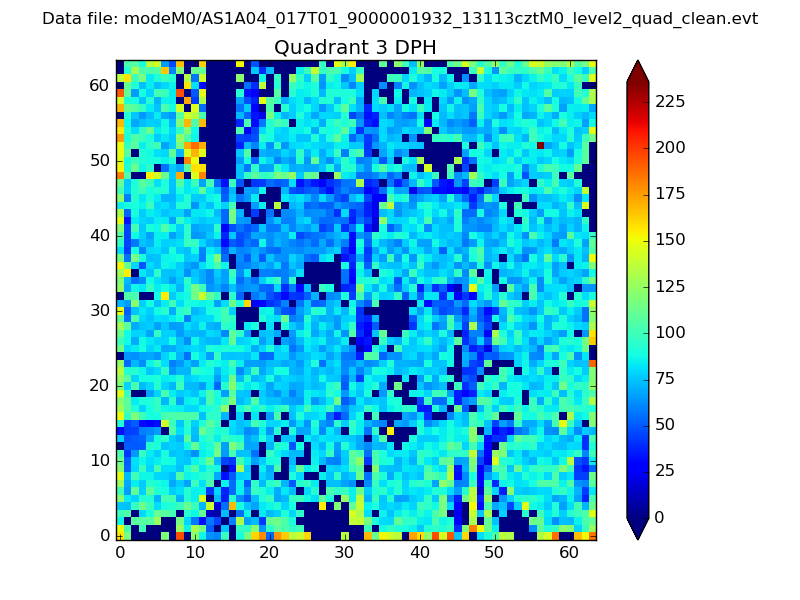 |
 |
Quadrant C |
| Plot type | Count rate plots | Images |
|---|---|---|
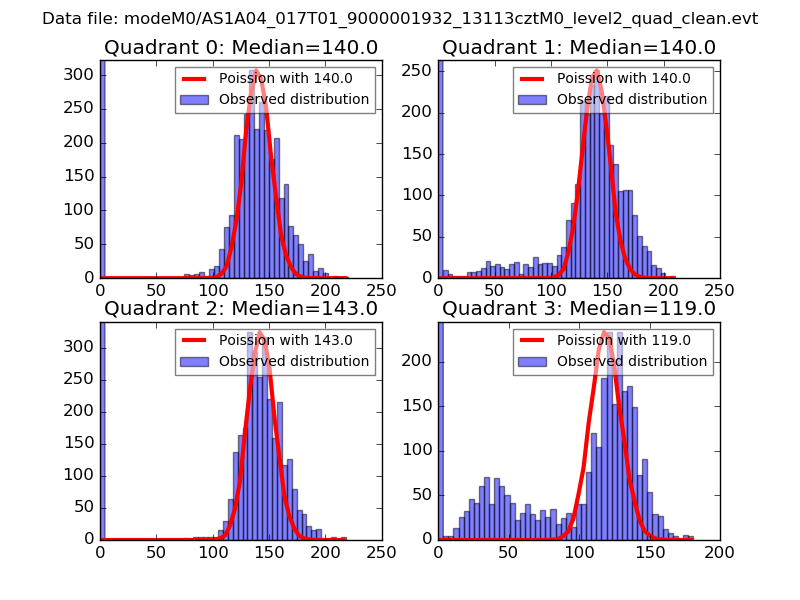
| Comparison with Poisson distribution Blue bars denote a histogram of data divided into 1 sec bins. Red curve is a Poisson curve with rate = median count rate of data. |
 |
 |
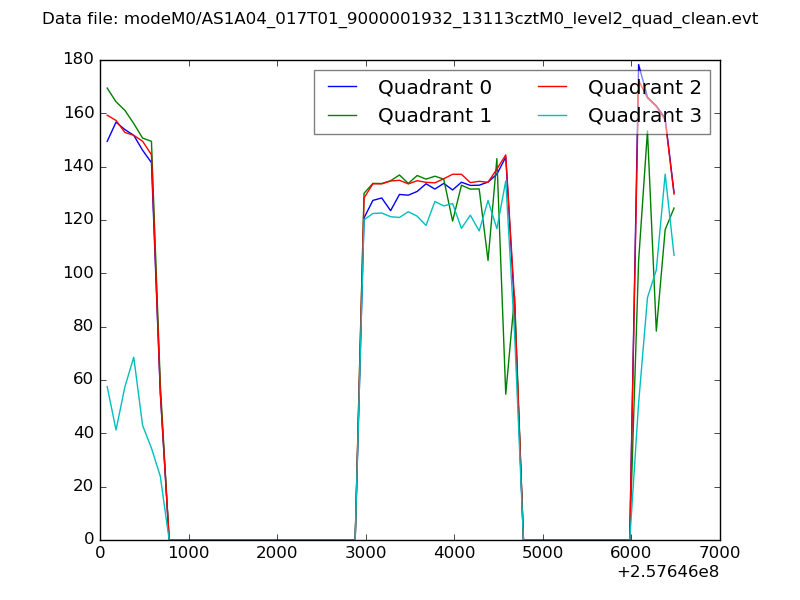
| Quadrant-wise count rates Data is divided into 100 sec bins |
 |
|
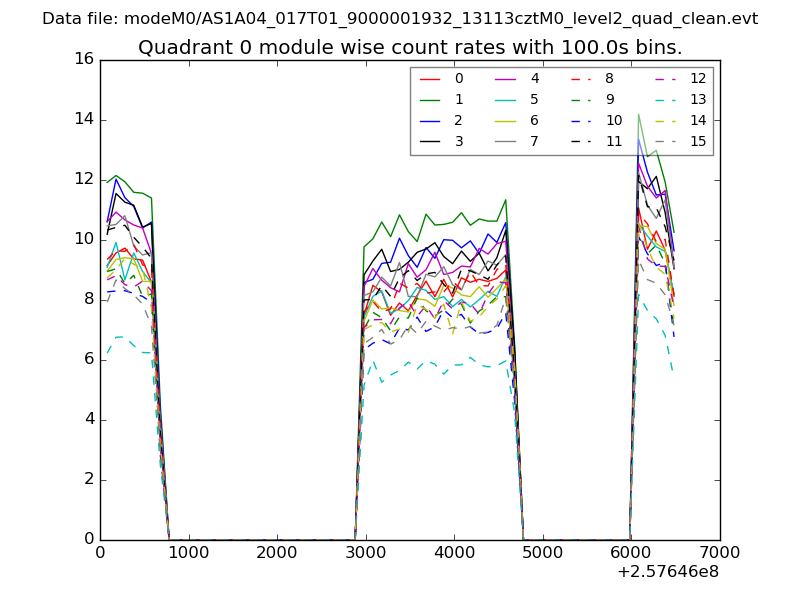
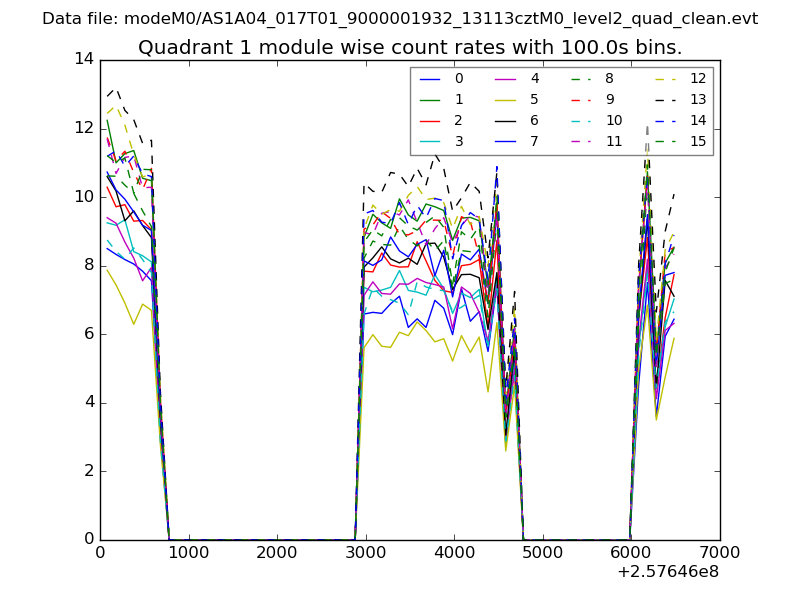
| Module-wise count rates for Quadrant A Data is divided into 100 sec bins |
 |
 |
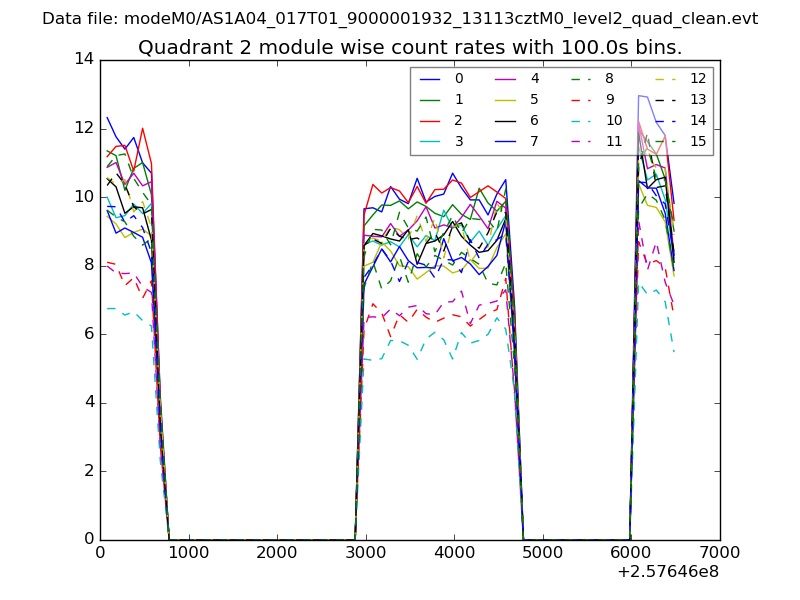
| Module-wise count rates for Quadrant B Data is divided into 100 sec bins |
 |
 |
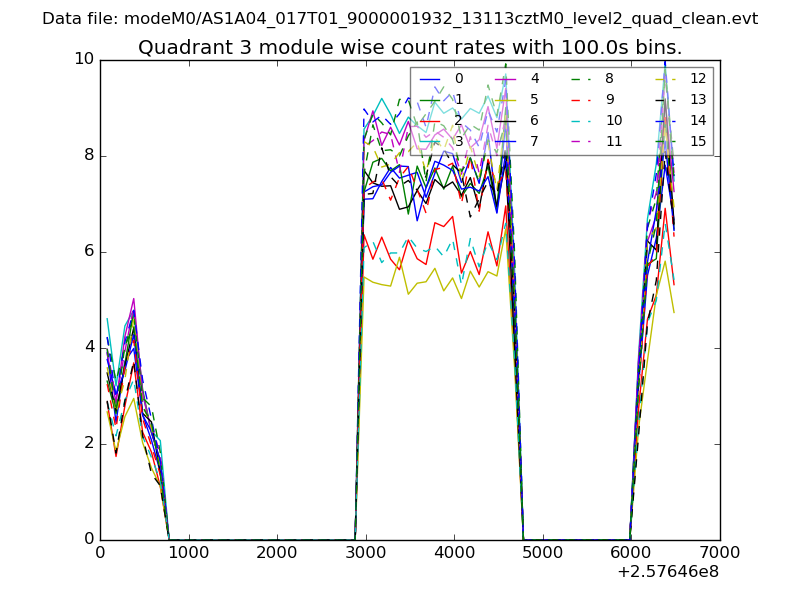
| Module-wise count rates for Quadrant C Data is divided into 100 sec bins |
 |
 |
| Module-wise count rates for Quadrant D Data is divided into 100 sec bins |
 |
 |
| Parameter | Plot |
|---|---|
| CZT HV Monitor | 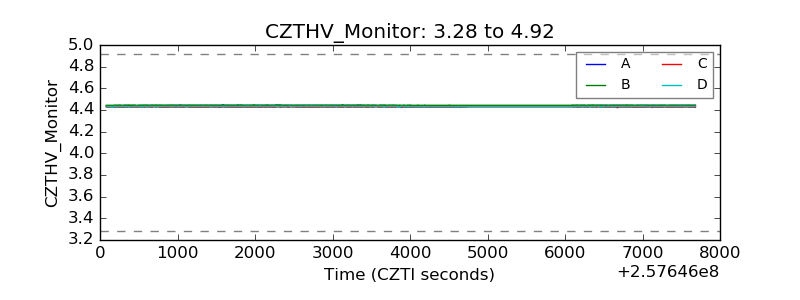 |
| D_VDD | 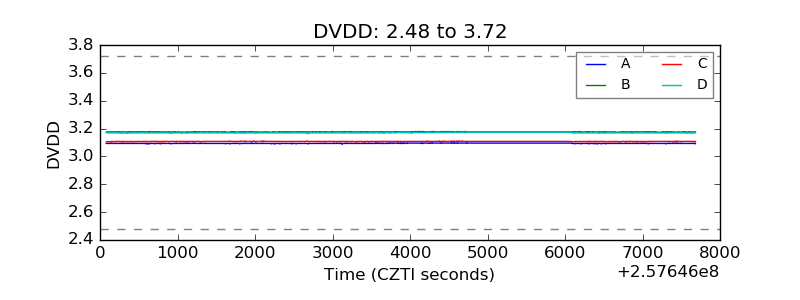 |
| Temperature 1 | 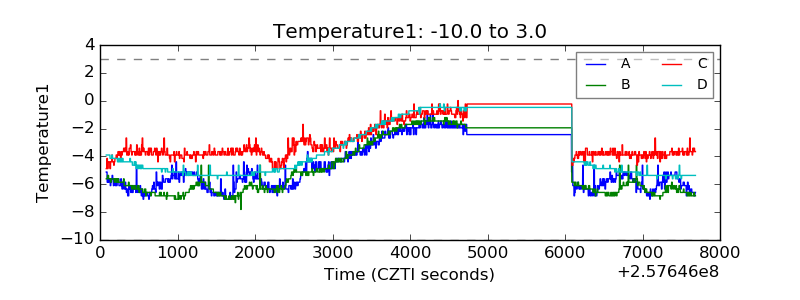 |
| Veto HV Monitor |  |
| Veto LLD | 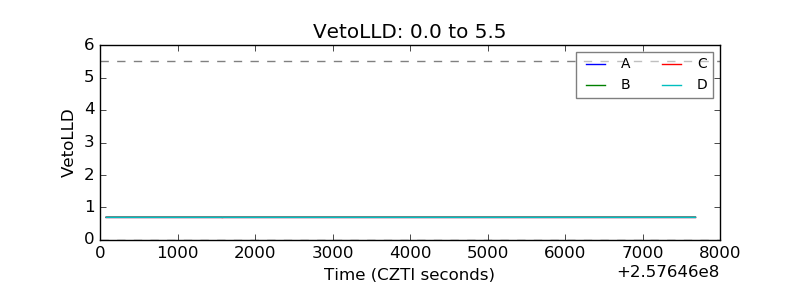 |
| Alpha Counter | 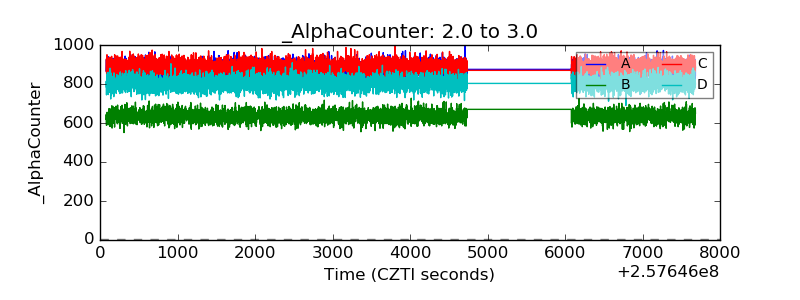 |
| _CPM_Rate | 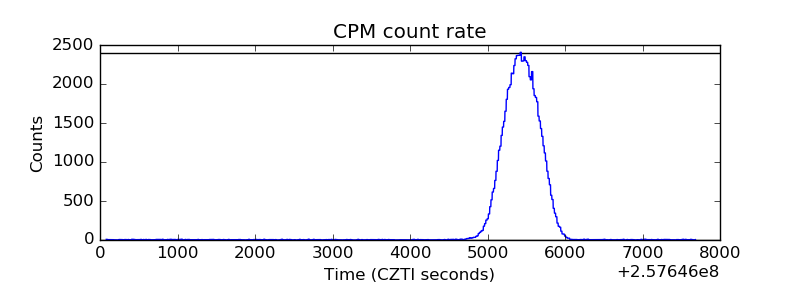 |
| CZT Counter | 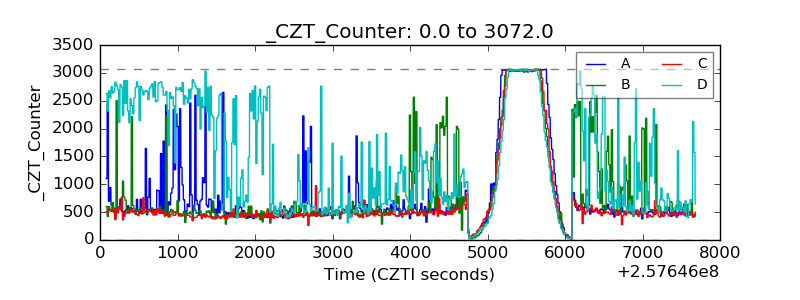 |
| +2.5 Volts monitor |  |
| +5 Volts monitor | 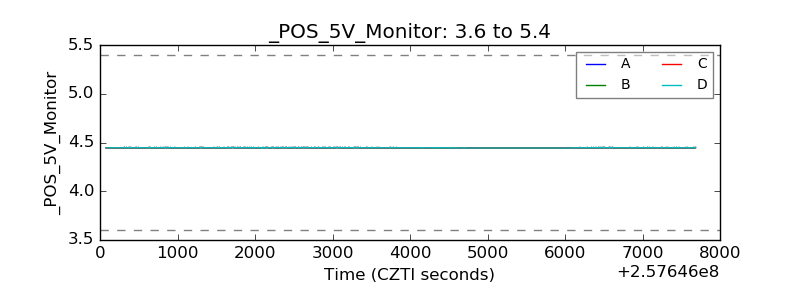 |
| _ROLL_ROT | 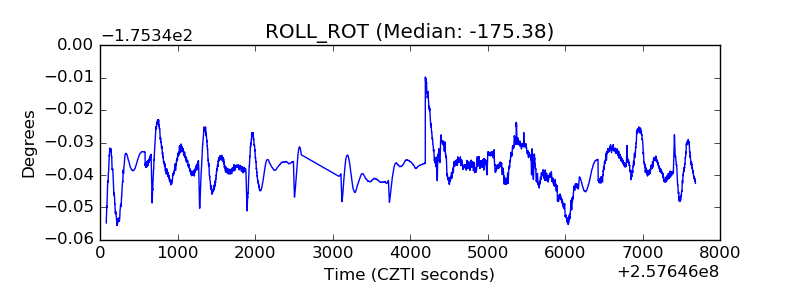 |
| _Roll_DEC | 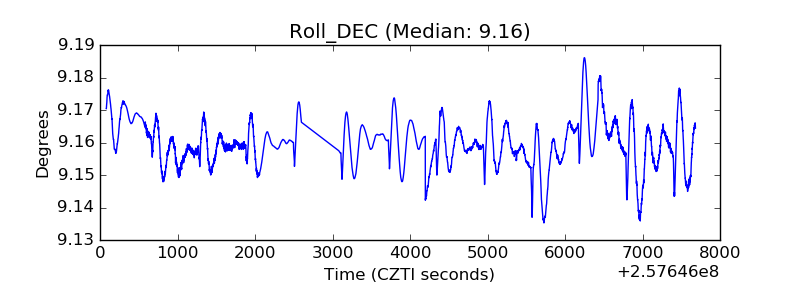 |
| _Roll_RA | 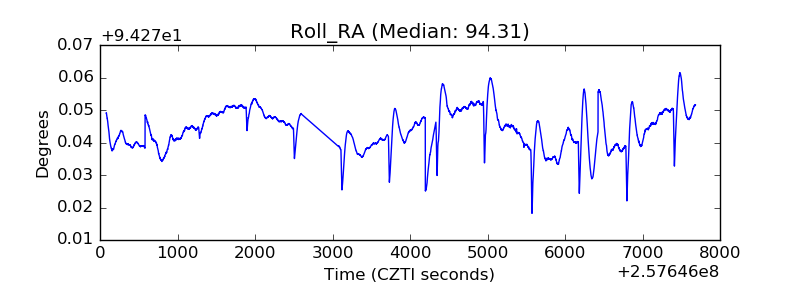 |
| Veto Counter | 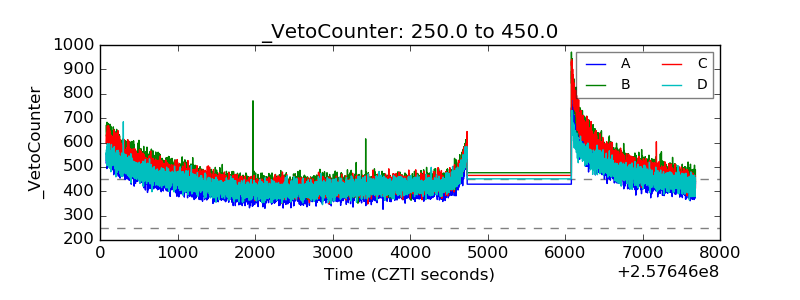 |