| Param | Original file | Final file |
|---|---|---|
| Filename | modeM0/AS1A04_017T01_9000001932_13115cztM0_level2.evt | modeM0/AS1A04_017T01_9000001932_13115cztM0_level2_quad_clean.evt |
| Size (bytes) | 879,543,360 | 51,099,840 |
| Size | 838.8 MB | 48.7 MB |
| Events in quadrant A | 3,400,556 | 353,581 |
| Events in quadrant B | 4,824,572 | 296,641 |
| Events in quadrant C | 2,965,574 | 360,822 |
| Events in quadrant D | 15,024,479 | 98,355 |
| Mode M0 | |||
|---|---|---|---|
| Quadrant | BADHDUFLAG | Total packets | Discarded packets |
| A | 0 | 13930 | 2 |
| B | 0 | 18189 | 1 |
| C | 0 | 12840 | 1 |
| D | 0 | 48964 | 1 |
| Mode M9 | |||
|---|---|---|---|
| Quadrant | BADHDUFLAG | Total packets | Discarded packets |
| A | 0 | 11 | 0 |
| B | 0 | 11 | 0 |
| C | 0 | 11 | 0 |
| D | 0 | 11 | 0 |
| Mode SS | |||
|---|---|---|---|
| Quadrant | BADHDUFLAG | Total packets | Discarded packets |
| A | 0 | 126 | 0 |
| B | 0 | 126 | 0 |
| C | 0 | 126 | 0 |
| D | 0 | 126 | 0 |
| Quadrant | Total seconds | Saturated seconds | Saturation percentage |
|---|---|---|---|
| A | 6246 | 143 | 2.289465% |
| B | 6246 | 847 | 13.560679% |
| C | 6246 | 48 | 0.768492% |
| D | 6246 | 5238 | 83.861671% |
Noise dominated data is calculated using 1-second bins in cleaned event files. If a bin has >2000 counts, and if more than 50% of those come from <1% of pixels, then it is considered to be noise-dominated and hence unusable.
| Quadrant | # 1 sec bins | Bins with >0 counts | Bins with >2000 counts | High rate bins dominated by noise | Noise dominated (total time) | Noise dominated (detector-on time) | Marked lightcurve |
|---|---|---|---|---|---|---|---|
| A | 7387 | 6248 | 31 | 31 | 0.42% | 0.50% | 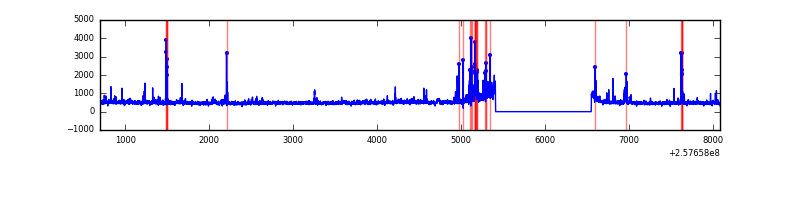 |
| B | 7387 | 6247 | 593 | 593 | 8.03% | 9.49% | 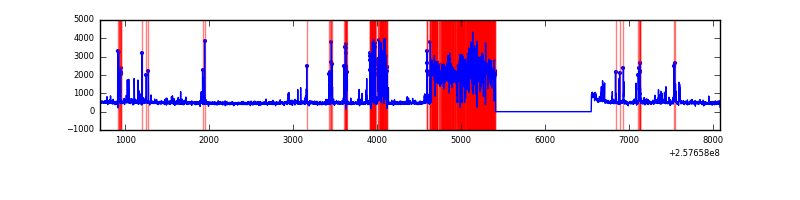 |
| C | 7387 | 6248 | 0 | 0 | 0.00% | 0.00% | 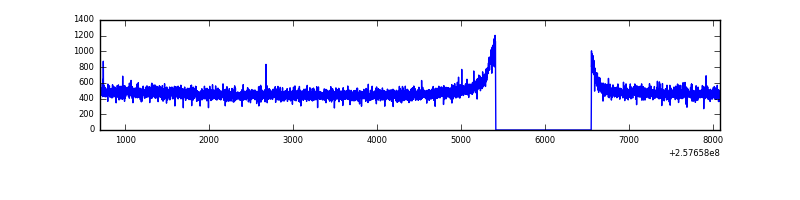 |
| D | 7387 | 6248 | 4510 | 4510 | 61.05% | 72.18% | 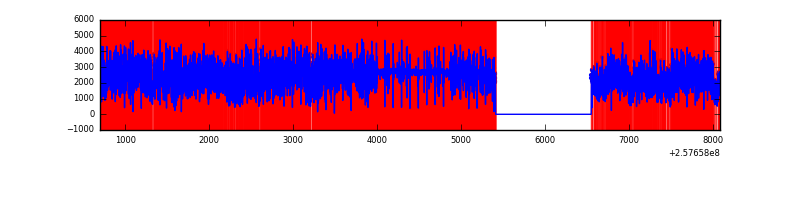 |
Top three noisy pixels from each quadrant. If the there are fewer than three noisy pixels in the level2.evt file, extra rows are filled as -1
| Pixel properties | Quadrant properties | ||||||
|---|---|---|---|---|---|---|---|
| Quadrant | DetID | PixID | Counts | Sigma | Mean | Median | Sigma |
| A | 15 | 223 | 173386 | 1092.12 | 776 | 758 | 158.1 |
| A | 12 | 189 | 114216 | 717.78 | 776 | 758 | 158.1 |
| A | 15 | 239 | 88528 | 555.27 | 776 | 758 | 158.1 |
| B | 0 | 85 | 1012163 | 7445.21 | 718 | 700 | 135.9 |
| B | 4 | 239 | 978682 | 7198.76 | 718 | 700 | 135.9 |
| B | 12 | 111 | 15379 | 108.05 | 718 | 700 | 135.9 |
| C | 13 | 61 | 5618 | 27.47 | 759 | 763 | 176.8 |
| C | 14 | 234 | 2655 | 10.7 | 759 | 763 | 176.8 |
| C | 0 | 207 | 2233 | 8.32 | 759 | 763 | 176.8 |
| D | 13 | 122 | 11526312 | 116350.26 | 405 | 392 | 99.1 |
| D | 10 | 157 | 1661750 | 16770.85 | 405 | 392 | 99.1 |
| D | 1 | 52 | 235560 | 2373.94 | 405 | 392 | 99.1 |
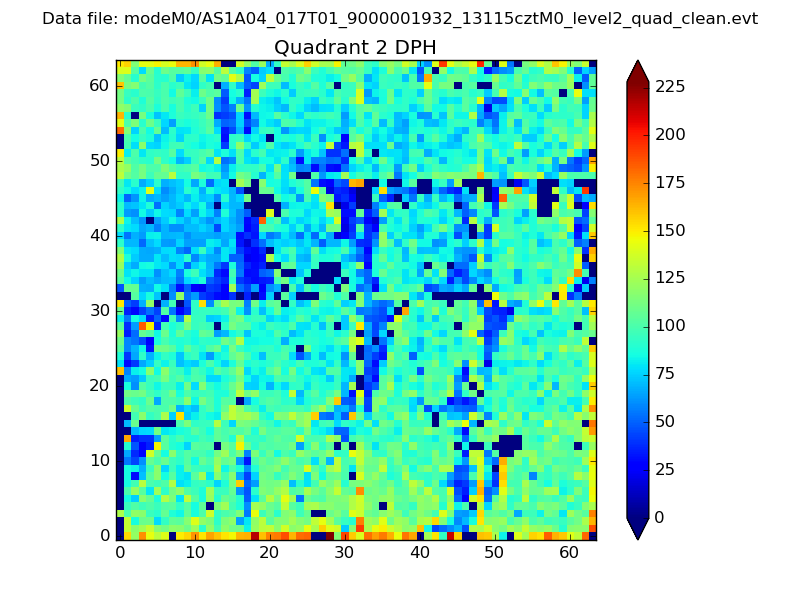
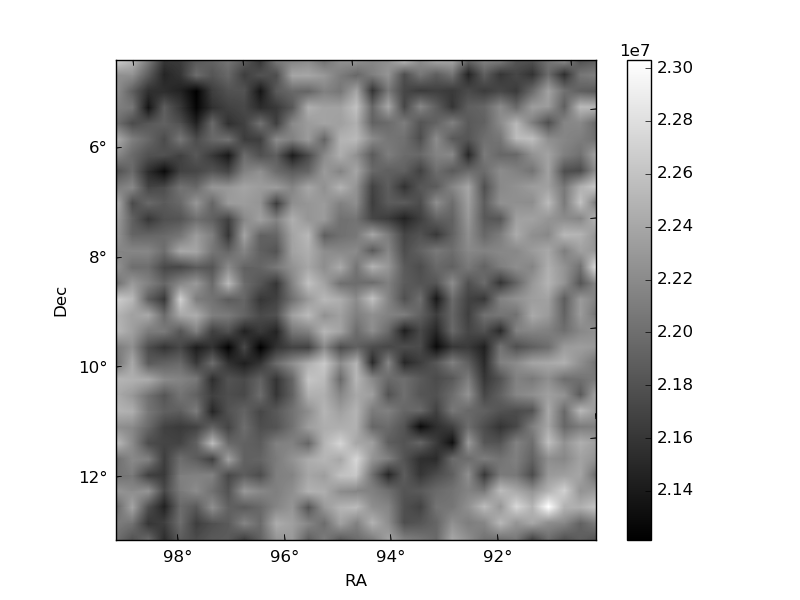
Histogram calculated using DETX and DETY for each event in the final _common_clean file
| Quadrant A | 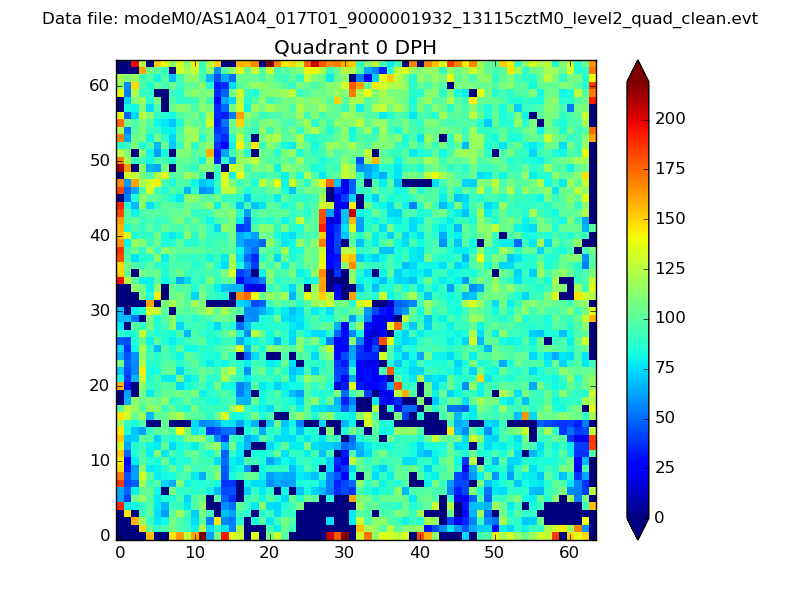 |
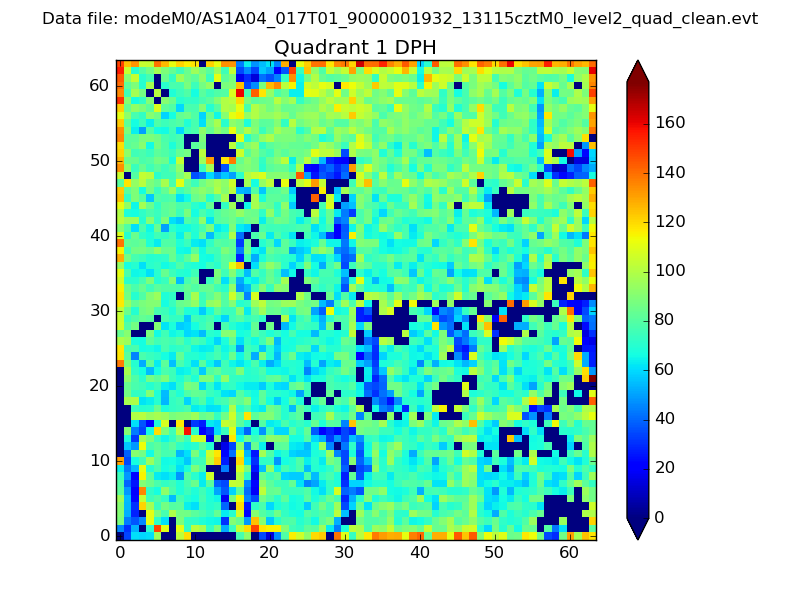 |
Quadrant B |
|---|---|---|---|
| Quadrant D | 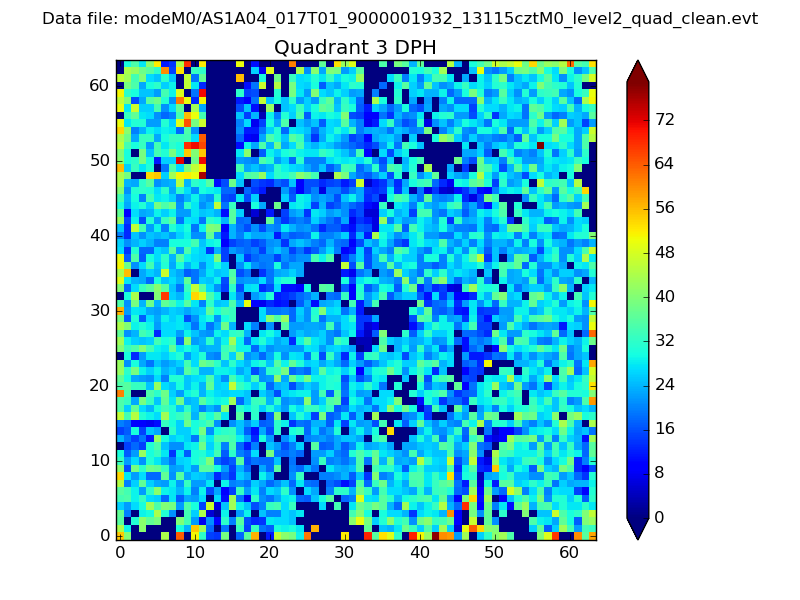 |
 |
Quadrant C |
| Plot type | Count rate plots | Images |
|---|---|---|
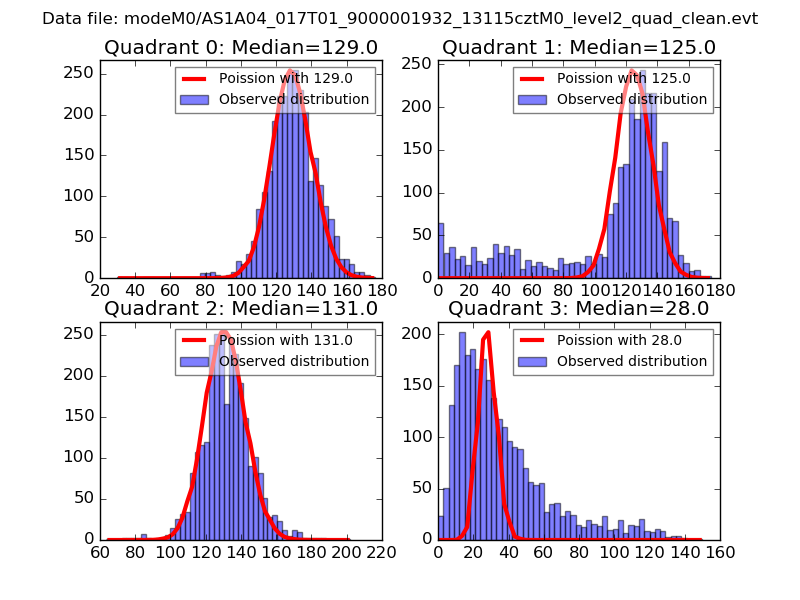
| Comparison with Poisson distribution Blue bars denote a histogram of data divided into 1 sec bins. Red curve is a Poisson curve with rate = median count rate of data. |
 |
 |
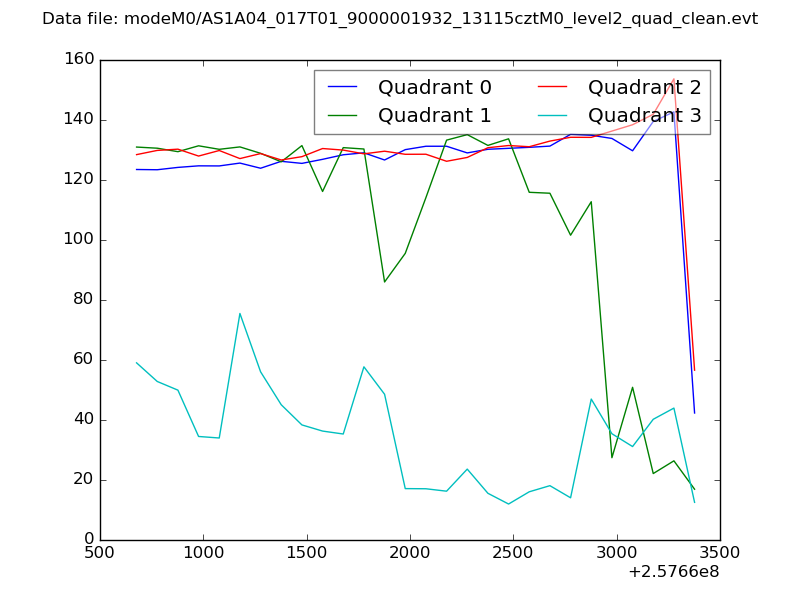
| Quadrant-wise count rates Data is divided into 100 sec bins |
 |
|
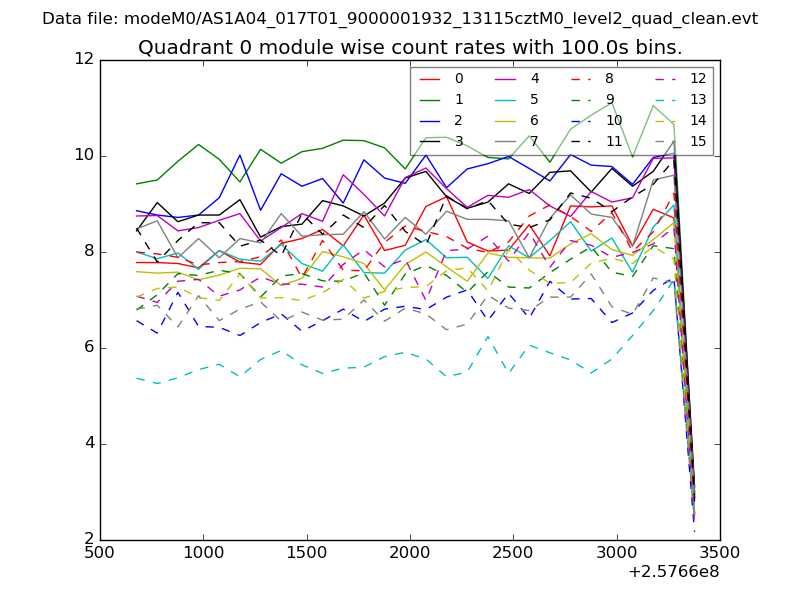
| Module-wise count rates for Quadrant A Data is divided into 100 sec bins |
 |
 |
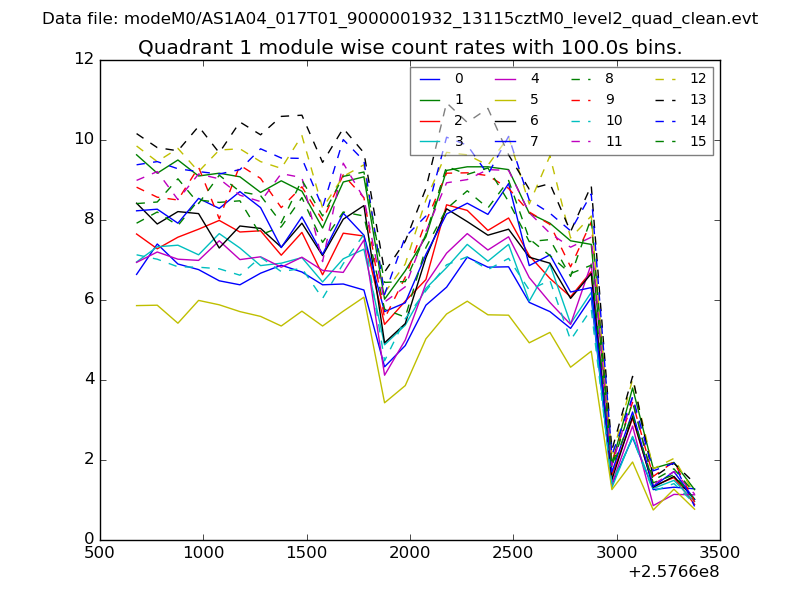
| Module-wise count rates for Quadrant B Data is divided into 100 sec bins |
 |
 |
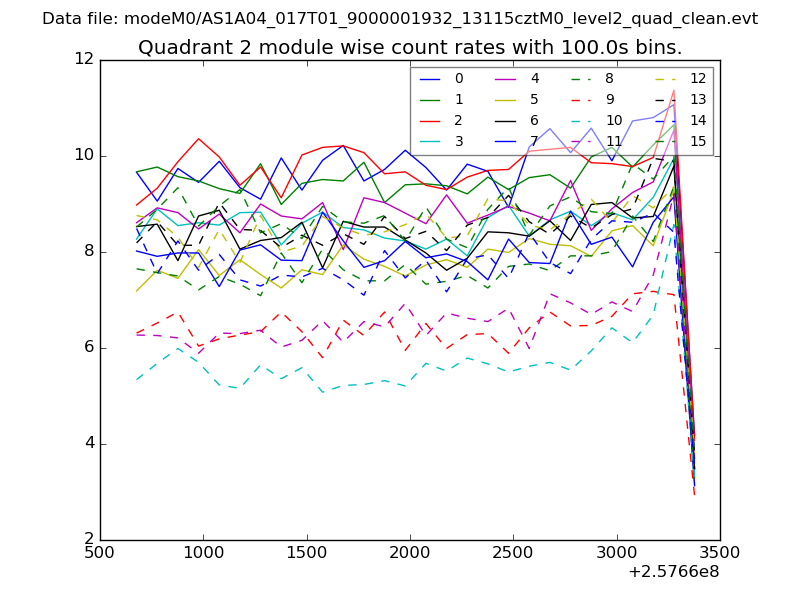
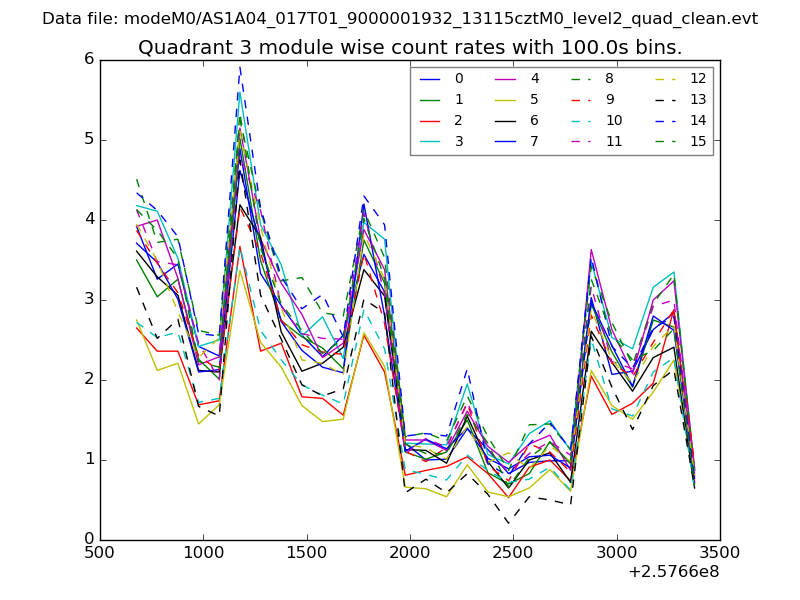
| Module-wise count rates for Quadrant C Data is divided into 100 sec bins |
 |
 |
| Module-wise count rates for Quadrant D Data is divided into 100 sec bins |
 |
 |
| Parameter | Plot |
|---|---|
| CZT HV Monitor | 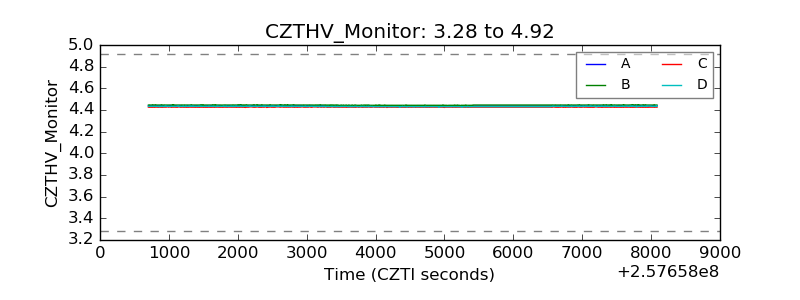 |
| D_VDD | 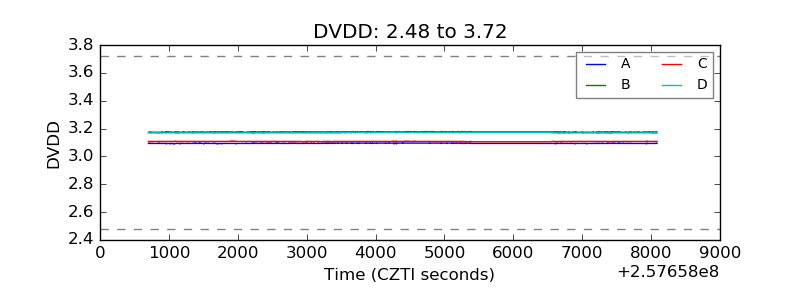 |
| Temperature 1 | 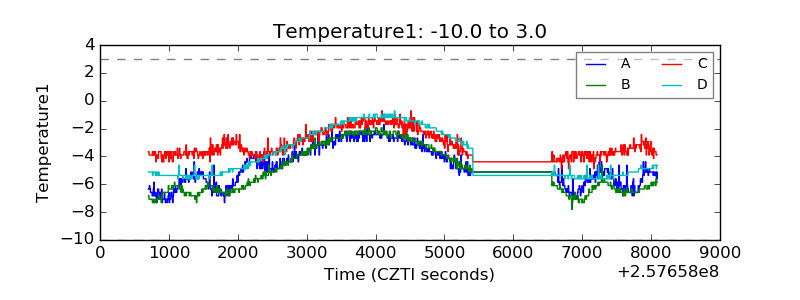 |
| Veto HV Monitor |  |
| Veto LLD | 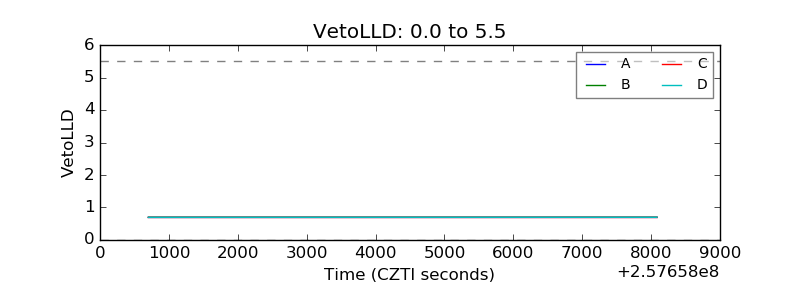 |
| Alpha Counter | 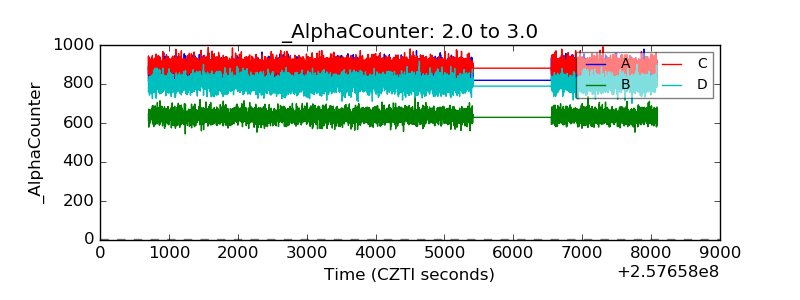 |
| _CPM_Rate | 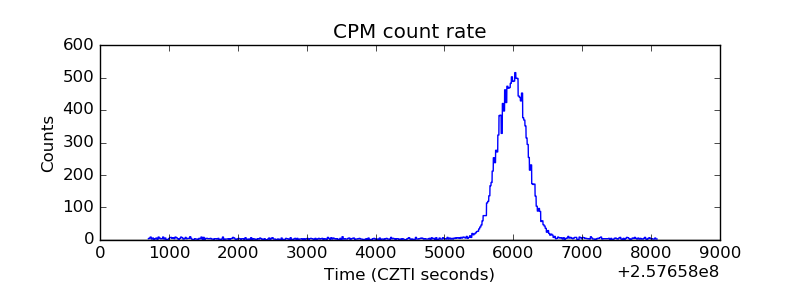 |
| CZT Counter | 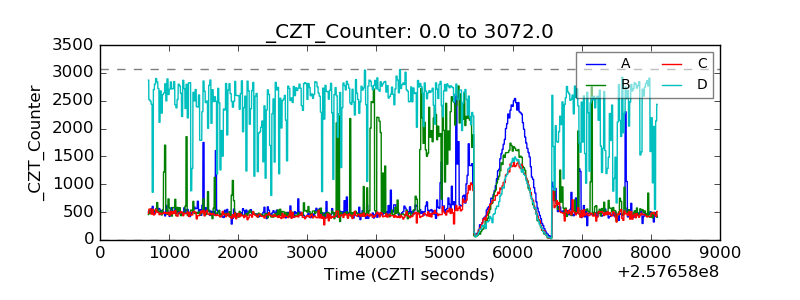 |
| +2.5 Volts monitor |  |
| +5 Volts monitor | 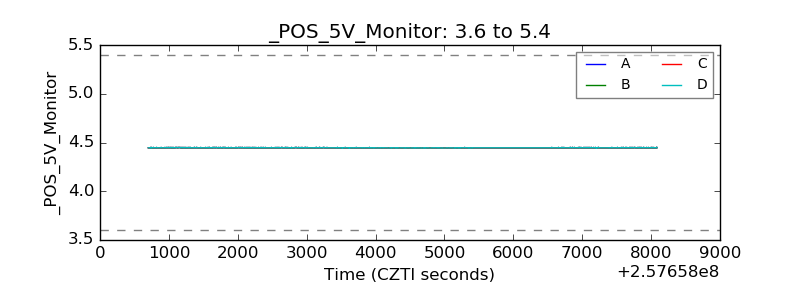 |
| _ROLL_ROT | 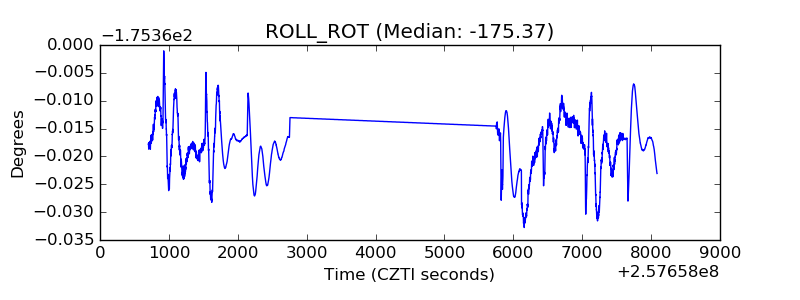 |
| _Roll_DEC | 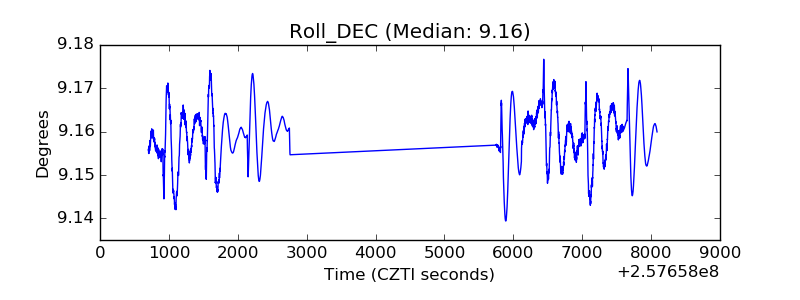 |
| _Roll_RA | 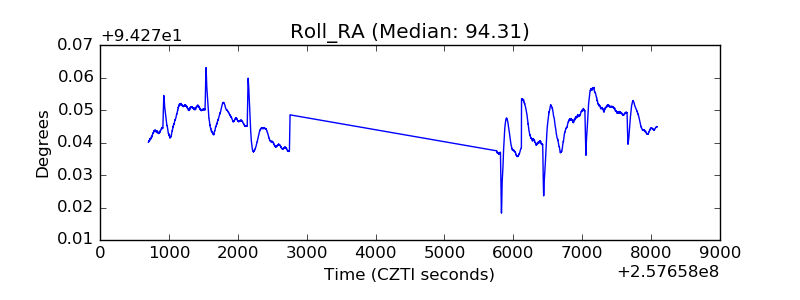 |
| Veto Counter | 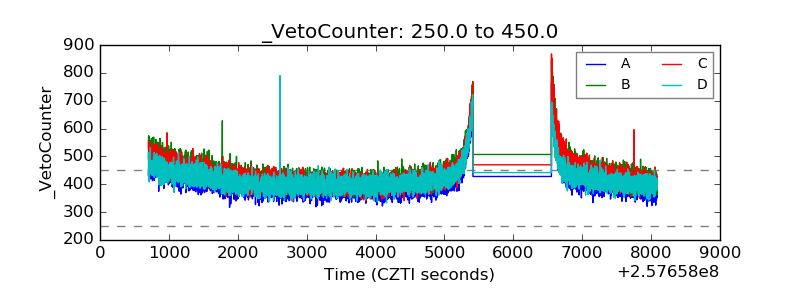 |