| Param | Original file | Final file |
|---|---|---|
| Filename | modeM0/AS1A04_017T01_9000001932_13116cztM0_level2.evt | modeM0/AS1A04_017T01_9000001932_13116cztM0_level2_quad_clean.evt |
| Size (bytes) | 894,997,440 | 63,731,520 |
| Size | 853.5 MB | 60.8 MB |
| Events in quadrant A | 3,634,569 | 427,519 |
| Events in quadrant B | 6,556,295 | 326,487 |
| Events in quadrant C | 3,110,539 | 440,726 |
| Events in quadrant D | 13,356,573 | 271,331 |
| Mode M0 | |||
|---|---|---|---|
| Quadrant | BADHDUFLAG | Total packets | Discarded packets |
| A | 0 | 14898 | 2 |
| B | 0 | 23704 | 1 |
| C | 0 | 13637 | 1 |
| D | 0 | 44291 | 1 |
| Mode M9 | |||
|---|---|---|---|
| Quadrant | BADHDUFLAG | Total packets | Discarded packets |
| A | 0 | 8 | 0 |
| B | 0 | 8 | 0 |
| C | 0 | 8 | 0 |
| D | 0 | 8 | 0 |
| Mode SS | |||
|---|---|---|---|
| Quadrant | BADHDUFLAG | Total packets | Discarded packets |
| A | 0 | 134 | 0 |
| B | 0 | 134 | 0 |
| C | 0 | 134 | 0 |
| D | 0 | 134 | 0 |
| Quadrant | Total seconds | Saturated seconds | Saturation percentage |
|---|---|---|---|
| A | 6624 | 202 | 3.049517% |
| B | 6624 | 1600 | 24.154589% |
| C | 6624 | 80 | 1.207729% |
| D | 6624 | 3979 | 60.069444% |
Noise dominated data is calculated using 1-second bins in cleaned event files. If a bin has >2000 counts, and if more than 50% of those come from <1% of pixels, then it is considered to be noise-dominated and hence unusable.
| Quadrant | # 1 sec bins | Bins with >0 counts | Bins with >2000 counts | High rate bins dominated by noise | Noise dominated (total time) | Noise dominated (detector-on time) | Marked lightcurve |
|---|---|---|---|---|---|---|---|
| A | 7440 | 6626 | 61 | 61 | 0.82% | 0.92% | 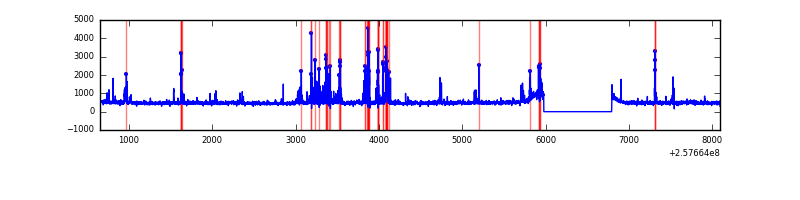 |
| B | 7440 | 6626 | 995 | 995 | 13.37% | 15.02% | 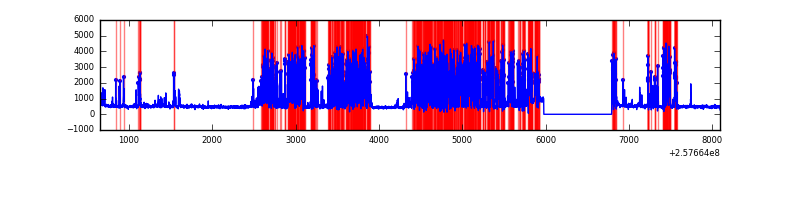 |
| C | 7440 | 6626 | 0 | 0 | 0.00% | 0.00% | 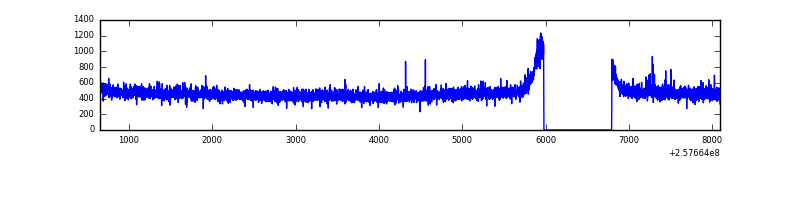 |
| D | 7440 | 6626 | 3429 | 3429 | 46.09% | 51.75% | 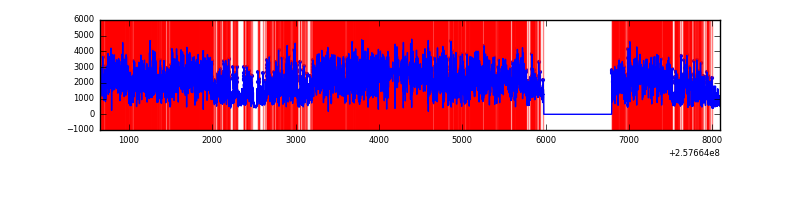 |
Top three noisy pixels from each quadrant. If the there are fewer than three noisy pixels in the level2.evt file, extra rows are filled as -1
| Pixel properties | Quadrant properties | ||||||
|---|---|---|---|---|---|---|---|
| Quadrant | DetID | PixID | Counts | Sigma | Mean | Median | Sigma |
| A | 15 | 223 | 232424 | 1400.71 | 805 | 788 | 165.4 |
| A | 15 | 239 | 120903 | 726.34 | 805 | 788 | 165.4 |
| A | 12 | 189 | 102494 | 615.02 | 805 | 788 | 165.4 |
| B | 4 | 239 | 3763654 | 27792.93 | 701 | 684 | 135.4 |
| B | 12 | 111 | 15773 | 111.45 | 701 | 684 | 135.4 |
| B | 0 | 214 | 14816 | 104.38 | 701 | 684 | 135.4 |
| C | 0 | 207 | 14803 | 75.42 | 793 | 798 | 185.7 |
| C | 13 | 61 | 5791 | 26.89 | 793 | 798 | 185.7 |
| C | 14 | 234 | 3291 | 13.43 | 793 | 798 | 185.7 |
| D | 13 | 122 | 9545213 | 66347.84 | 592 | 576 | 143.9 |
| D | 10 | 157 | 1260644 | 8759.14 | 592 | 576 | 143.9 |
| D | 1 | 52 | 195053 | 1351.87 | 592 | 576 | 143.9 |
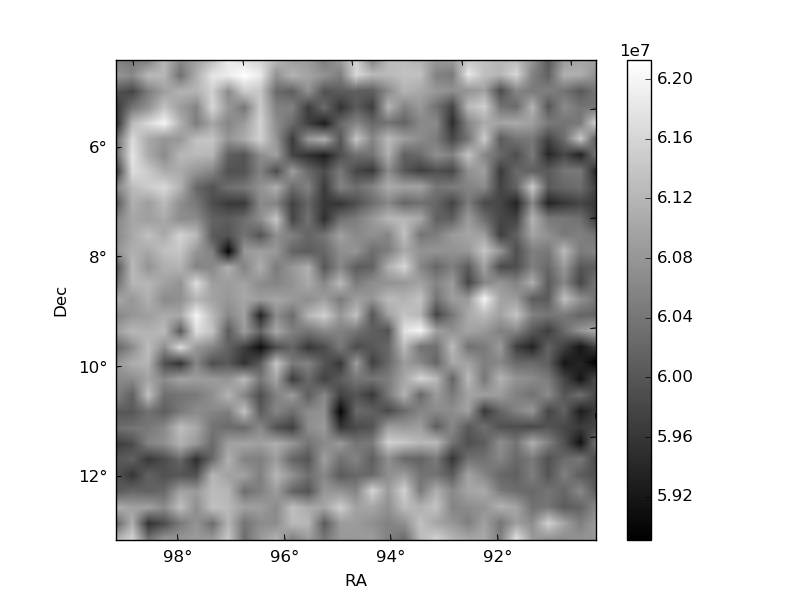
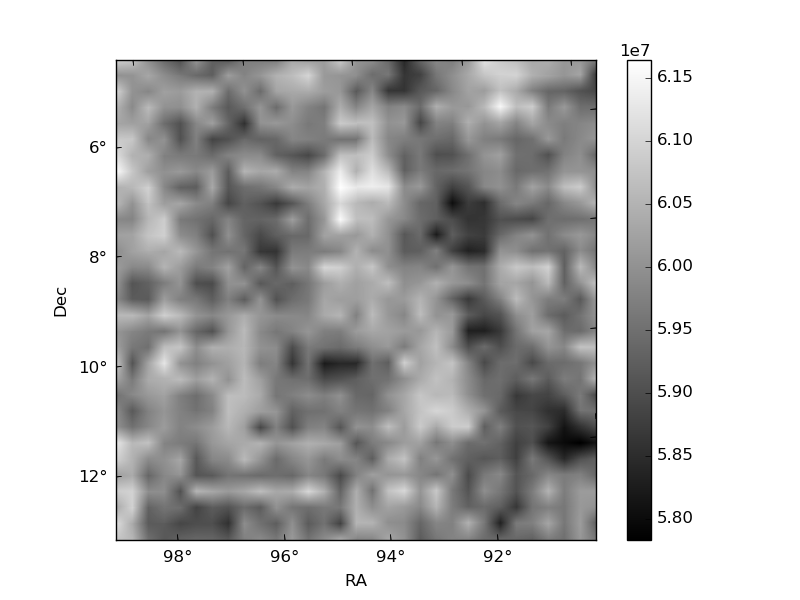
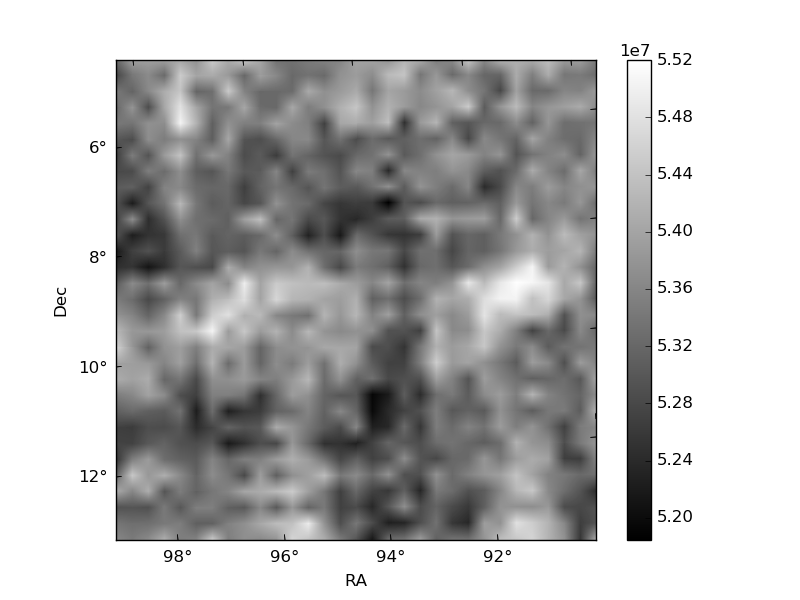
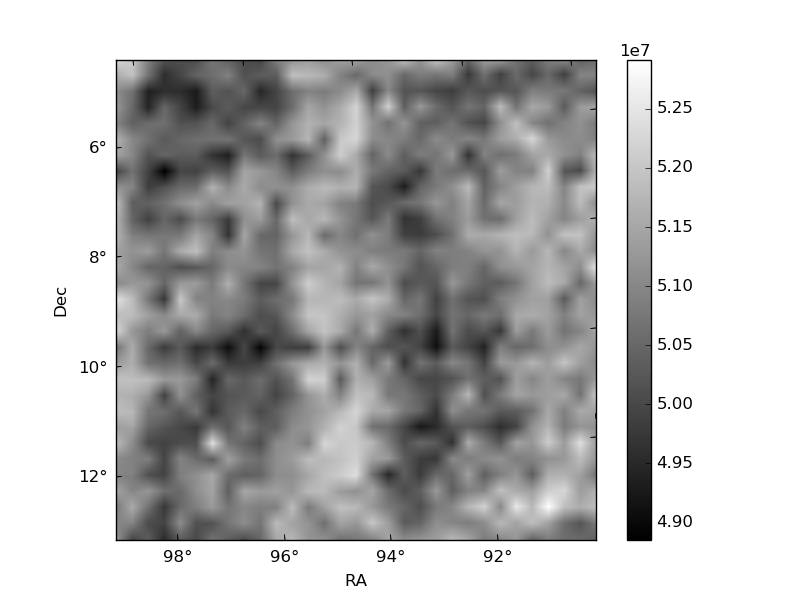
Histogram calculated using DETX and DETY for each event in the final _common_clean file
| Quadrant A | 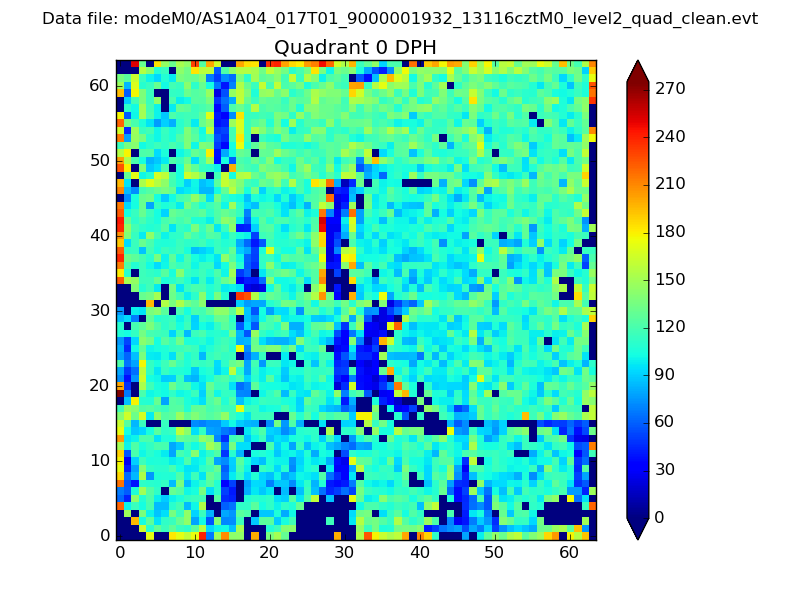 |
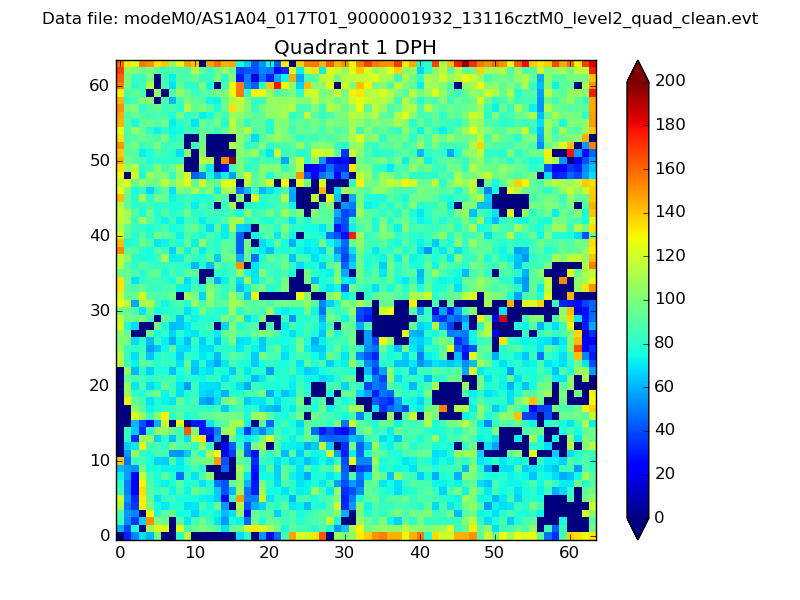 |
Quadrant B |
|---|---|---|---|
| Quadrant D | 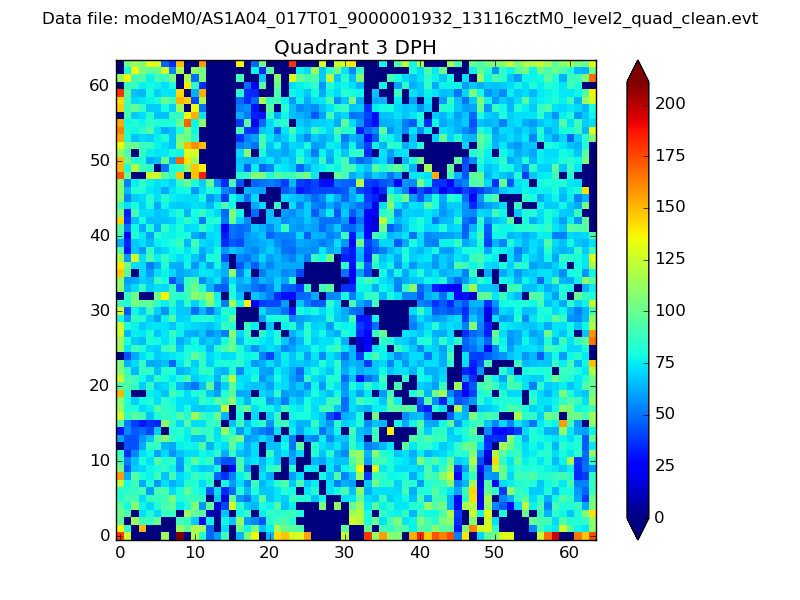 |
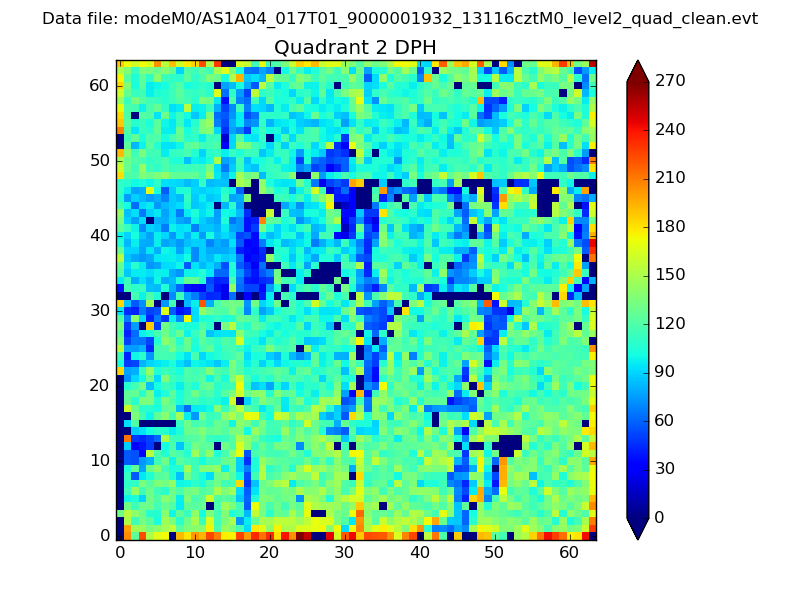 |
Quadrant C |
| Plot type | Count rate plots | Images |
|---|---|---|
| Comparison with Poisson distribution Blue bars denote a histogram of data divided into 1 sec bins. Red curve is a Poisson curve with rate = median count rate of data. |
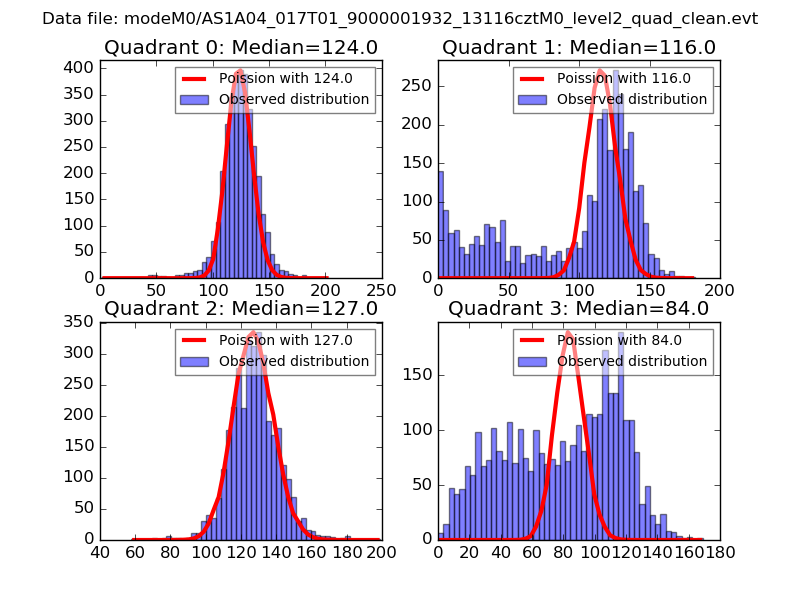 |
 |
| Quadrant-wise count rates Data is divided into 100 sec bins |
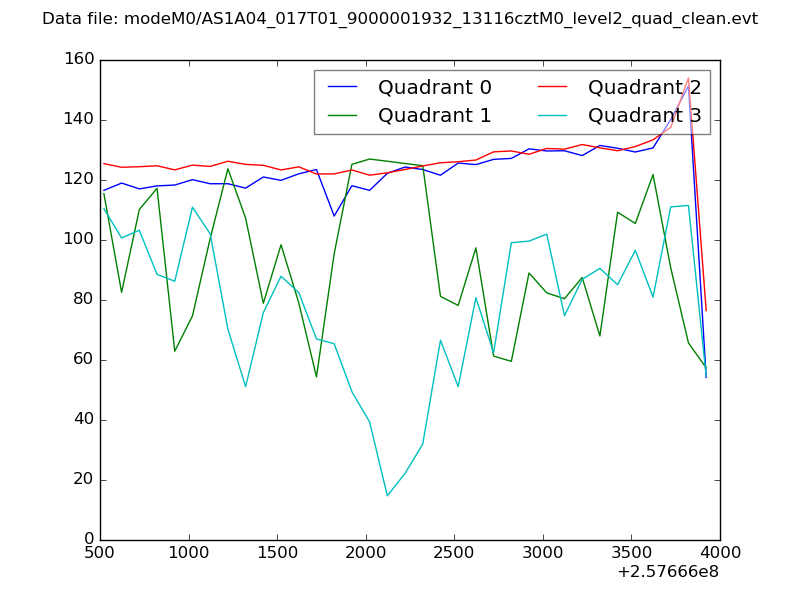 |
|
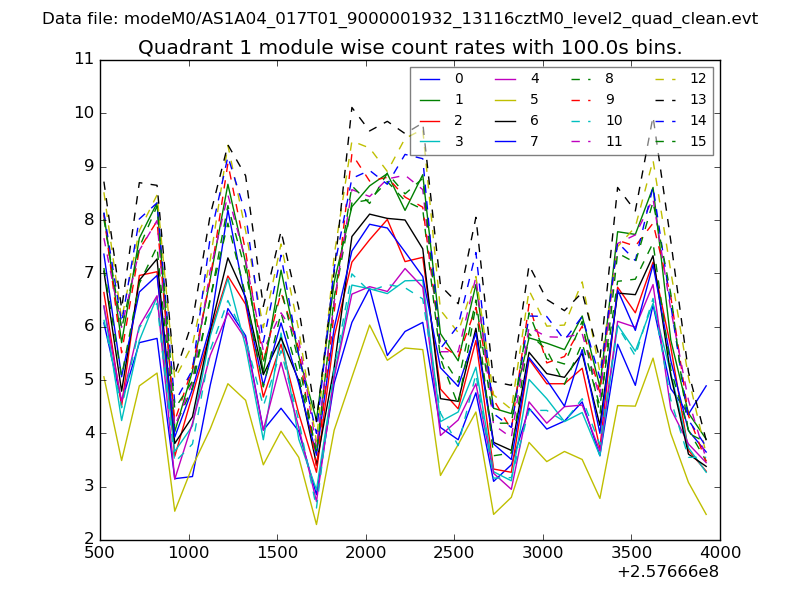
| Module-wise count rates for Quadrant A Data is divided into 100 sec bins |
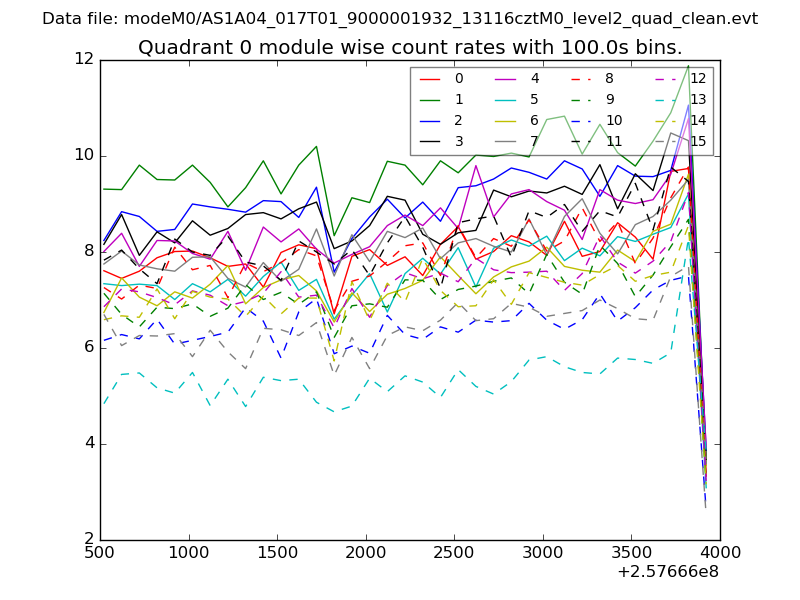 |
 |
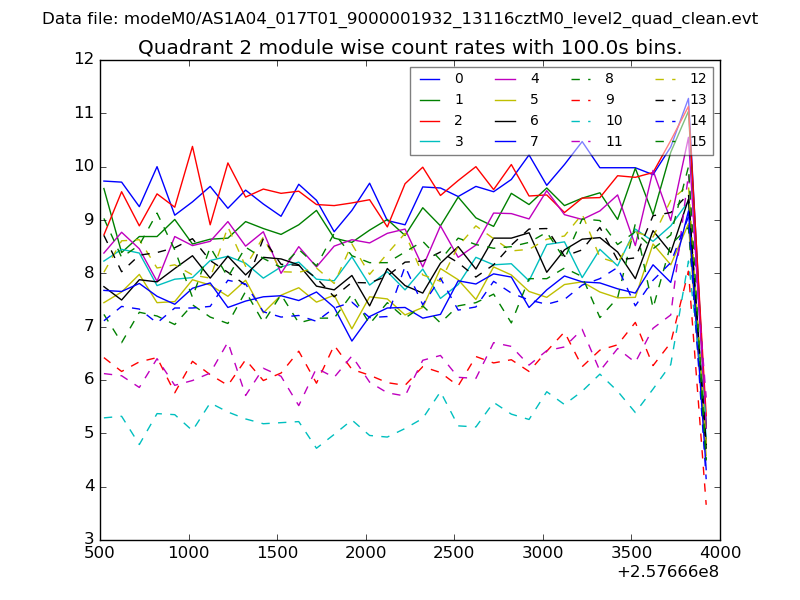
| Module-wise count rates for Quadrant B Data is divided into 100 sec bins |
 |
 |
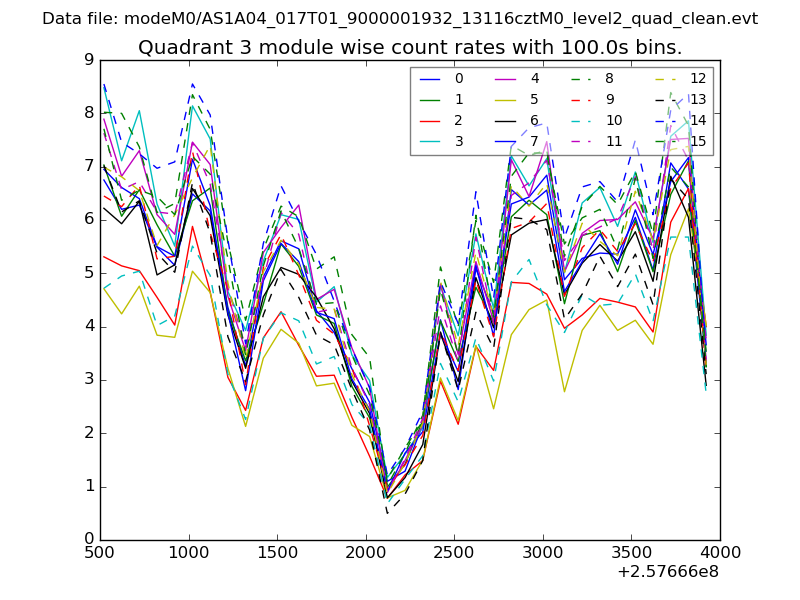
| Module-wise count rates for Quadrant C Data is divided into 100 sec bins |
 |
 |
| Module-wise count rates for Quadrant D Data is divided into 100 sec bins |
 |
 |
| Parameter | Plot |
|---|---|
| CZT HV Monitor | 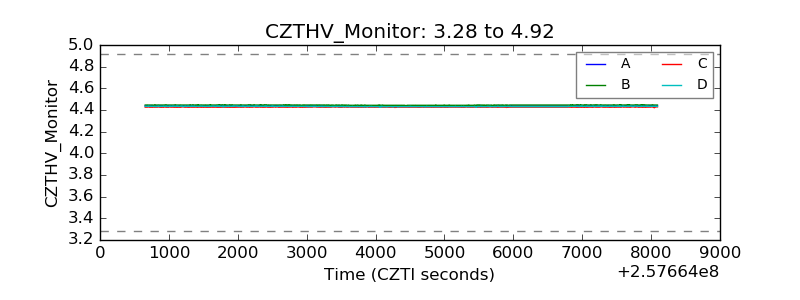 |
| D_VDD |  |
| Temperature 1 | 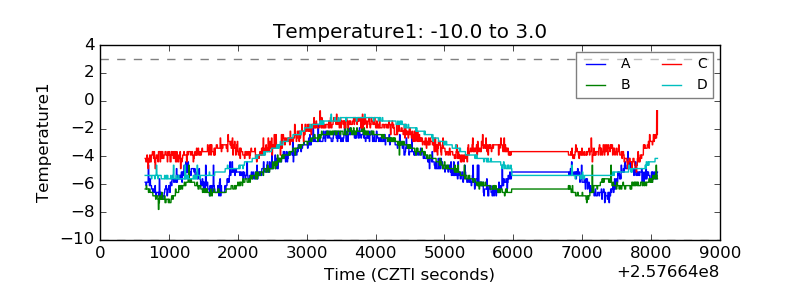 |
| Veto HV Monitor | 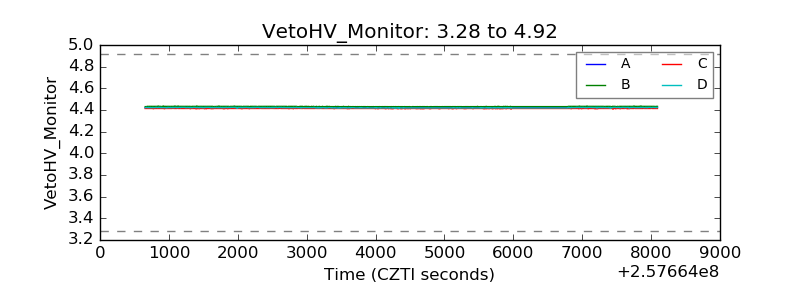 |
| Veto LLD | 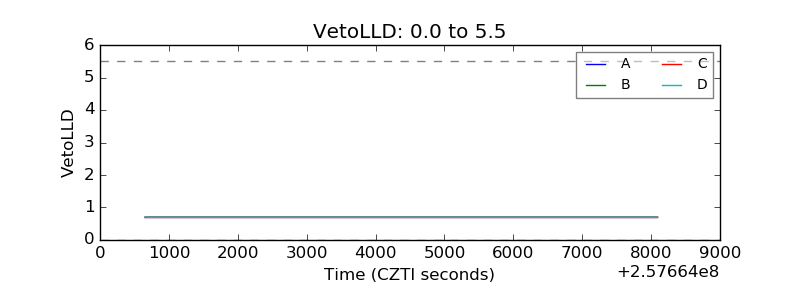 |
| Alpha Counter | 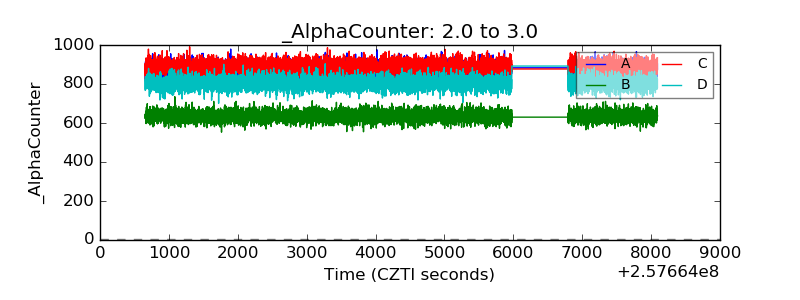 |
| _CPM_Rate | 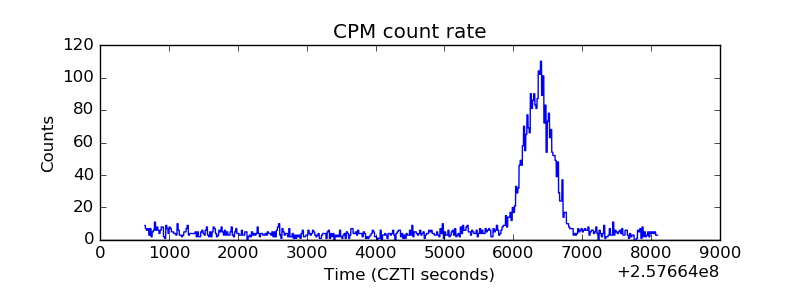 |
| CZT Counter | 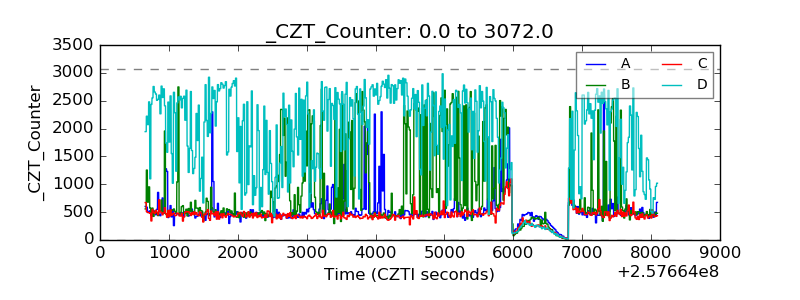 |
| +2.5 Volts monitor |  |
| +5 Volts monitor |  |
| _ROLL_ROT | 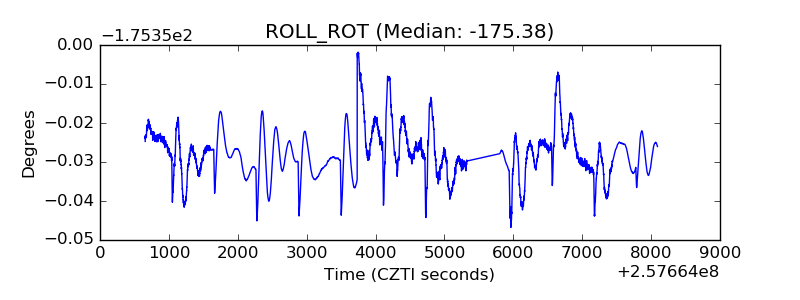 |
| _Roll_DEC | 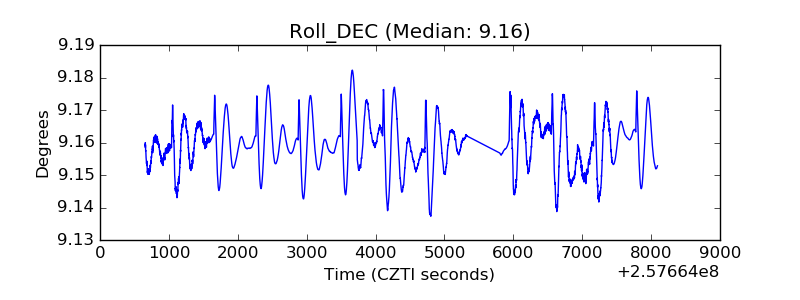 |
| _Roll_RA |  |
| Veto Counter | 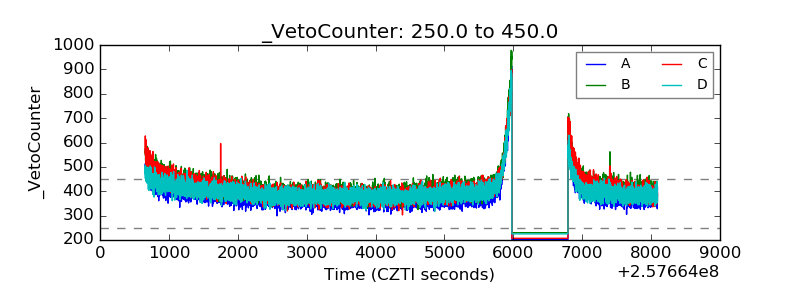 |