| Param | Original file | Final file |
|---|---|---|
| Filename | modeM0/AS1A04_017T01_9000001932_13118cztM0_level2.evt | modeM0/AS1A04_017T01_9000001932_13118cztM0_level2_quad_clean.evt |
| Size (bytes) | 711,002,880 | 81,979,200 |
| Size | 678.1 MB | 78.2 MB |
| Events in quadrant A | 6,628,511 | 481,017 |
| Events in quadrant B | 6,581,149 | 436,093 |
| Events in quadrant C | 3,649,694 | 527,542 |
| Events in quadrant D | 4,145,792 | 495,910 |
| Mode M0 | |||
|---|---|---|---|
| Quadrant | BADHDUFLAG | Total packets | Discarded packets |
| A | 0 | 24756 | 4 |
| B | 0 | 24527 | 3 |
| C | 0 | 16144 | 3 |
| D | 0 | 17568 | 3 |
| Mode M9 | |||
|---|---|---|---|
| Quadrant | BADHDUFLAG | Total packets | Discarded packets |
| A | 0 | 1 | 0 |
| B | 0 | 1 | 0 |
| C | 0 | 1 | 0 |
| D | 0 | 2 | 0 |
| Mode SS | |||
|---|---|---|---|
| Quadrant | BADHDUFLAG | Total packets | Discarded packets |
| A | 0 | 158 | 0 |
| B | 0 | 158 | 0 |
| C | 0 | 158 | 0 |
| D | 0 | 158 | 0 |
| Quadrant | Total seconds | Saturated seconds | Saturation percentage |
|---|---|---|---|
| A | 7781 | 1522 | 19.560468% |
| B | 7781 | 1551 | 19.933171% |
| C | 7781 | 207 | 2.660326% |
| D | 7781 | 269 | 3.457139% |
Noise dominated data is calculated using 1-second bins in cleaned event files. If a bin has >2000 counts, and if more than 50% of those come from <1% of pixels, then it is considered to be noise-dominated and hence unusable.
| Quadrant | # 1 sec bins | Bins with >0 counts | Bins with >2000 counts | High rate bins dominated by noise | Noise dominated (total time) | Noise dominated (detector-on time) | Marked lightcurve |
|---|---|---|---|---|---|---|---|
| A | 7892 | 7783 | 759 | 759 | 9.62% | 9.75% | 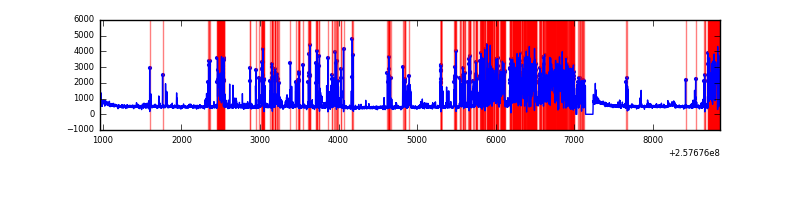 |
| B | 7892 | 7784 | 819 | 819 | 10.38% | 10.52% | 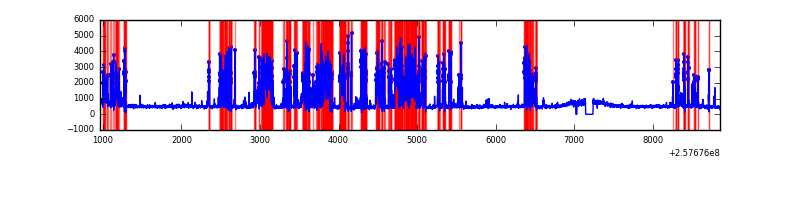 |
| C | 7892 | 7784 | 0 | 0 | 0.00% | 0.00% | 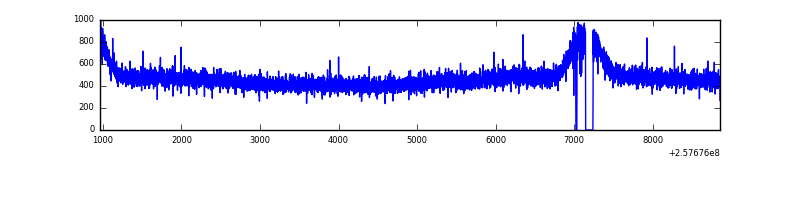 |
| D | 7892 | 7784 | 40 | 40 | 0.51% | 0.51% | 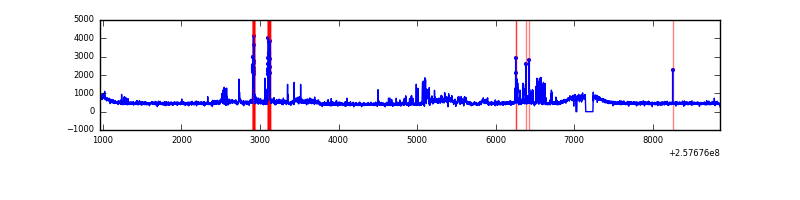 |
Top three noisy pixels from each quadrant. If the there are fewer than three noisy pixels in the level2.evt file, extra rows are filled as -1
| Pixel properties | Quadrant properties | ||||||
|---|---|---|---|---|---|---|---|
| Quadrant | DetID | PixID | Counts | Sigma | Mean | Median | Sigma |
| A | 15 | 223 | 1595132 | 9121.87 | 856 | 837 | 174.8 |
| A | 15 | 239 | 949033 | 5425.17 | 856 | 837 | 174.8 |
| A | 15 | 255 | 394954 | 2254.97 | 856 | 837 | 174.8 |
| B | 4 | 239 | 2504516 | 14966.11 | 863 | 837 | 167.3 |
| B | 0 | 85 | 592637 | 3537.57 | 863 | 837 | 167.3 |
| B | 3 | 64 | 46041 | 270.21 | 863 | 837 | 167.3 |
| C | 0 | 207 | 9658 | 39.89 | 934 | 937 | 218.6 |
| C | 13 | 61 | 6596 | 25.89 | 934 | 937 | 218.6 |
| C | 3 | 202 | 2351 | 6.47 | 934 | 937 | 218.6 |
| D | 1 | 52 | 410002 | 1829.79 | 923 | 893 | 223.6 |
| D | 13 | 122 | 131687 | 584.99 | 923 | 893 | 223.6 |
| D | 2 | 33 | 99541 | 441.22 | 923 | 893 | 223.6 |
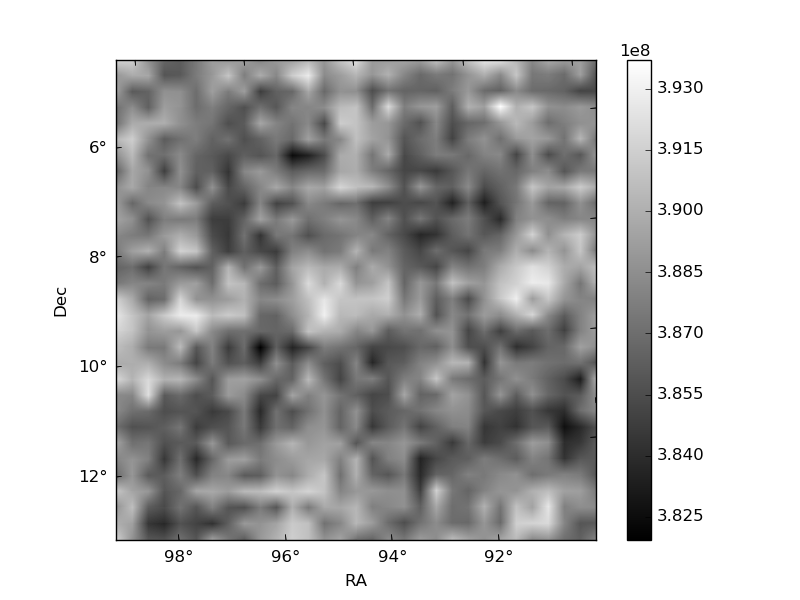
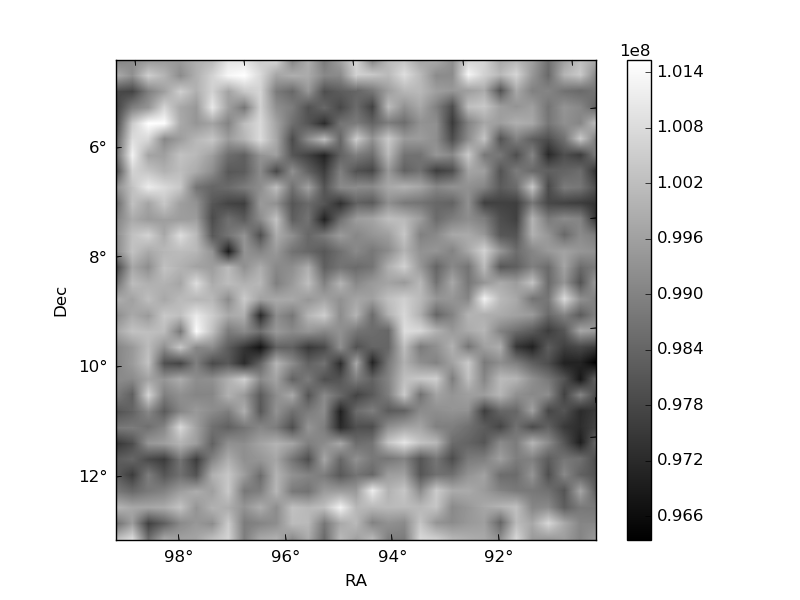
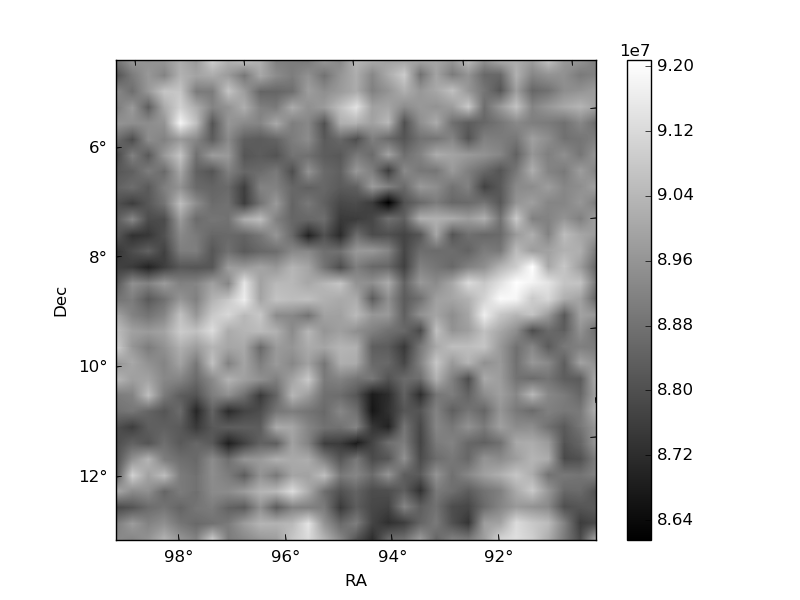
Histogram calculated using DETX and DETY for each event in the final _common_clean file
| Quadrant A | 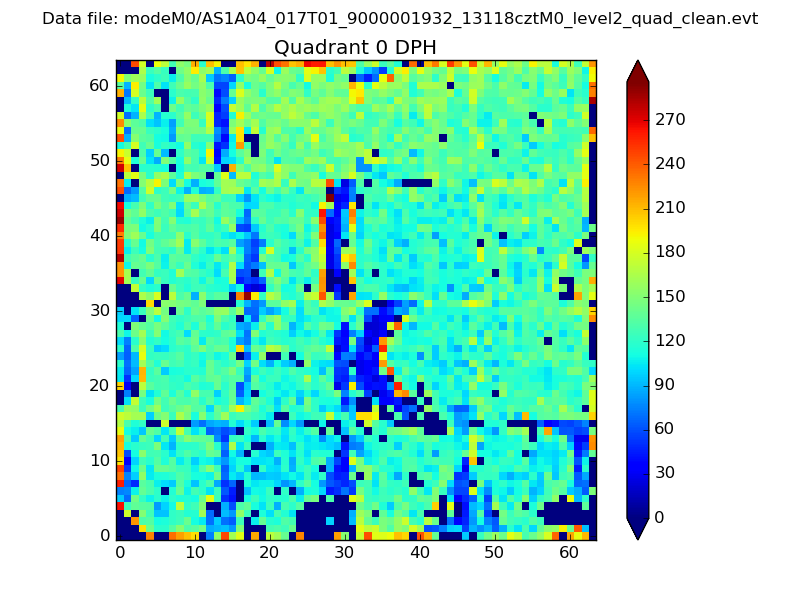 |
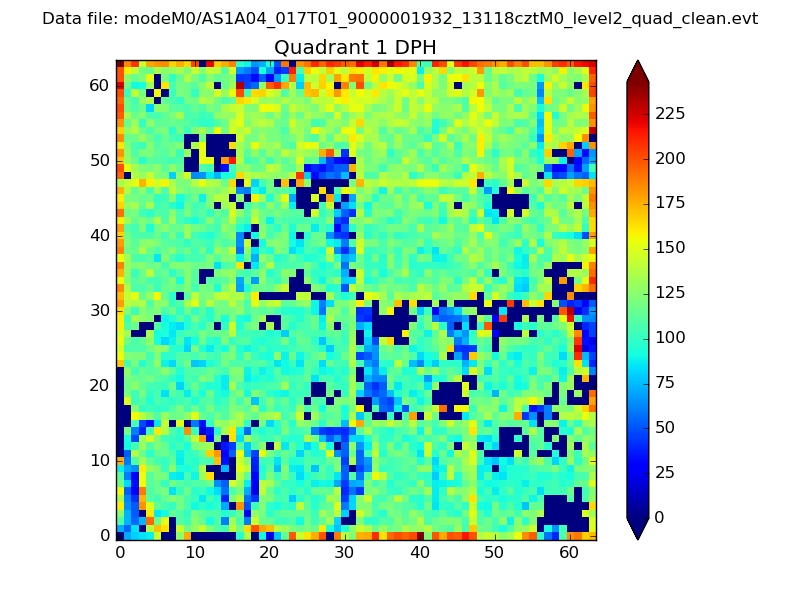 |
Quadrant B |
|---|---|---|---|
| Quadrant D | 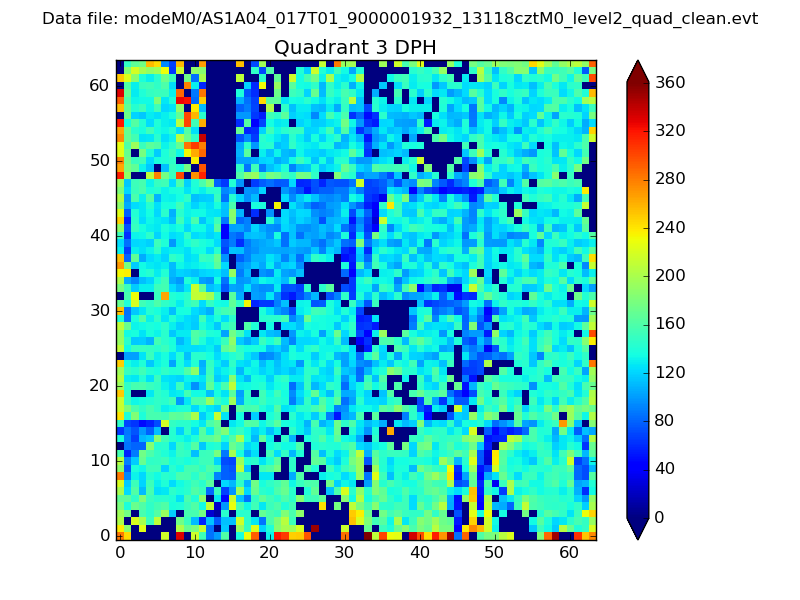 |
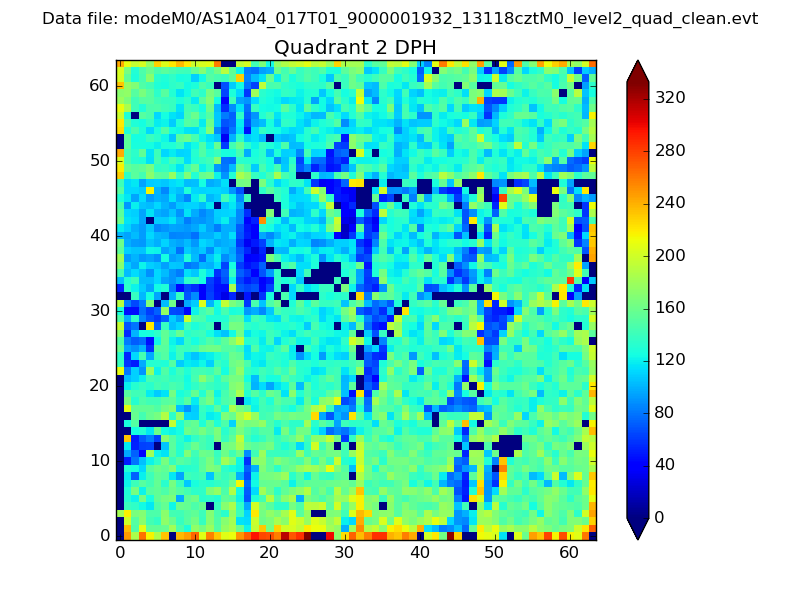 |
Quadrant C |
| Plot type | Count rate plots | Images |
|---|---|---|
| Comparison with Poisson distribution Blue bars denote a histogram of data divided into 1 sec bins. Red curve is a Poisson curve with rate = median count rate of data. |
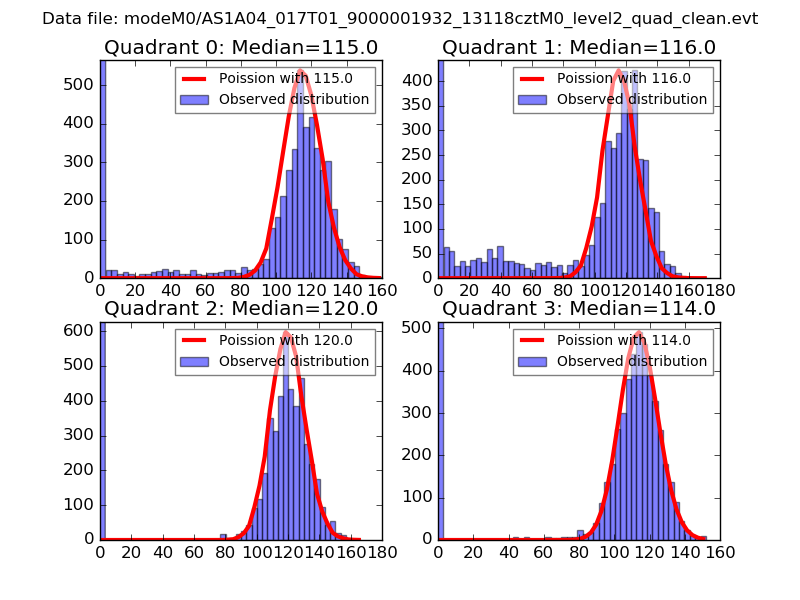 |
 |
| Quadrant-wise count rates Data is divided into 100 sec bins |
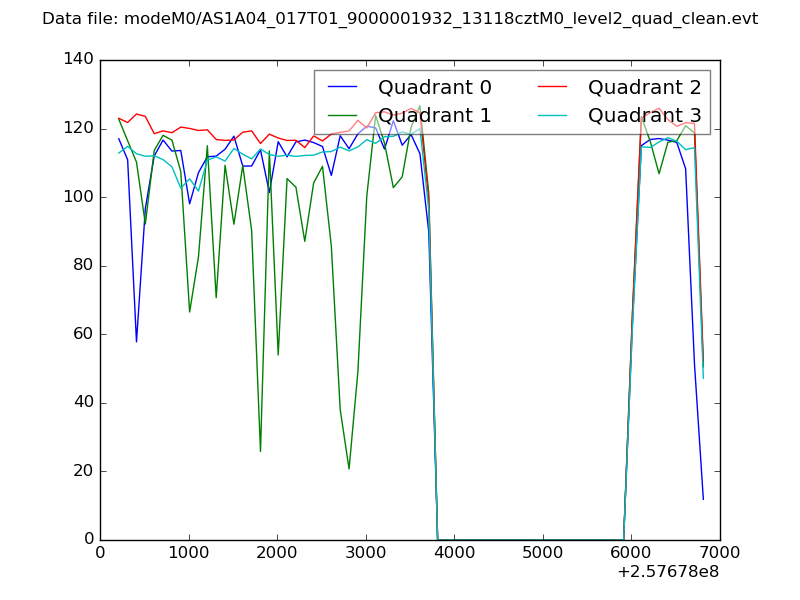 |
|
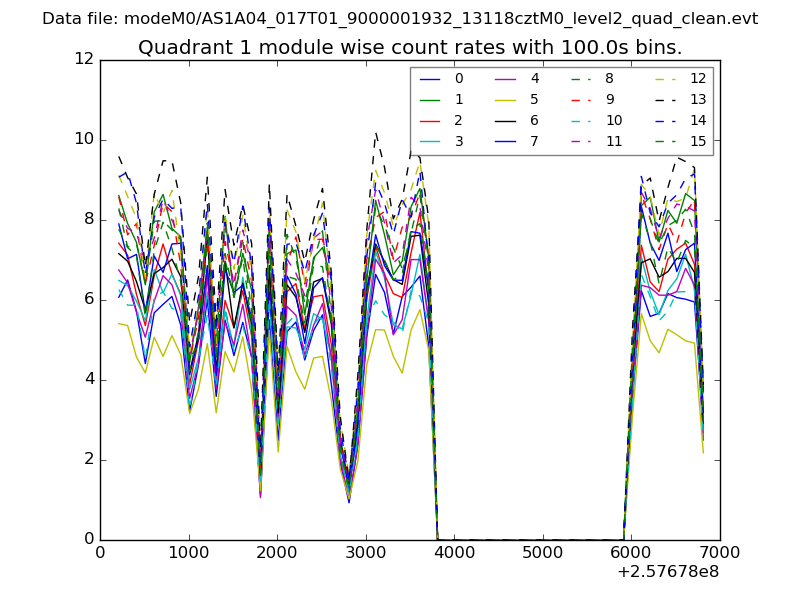
| Module-wise count rates for Quadrant A Data is divided into 100 sec bins |
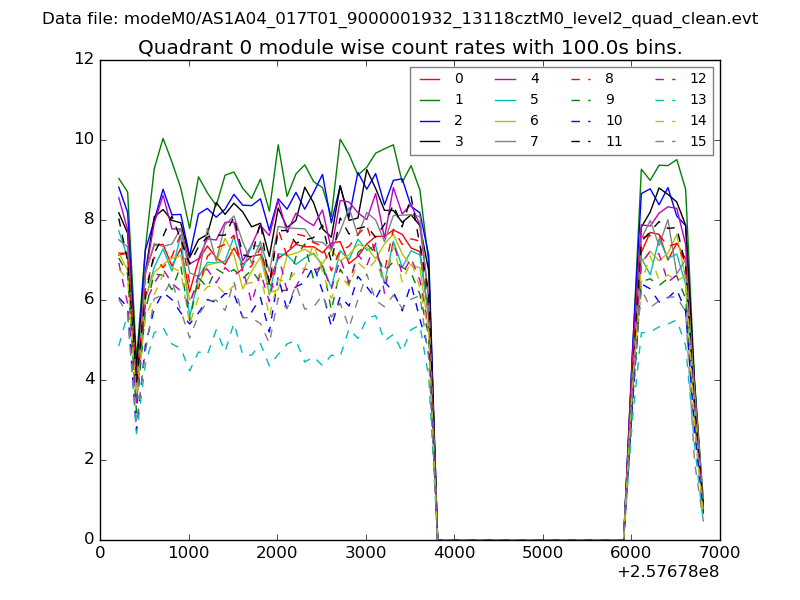 |
 |
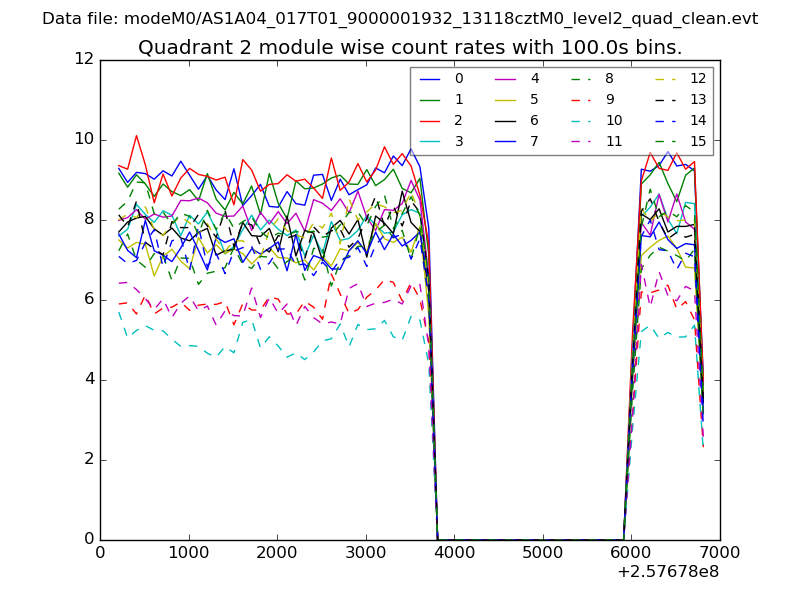
| Module-wise count rates for Quadrant B Data is divided into 100 sec bins |
 |
 |
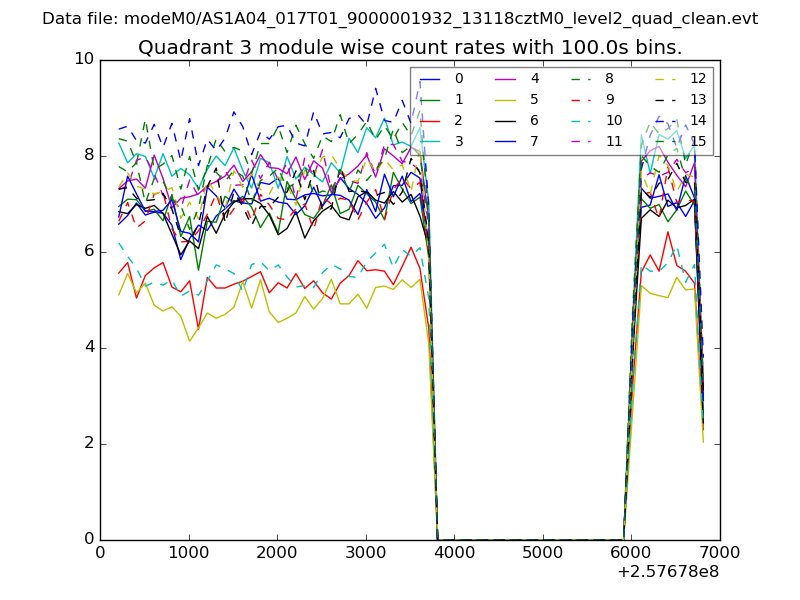
| Module-wise count rates for Quadrant C Data is divided into 100 sec bins |
 |
 |
| Module-wise count rates for Quadrant D Data is divided into 100 sec bins |
 |
 |
| Parameter | Plot |
|---|---|
| CZT HV Monitor | 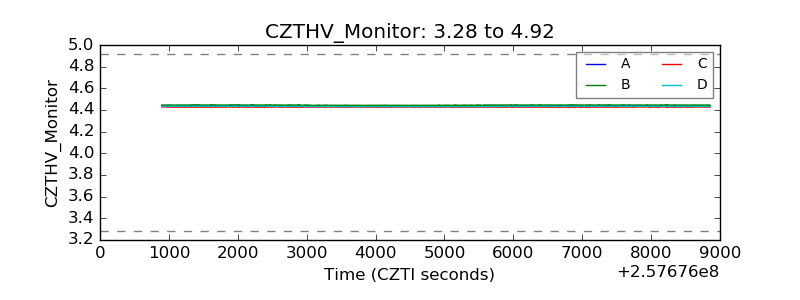 |
| D_VDD | 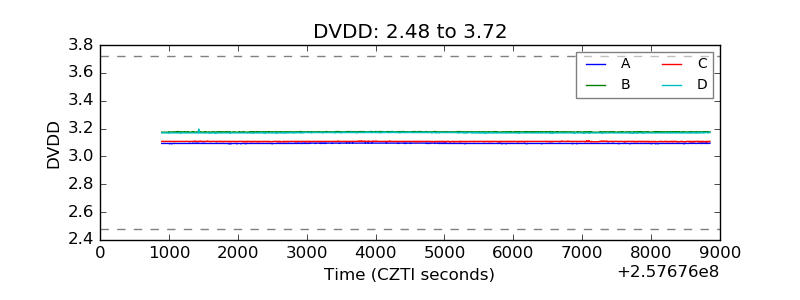 |
| Temperature 1 | 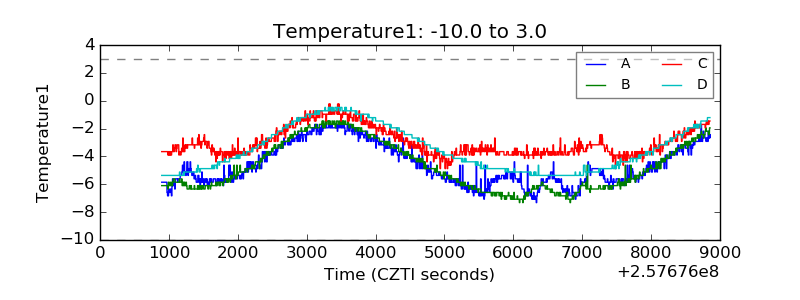 |
| Veto HV Monitor | 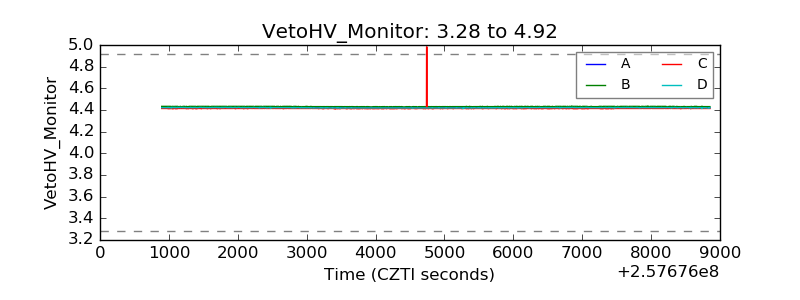 |
| Veto LLD | 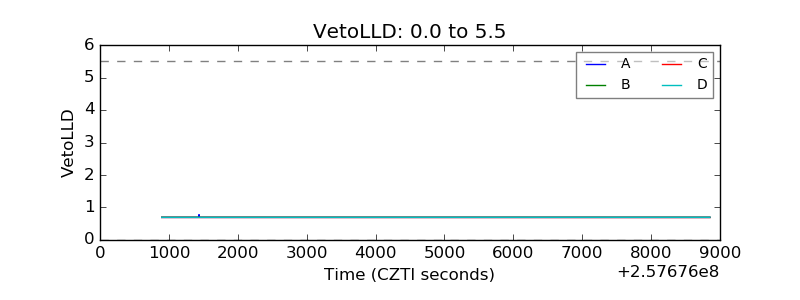 |
| Alpha Counter | 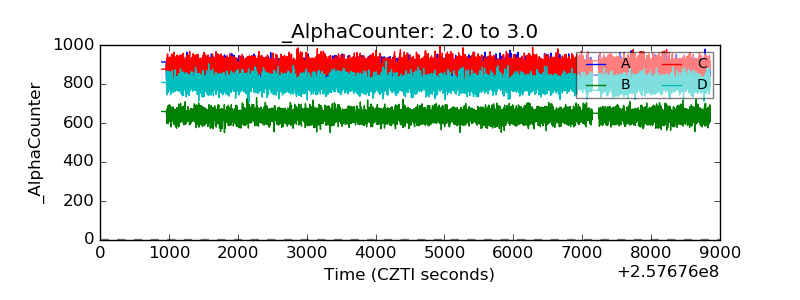 |
| _CPM_Rate | 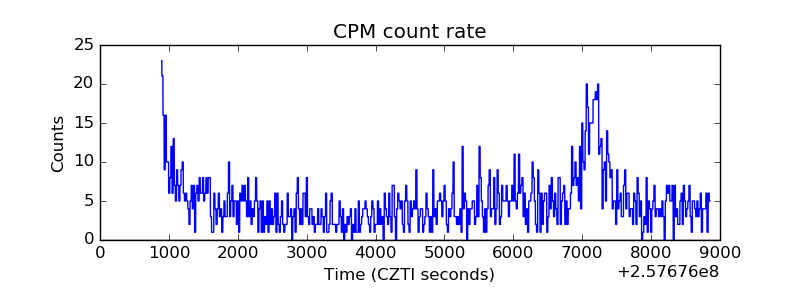 |
| CZT Counter | 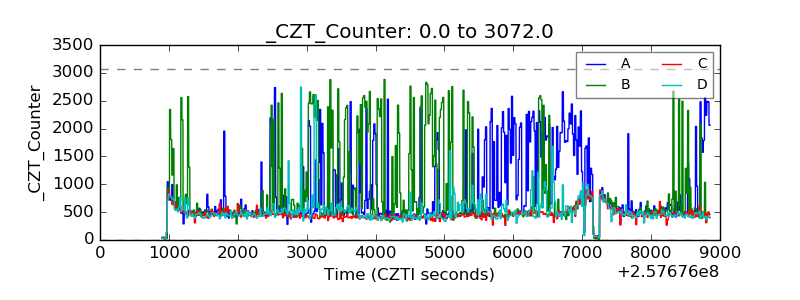 |
| +2.5 Volts monitor |  |
| +5 Volts monitor | 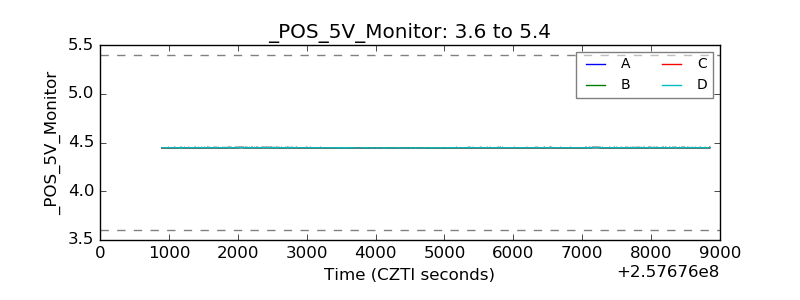 |
| _ROLL_ROT |  |
| _Roll_DEC |  |
| _Roll_RA | 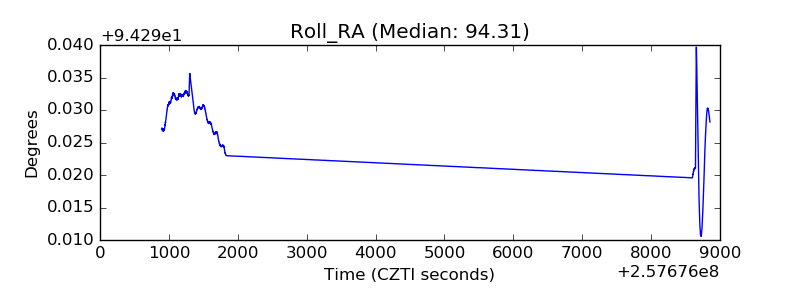 |
| Veto Counter | 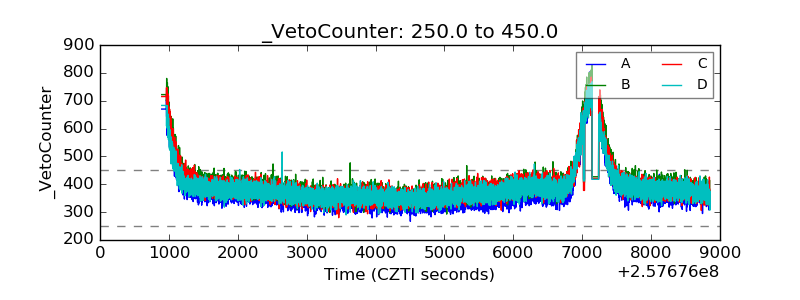 |