| Param | Original file | Final file |
|---|---|---|
| Filename | modeM0/AS1A04_017T01_9000001932_13119cztM0_level2.evt | modeM0/AS1A04_017T01_9000001932_13119cztM0_level2_quad_clean.evt |
| Size (bytes) | 771,696,000 | 84,792,960 |
| Size | 735.9 MB | 80.9 MB |
| Events in quadrant A | 9,280,144 | 438,571 |
| Events in quadrant B | 6,201,729 | 507,650 |
| Events in quadrant C | 3,305,222 | 574,885 |
| Events in quadrant D | 4,095,616 | 543,510 |
| Mode M0 | |||
|---|---|---|---|
| Quadrant | BADHDUFLAG | Total packets | Discarded packets |
| A | 0 | 32365 | 2 |
| B | 0 | 23090 | 1 |
| C | 0 | 14730 | 1 |
| D | 0 | 17252 | 1 |
| Mode M9 | |||
|---|---|---|---|
| Quadrant | BADHDUFLAG | Total packets | Discarded packets |
| A | 0 | 3 | 0 |
| B | 0 | 3 | 0 |
| C | 0 | 3 | 0 |
| D | 0 | 3 | 0 |
| Mode SS | |||
|---|---|---|---|
| Quadrant | BADHDUFLAG | Total packets | Discarded packets |
| A | 0 | 146 | 0 |
| B | 0 | 146 | 0 |
| C | 0 | 146 | 0 |
| D | 0 | 146 | 0 |
| Quadrant | Total seconds | Saturated seconds | Saturation percentage |
|---|---|---|---|
| A | 7207 | 2847 | 39.503261% |
| B | 7207 | 1184 | 16.428472% |
| C | 7207 | 55 | 0.763147% |
| D | 7207 | 382 | 5.300402% |
Noise dominated data is calculated using 1-second bins in cleaned event files. If a bin has >2000 counts, and if more than 50% of those come from <1% of pixels, then it is considered to be noise-dominated and hence unusable.
| Quadrant | # 1 sec bins | Bins with >0 counts | Bins with >2000 counts | High rate bins dominated by noise | Noise dominated (total time) | Noise dominated (detector-on time) | Marked lightcurve |
|---|---|---|---|---|---|---|---|
| A | 7523 | 7209 | 1899 | 1899 | 25.24% | 26.34% | 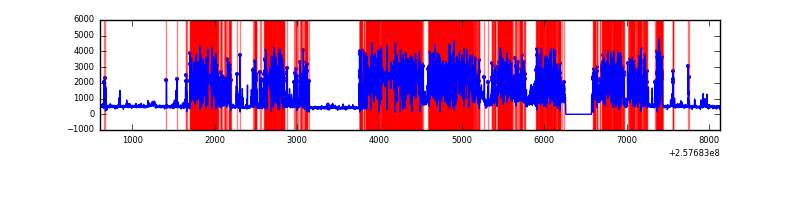 |
| B | 7523 | 7209 | 676 | 676 | 8.99% | 9.38% |  |
| C | 7523 | 7209 | 0 | 0 | 0.00% | 0.00% | 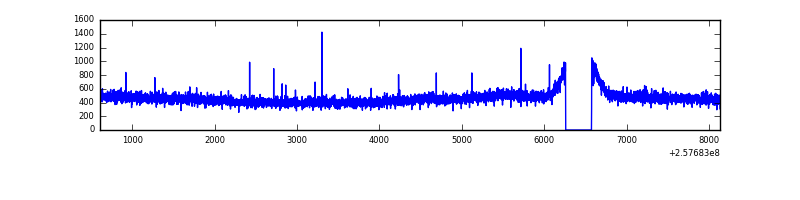 |
| D | 7523 | 7209 | 272 | 272 | 3.62% | 3.77% | 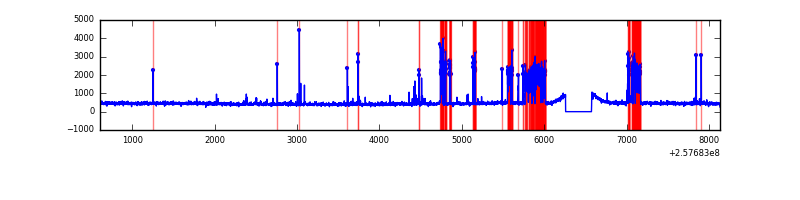 |
Top three noisy pixels from each quadrant. If the there are fewer than three noisy pixels in the level2.evt file, extra rows are filled as -1
| Pixel properties | Quadrant properties | ||||||
|---|---|---|---|---|---|---|---|
| Quadrant | DetID | PixID | Counts | Sigma | Mean | Median | Sigma |
| A | 15 | 223 | 3728410 | 27121.03 | 671 | 655 | 137.4 |
| A | 15 | 239 | 1921650 | 13976.07 | 671 | 655 | 137.4 |
| A | 15 | 255 | 579702 | 4212.82 | 671 | 655 | 137.4 |
| B | 4 | 239 | 2491285 | 16281.8 | 795 | 774 | 153.0 |
| B | 3 | 64 | 324221 | 2114.55 | 795 | 774 | 153.0 |
| B | 0 | 85 | 166674 | 1084.58 | 795 | 774 | 153.0 |
| C | 0 | 207 | 23939 | 117.24 | 841 | 844 | 197.0 |
| C | 13 | 61 | 6067 | 26.51 | 841 | 844 | 197.0 |
| C | 12 | 4 | 2548 | 8.65 | 841 | 844 | 197.0 |
| D | 1 | 52 | 872929 | 4346.1 | 829 | 806 | 200.7 |
| D | 1 | 31 | 25153 | 121.33 | 829 | 806 | 200.7 |
| D | 2 | 234 | 21906 | 105.15 | 829 | 806 | 200.7 |
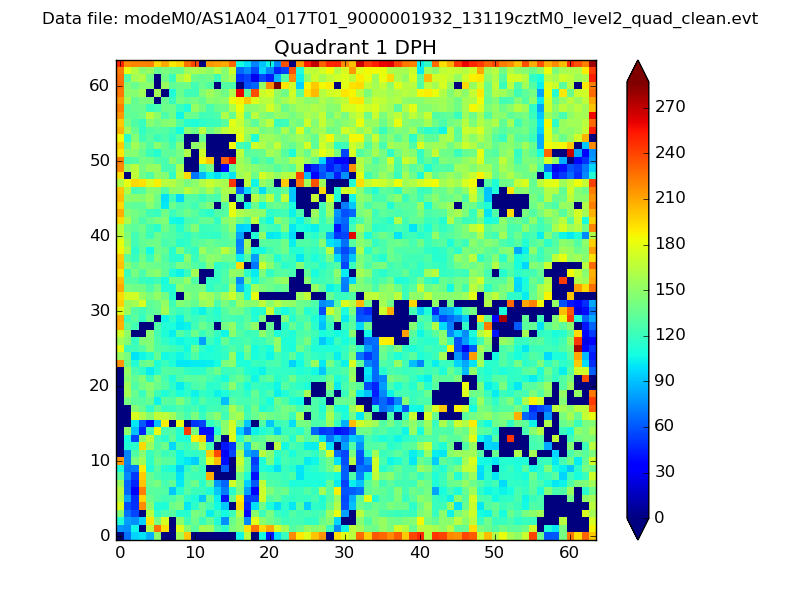
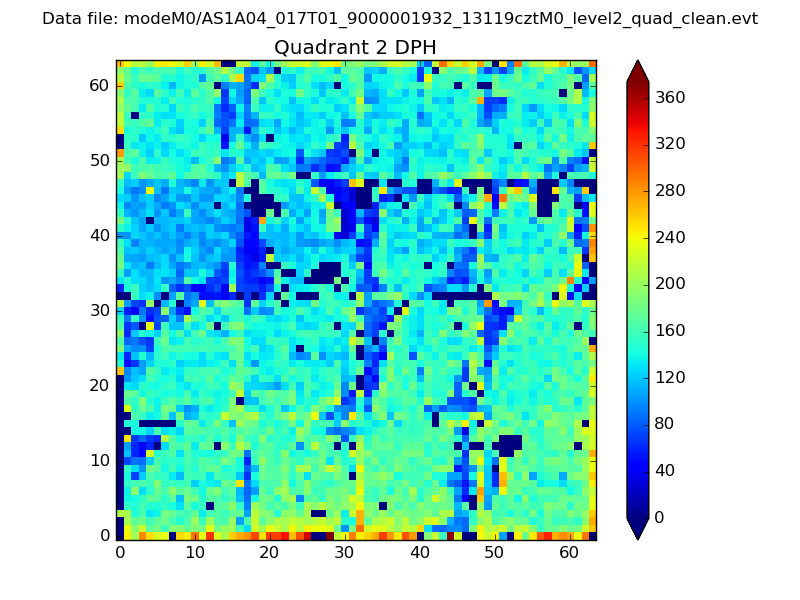
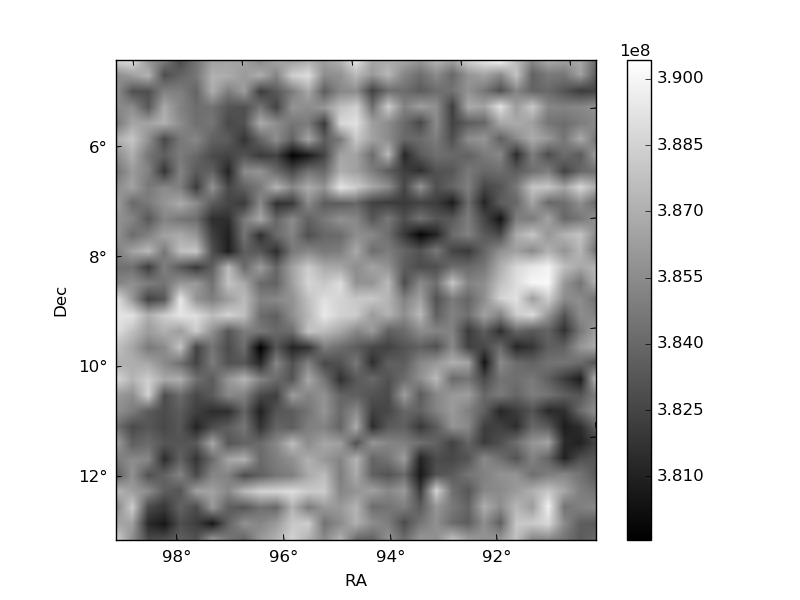
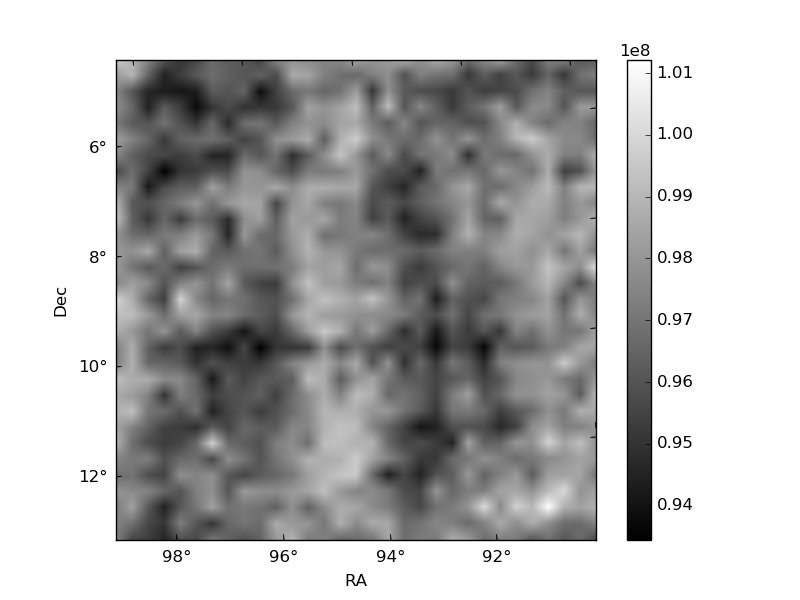
Histogram calculated using DETX and DETY for each event in the final _common_clean file
| Quadrant A | 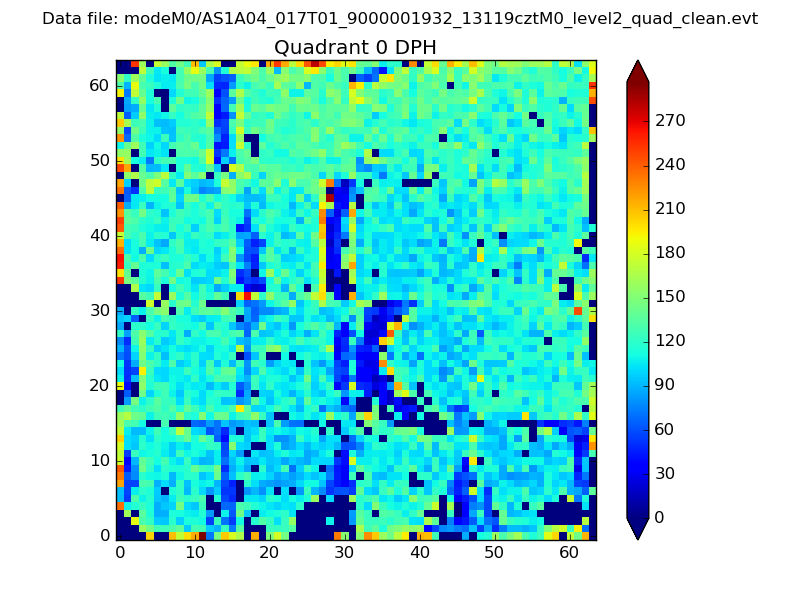 |
 |
Quadrant B |
|---|---|---|---|
| Quadrant D | 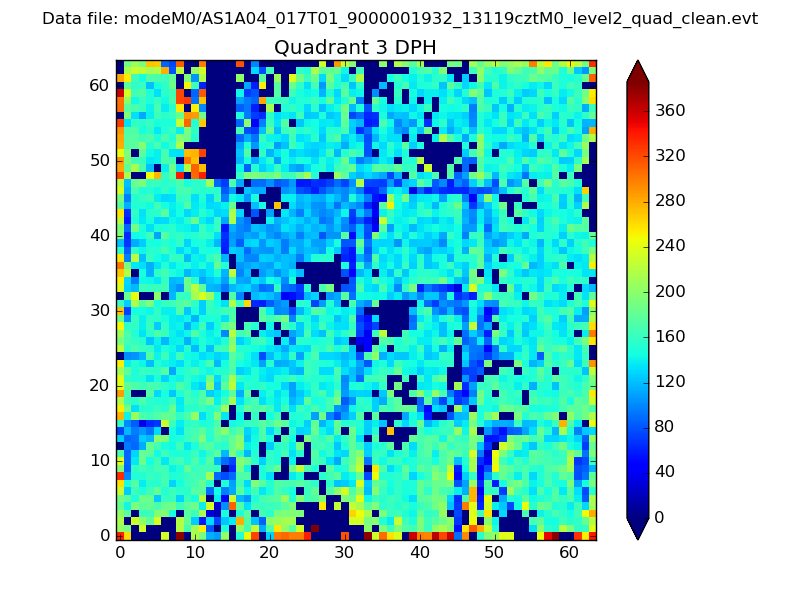 |
 |
Quadrant C |
| Plot type | Count rate plots | Images |
|---|---|---|
| Comparison with Poisson distribution Blue bars denote a histogram of data divided into 1 sec bins. Red curve is a Poisson curve with rate = median count rate of data. |
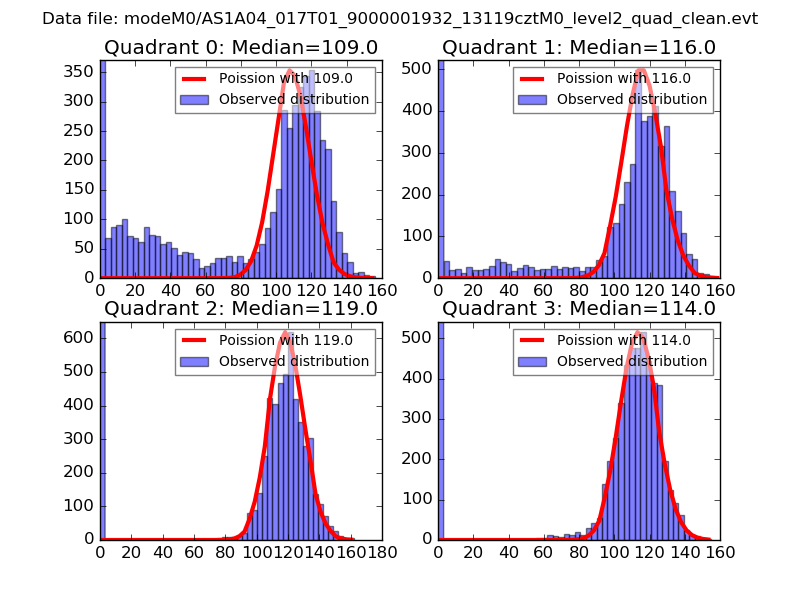 |
 |
| Quadrant-wise count rates Data is divided into 100 sec bins |
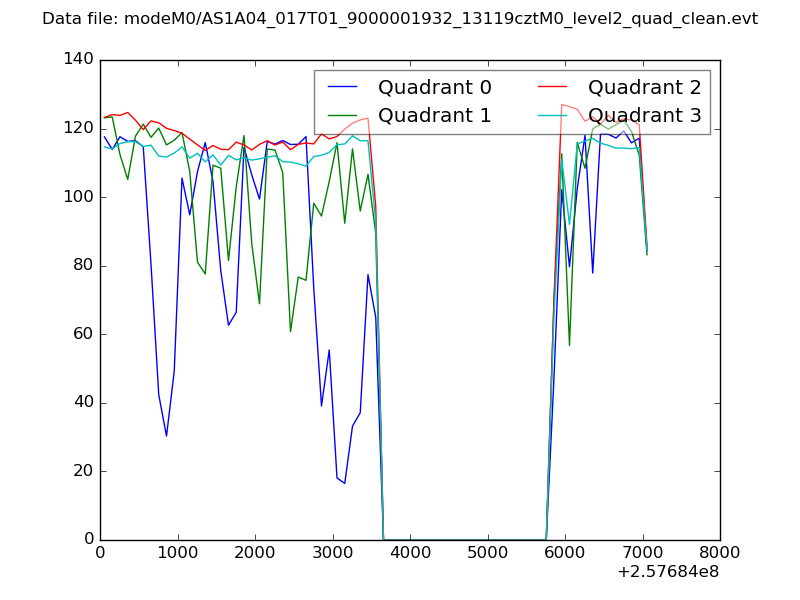 |
|
| Module-wise count rates for Quadrant A Data is divided into 100 sec bins |
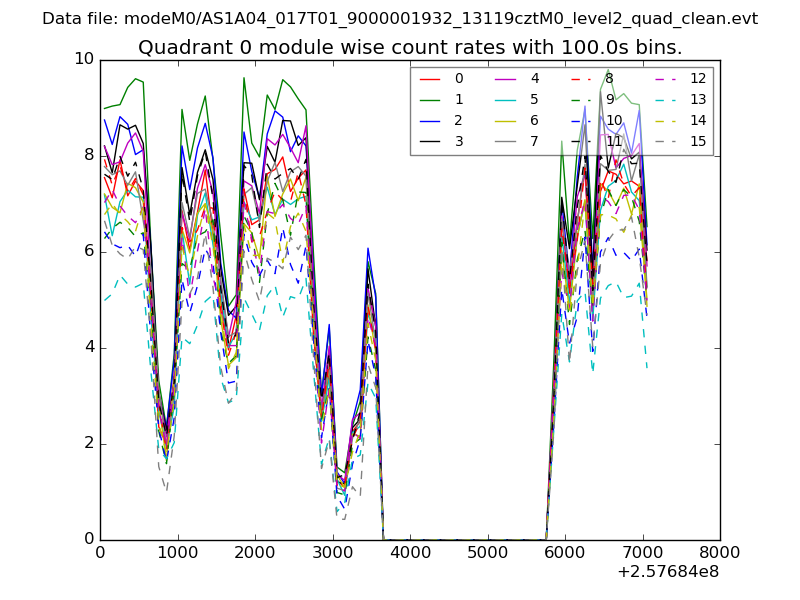 |
 |
| Module-wise count rates for Quadrant B Data is divided into 100 sec bins |
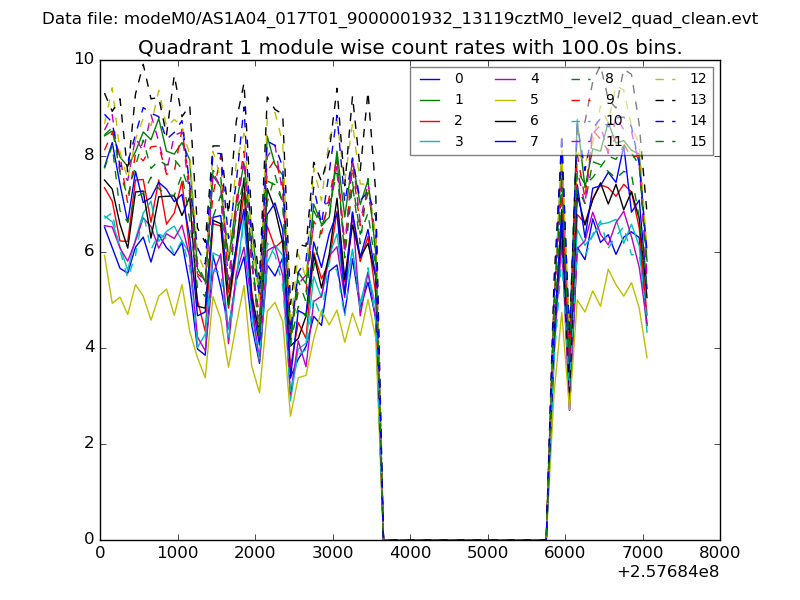 |
 |
| Module-wise count rates for Quadrant C Data is divided into 100 sec bins |
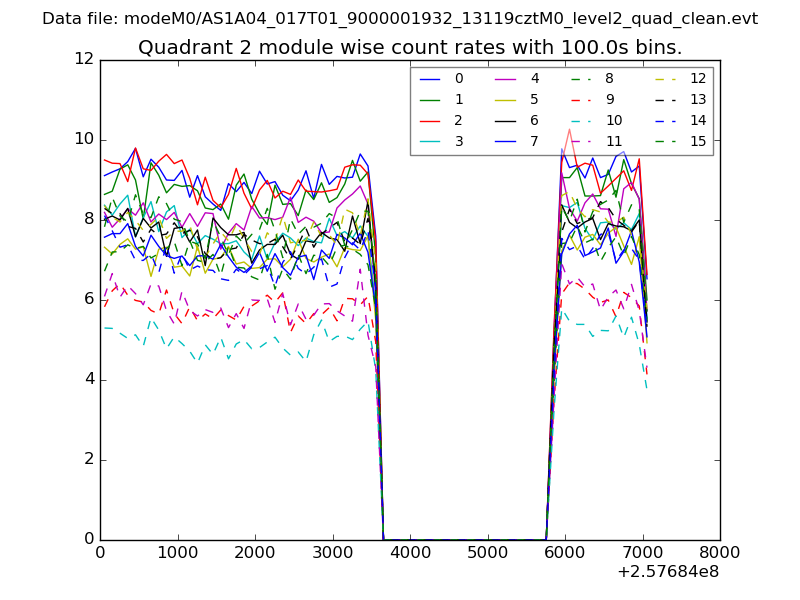 |
 |
| Module-wise count rates for Quadrant D Data is divided into 100 sec bins |
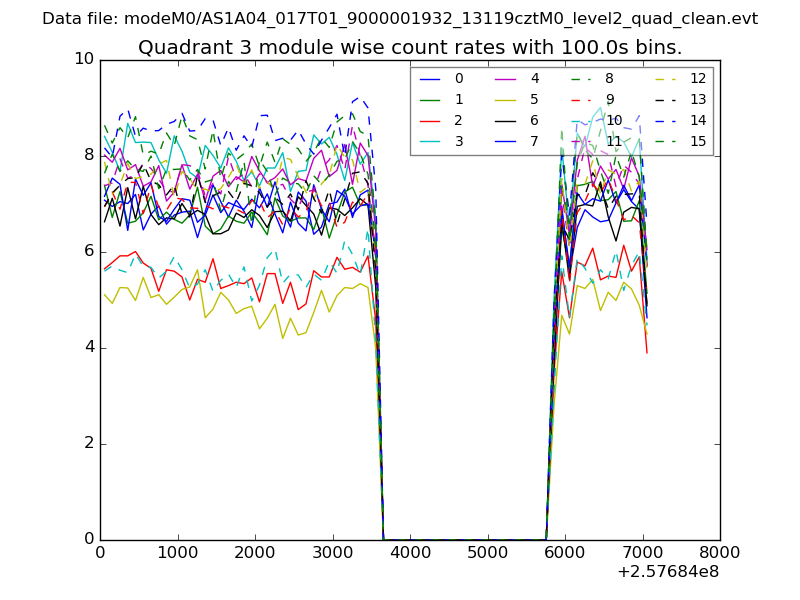 |
 |
| Parameter | Plot |
|---|---|
| CZT HV Monitor | 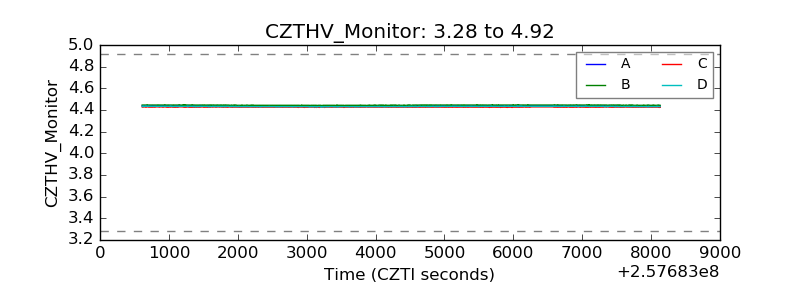 |
| D_VDD | 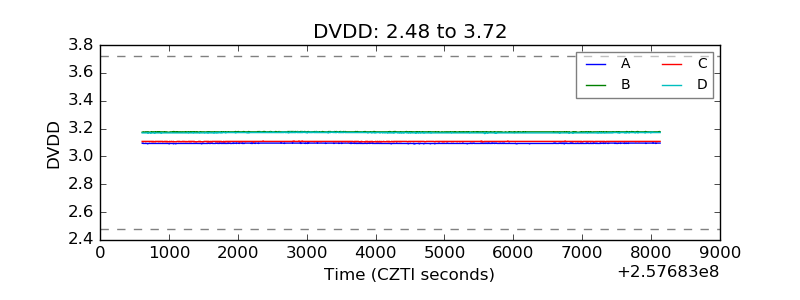 |
| Temperature 1 | 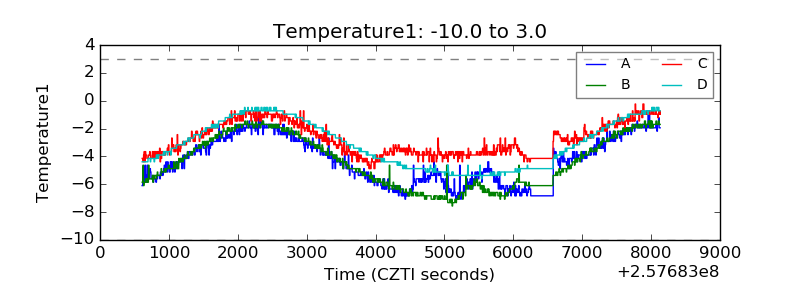 |
| Veto HV Monitor | 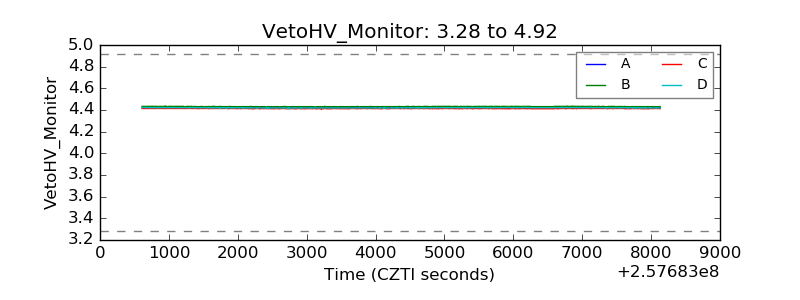 |
| Veto LLD | 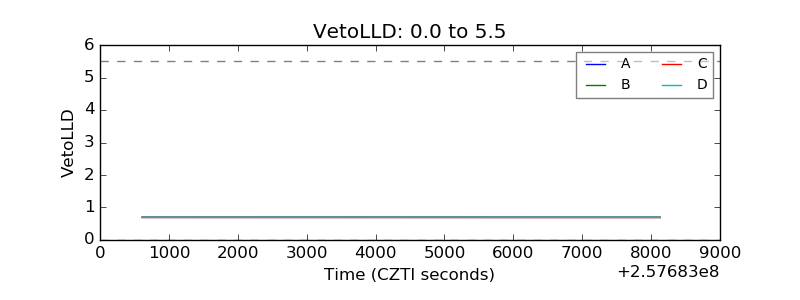 |
| Alpha Counter | 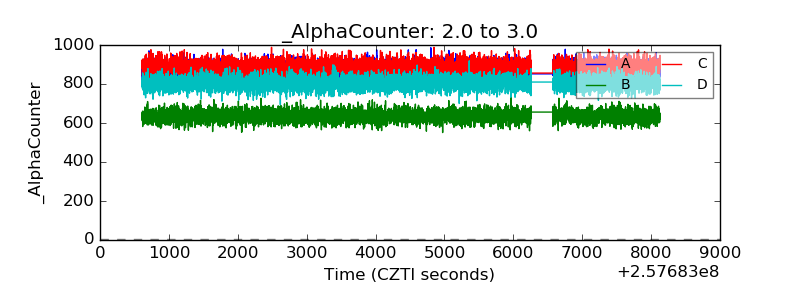 |
| _CPM_Rate | 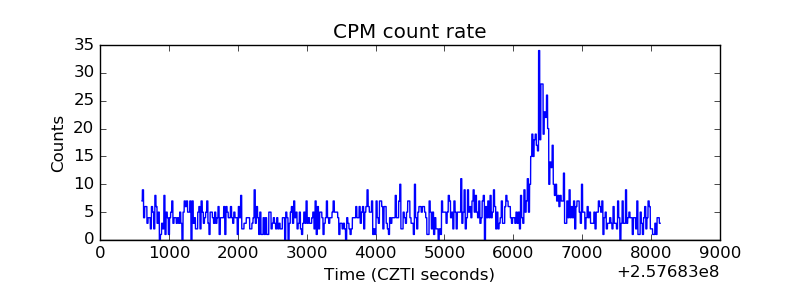 |
| CZT Counter |  |
| +2.5 Volts monitor |  |
| +5 Volts monitor | 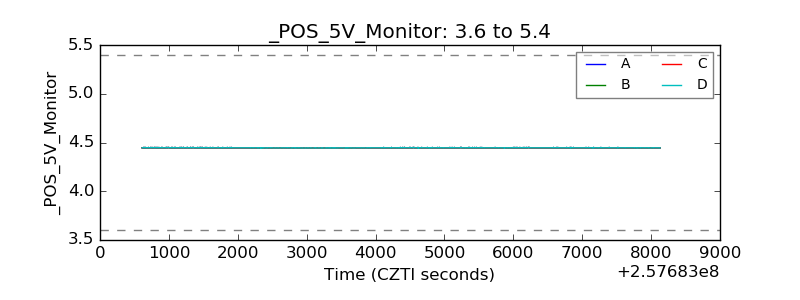 |
| _ROLL_ROT | 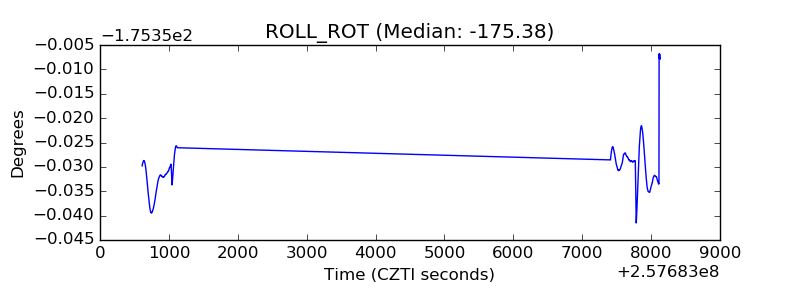 |
| _Roll_DEC | 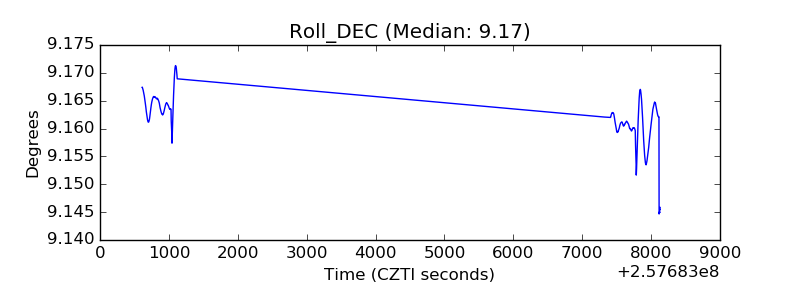 |
| _Roll_RA | 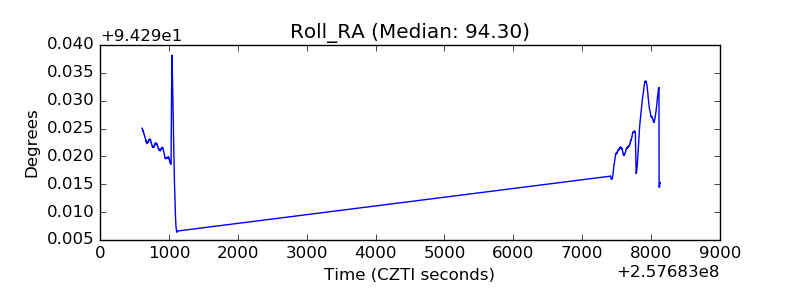 |
| Veto Counter | 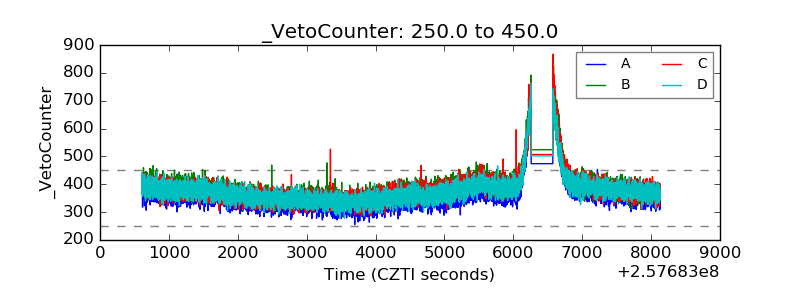 |