| Param | Original file | Final file |
|---|---|---|
| Filename | modeM0/AS1A04_017T01_9000001932_13122cztM0_level2.evt | modeM0/AS1A04_017T01_9000001932_13122cztM0_level2_quad_clean.evt |
| Size (bytes) | 1,522,062,720 | 211,492,800 |
| Size | 1.4 GB | 201.7 MB |
| Events in quadrant A | 10,227,797 | 1,342,286 |
| Events in quadrant B | 17,814,771 | 1,092,147 |
| Events in quadrant C | 8,171,284 | 1,397,736 |
| Events in quadrant D | 8,659,889 | 1,325,083 |
| Mode M0 | |||
|---|---|---|---|
| Quadrant | BADHDUFLAG | Total packets | Discarded packets |
| A | 0 | 42349 | 4 |
| B | 0 | 64949 | 3 |
| C | 0 | 36982 | 3 |
| D | 0 | 38729 | 3 |
| Mode M9 | |||
|---|---|---|---|
| Quadrant | BADHDUFLAG | Total packets | Discarded packets |
| A | 0 | 20 | 0 |
| B | 0 | 20 | 0 |
| C | 0 | 20 | 0 |
| D | 0 | 20 | 0 |
| Mode SS | |||
|---|---|---|---|
| Quadrant | BADHDUFLAG | Total packets | Discarded packets |
| A | 0 | 366 | 0 |
| B | 0 | 366 | 0 |
| C | 0 | 366 | 0 |
| D | 0 | 366 | 0 |
| Quadrant | Total seconds | Saturated seconds | Saturation percentage |
|---|---|---|---|
| A | 18088 | 759 | 4.196152% |
| B | 18088 | 4510 | 24.933658% |
| C | 18088 | 125 | 0.691066% |
| D | 18088 | 277 | 1.531402% |
Noise dominated data is calculated using 1-second bins in cleaned event files. If a bin has >2000 counts, and if more than 50% of those come from <1% of pixels, then it is considered to be noise-dominated and hence unusable.
| Quadrant | # 1 sec bins | Bins with >0 counts | Bins with >2000 counts | High rate bins dominated by noise | Noise dominated (total time) | Noise dominated (detector-on time) | Marked lightcurve |
|---|---|---|---|---|---|---|---|
| A | 20069 | 18092 | 364 | 364 | 1.81% | 2.01% | 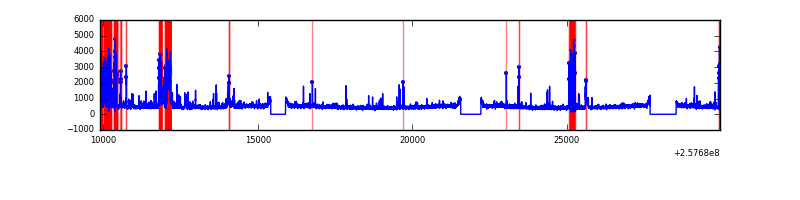 |
| B | 20068 | 18090 | 2421 | 2421 | 12.06% | 13.38% | 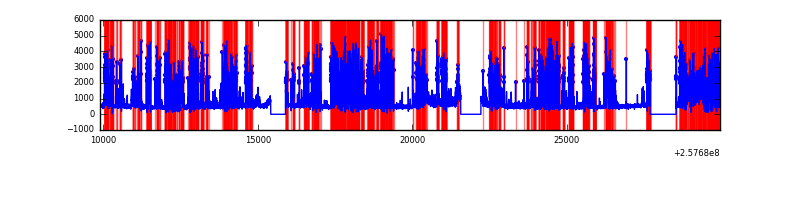 |
| C | 20069 | 18092 | 2 | 2 | 0.01% | 0.01% |  |
| D | 20069 | 18092 | 118 | 118 | 0.59% | 0.65% | 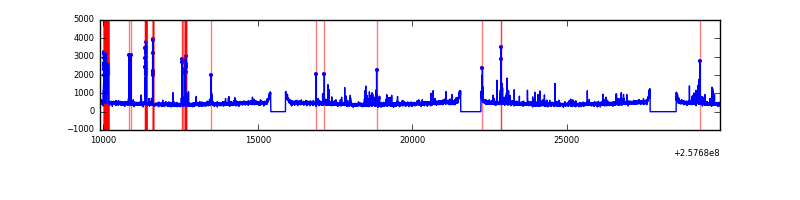 |
Top three noisy pixels from each quadrant. If the there are fewer than three noisy pixels in the level2.evt file, extra rows are filled as -1
| Pixel properties | Quadrant properties | ||||||
|---|---|---|---|---|---|---|---|
| Quadrant | DetID | PixID | Counts | Sigma | Mean | Median | Sigma |
| A | 0 | 23 | 714598 | 1671.12 | 2100 | 2052 | 426.4 |
| A | 15 | 223 | 545562 | 1274.68 | 2100 | 2052 | 426.4 |
| A | 15 | 239 | 239912 | 557.85 | 2100 | 2052 | 426.4 |
| B | 4 | 239 | 8380479 | 24337.41 | 1811 | 1765 | 344.3 |
| B | 0 | 85 | 1579527 | 4582.88 | 1811 | 1765 | 344.3 |
| B | 3 | 64 | 527011 | 1525.67 | 1811 | 1765 | 344.3 |
| C | 12 | 4 | 19833 | 36.59 | 2083 | 2095 | 484.8 |
| C | 13 | 61 | 14968 | 26.55 | 2083 | 2095 | 484.8 |
| C | 0 | 207 | 14218 | 25.01 | 2083 | 2095 | 484.8 |
| D | 1 | 52 | 606973 | 1201.42 | 2071 | 2013 | 503.5 |
| D | 13 | 122 | 67749 | 130.55 | 2071 | 2013 | 503.5 |
| D | 2 | 234 | 65229 | 125.54 | 2071 | 2013 | 503.5 |
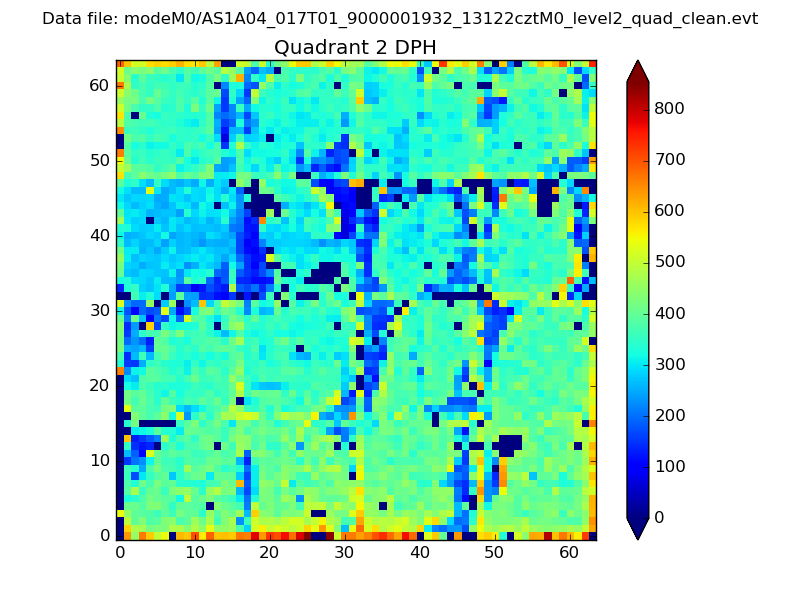
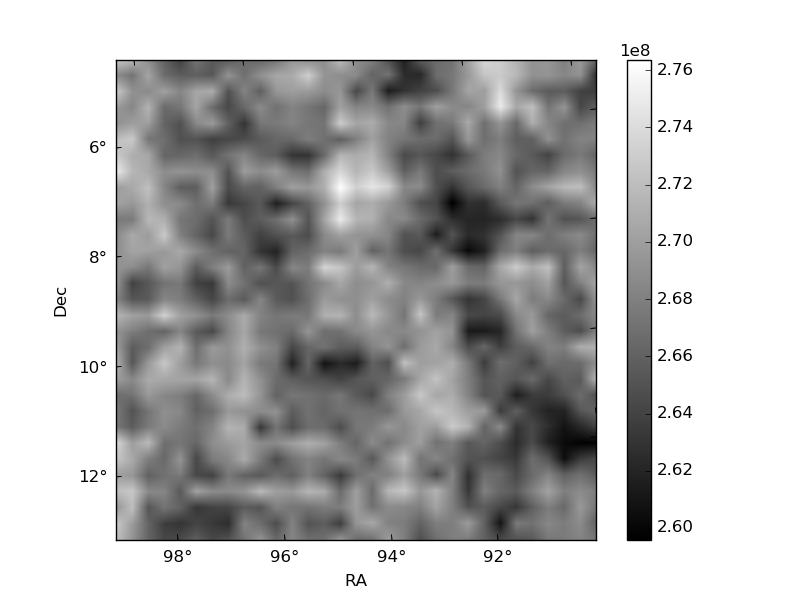
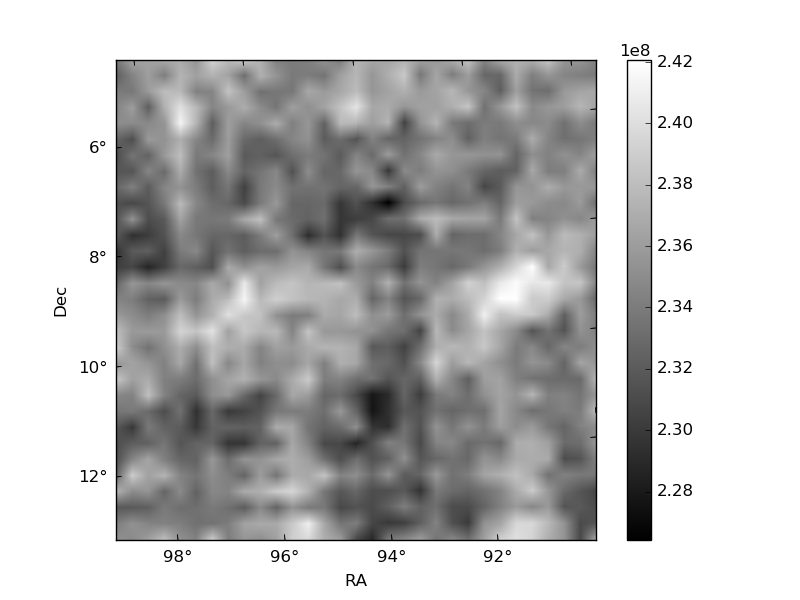
Histogram calculated using DETX and DETY for each event in the final _common_clean file
| Quadrant A | 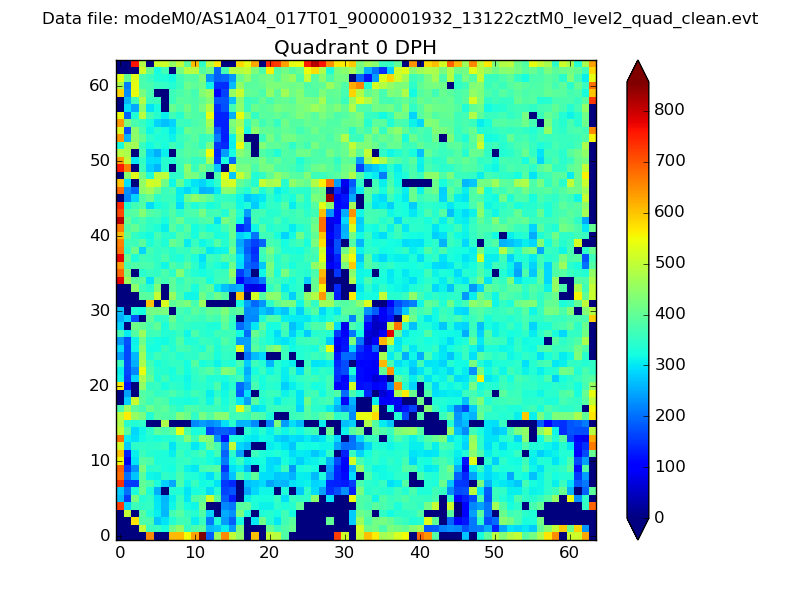 |
 |
Quadrant B |
|---|---|---|---|
| Quadrant D | 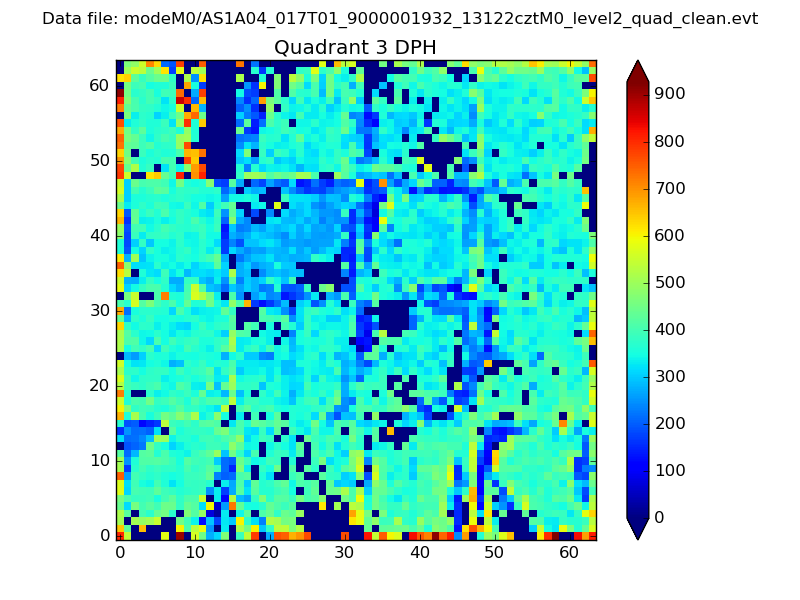 |
 |
Quadrant C |
| Plot type | Count rate plots | Images |
|---|---|---|
| Comparison with Poisson distribution Blue bars denote a histogram of data divided into 1 sec bins. Red curve is a Poisson curve with rate = median count rate of data. |
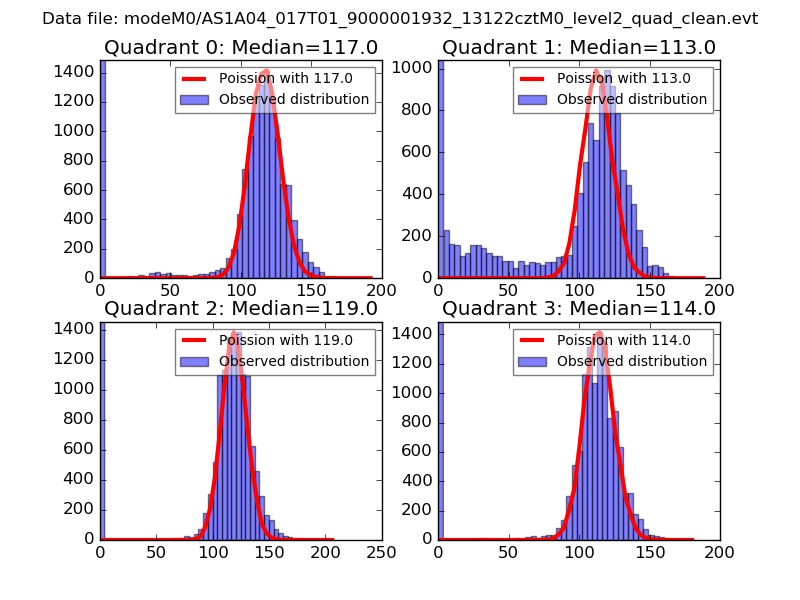 |
 |
| Quadrant-wise count rates Data is divided into 100 sec bins |
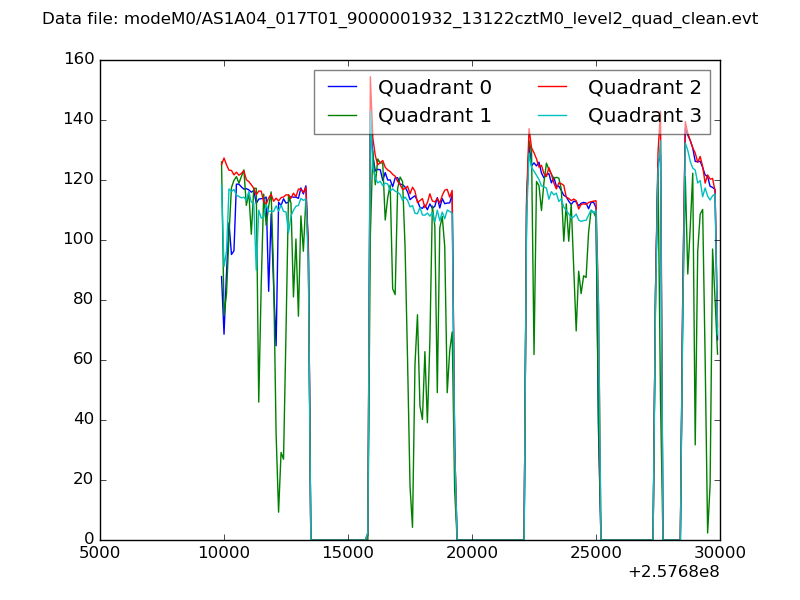 |
|
| Module-wise count rates for Quadrant A Data is divided into 100 sec bins |
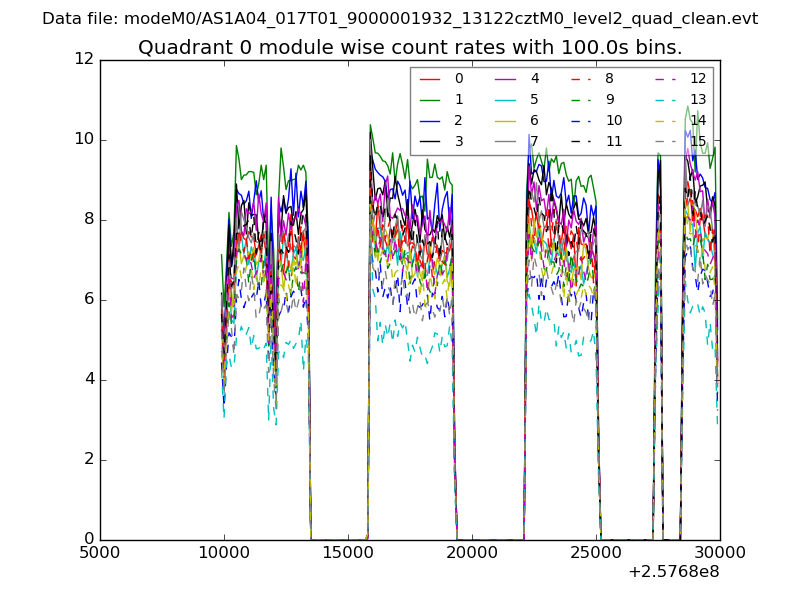 |
 |
| Module-wise count rates for Quadrant B Data is divided into 100 sec bins |
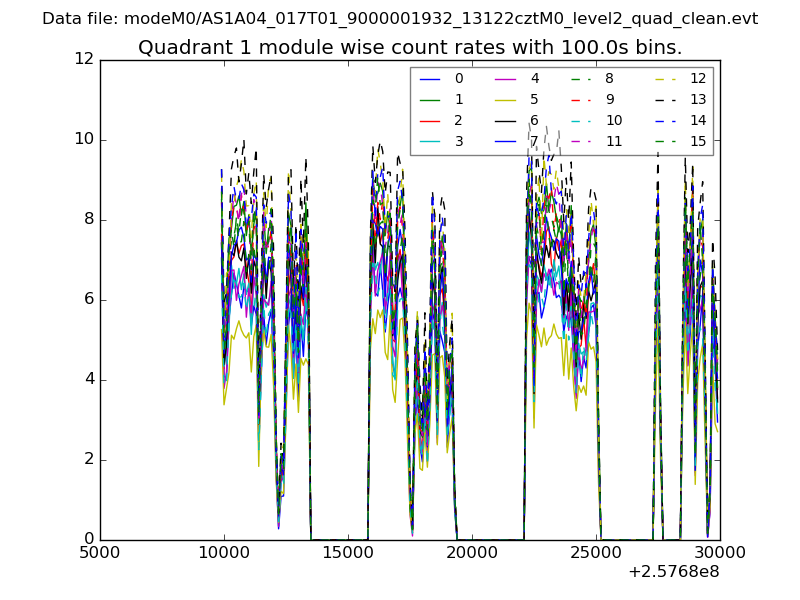 |
 |
| Module-wise count rates for Quadrant C Data is divided into 100 sec bins |
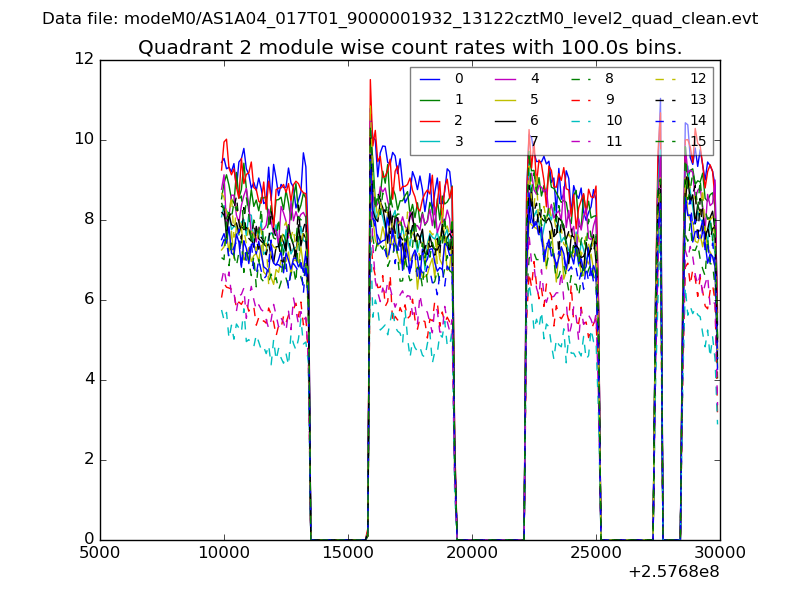 |
 |
| Module-wise count rates for Quadrant D Data is divided into 100 sec bins |
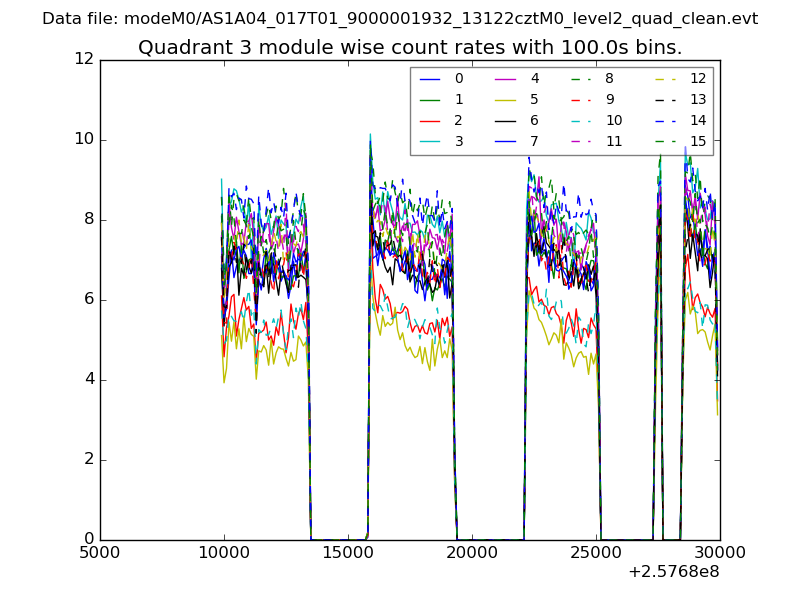 |
 |
| Parameter | Plot |
|---|---|
| CZT HV Monitor | 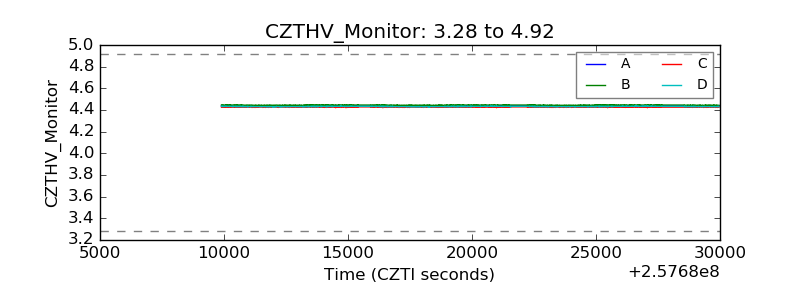 |
| D_VDD | 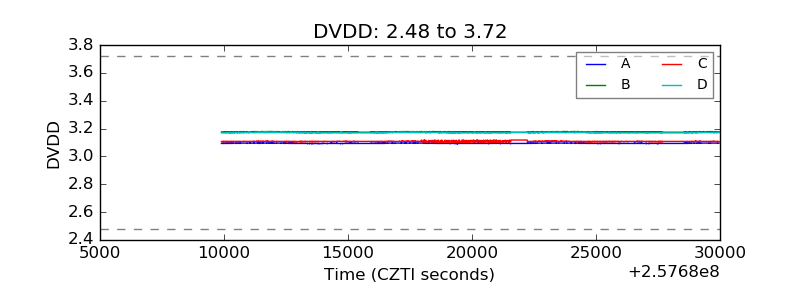 |
| Temperature 1 | 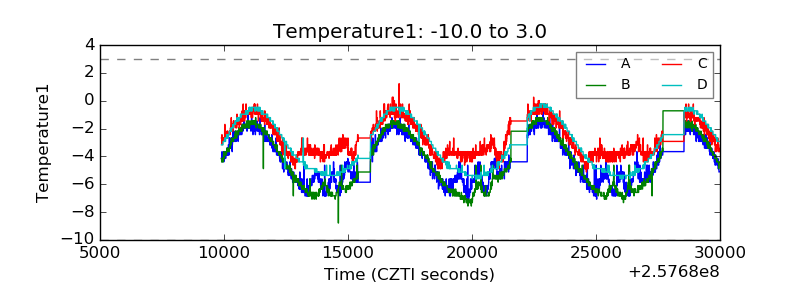 |
| Veto HV Monitor | 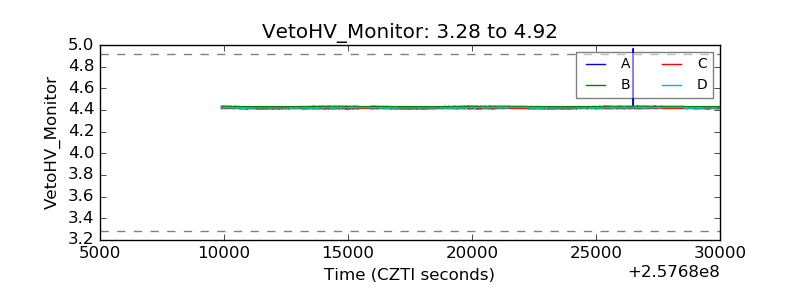 |
| Veto LLD | 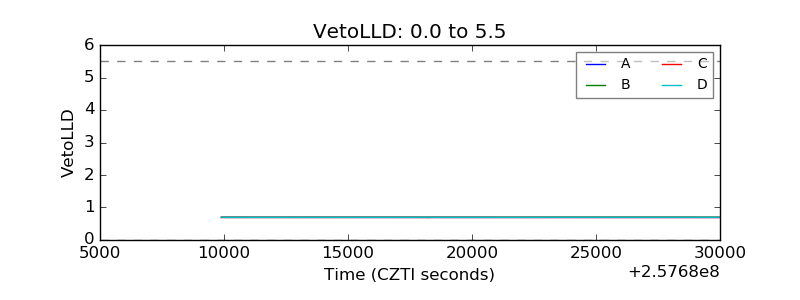 |
| Alpha Counter | 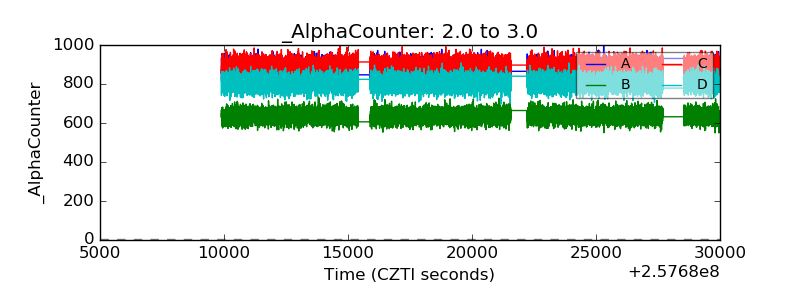 |
| _CPM_Rate | 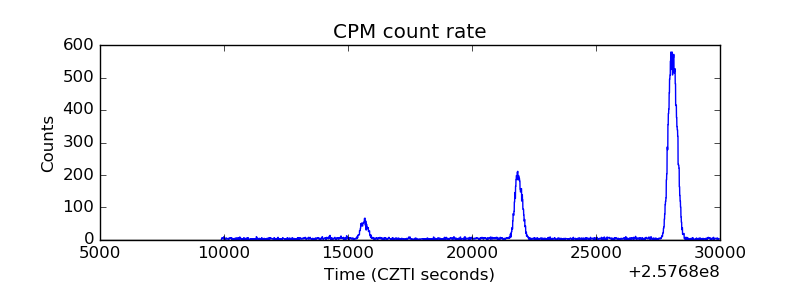 |
| CZT Counter | 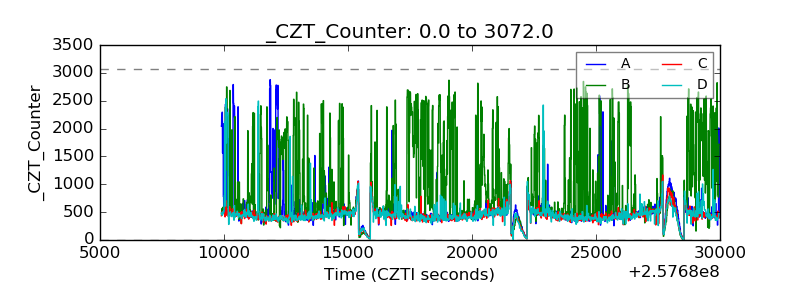 |
| +2.5 Volts monitor |  |
| +5 Volts monitor |  |
| _ROLL_ROT |  |
| _Roll_DEC | 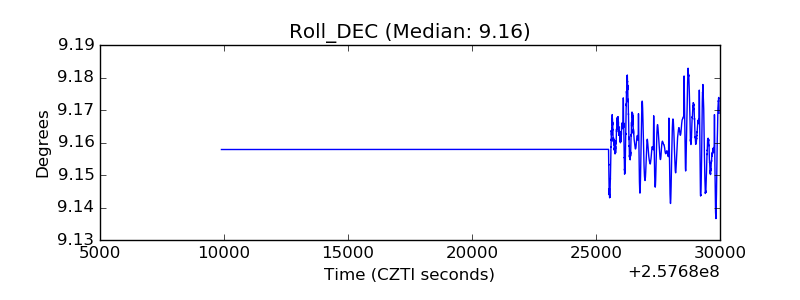 |
| _Roll_RA | 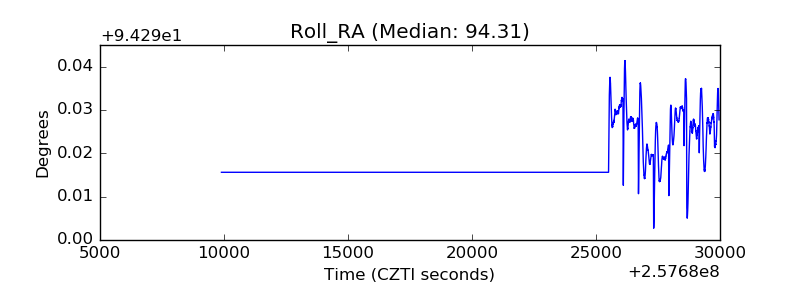 |
| Veto Counter | 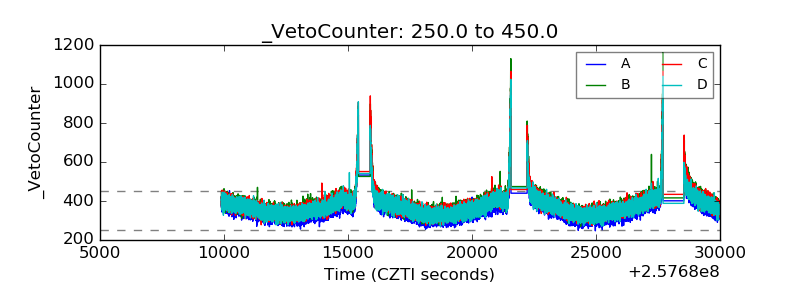 |