| Param | Original file | Final file |
|---|---|---|
| Filename | modeM0/AS1G08_031T02_9000001934cztM0_level2.fits | modeM0/AS1G08_031T02_9000001934cztM0_level2_quad_clean.evt |
| Size (bytes) | 401,541,120 | 410,365,440 |
| Size | 382.9 MB | 391.4 MB |
| Events in quadrant A | 2,483,828 | 2,501,994 |
| Events in quadrant B | 2,249,854 | 2,379,966 |
| Events in quadrant C | 2,484,234 | 2,477,956 |
| Events in quadrant D | 1,917,396 | 2,047,921 |
| Mode M9 | |||
|---|---|---|---|
| Quadrant | BADHDUFLAG | Total packets | Discarded packets |
| A | 0 | 88 | 0 |
| B | 0 | 88 | 0 |
| C | 0 | 88 | 0 |
| D | 0 | 88 | 0 |
| Mode M0 | |||
|---|---|---|---|
| Quadrant | BADHDUFLAG | Total packets | Discarded packets |
| A | 0 | 96121 | 0 |
| B | 0 | 127301 | 0 |
| C | 0 | 89750 | 0 |
| D | 0 | 151740 | 0 |
| Mode SS | |||
|---|---|---|---|
| Quadrant | BADHDUFLAG | Total packets | Discarded packets |
| A | 0 | 896 | 0 |
| B | 0 | 896 | 0 |
| C | 0 | 896 | 0 |
| D | 0 | 896 | 0 |
| Quadrant | Total seconds | Saturated seconds | Saturation percentage |
|---|---|---|---|
| A | 43989 | 611 | 1.388984% |
| B | 43989 | 5238 | 11.907522% |
| C | 43989 | 115 | 0.261429% |
| D | 43989 | 7697 | 17.497556% |
Noise dominated data is calculated using 1-second bins in cleaned event files. If a bin has >2000 counts, and if more than 50% of those come from <1% of pixels, then it is considered to be noise-dominated and hence unusable.
| Quadrant | # 1 sec bins | Bins with >0 counts | Bins with >2000 counts | High rate bins dominated by noise | Noise dominated (total time) | Noise dominated (detector-on time) | Marked lightcurve |
|---|---|---|---|---|---|---|---|
| A | 52815 | 43983 | 0 | 0 | 0.00% | 0.00% |  |
| B | 52815 | 43377 | 0 | 0 | 0.00% | 0.00% |  |
| C | 52815 | 43989 | 0 | 0 | 0.00% | 0.00% |  |
| D | 52815 | 43922 | 0 | 0 | 0.00% | 0.00% | 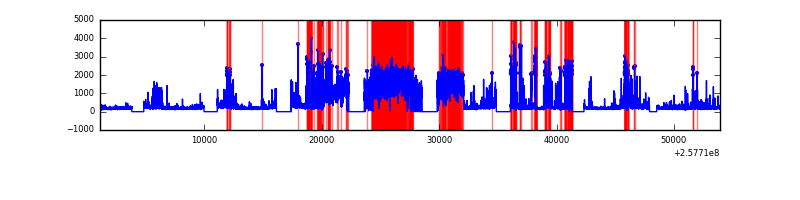 |
Top three noisy pixels from each quadrant. If the there are fewer than three noisy pixels in the level2.evt file, extra rows are filled as -1
| Pixel properties | Quadrant properties | ||||||
|---|---|---|---|---|---|---|---|
| Quadrant | DetID | PixID | Counts | Sigma | Mean | Median | Sigma |
| A | 0 | 29 | 2362 | 10.96 | 646 | 609 | 159.9 |
| A | 7 | 110 | 2016 | 8.8 | 646 | 609 | 159.9 |
| A | 9 | 19 | 1834 | 7.66 | 646 | 609 | 159.9 |
| B | 2 | 9 | 1923 | 11.61 | 594 | 571 | 116.4 |
| B | 14 | 254 | 1539 | 8.31 | 594 | 571 | 116.4 |
| B | 3 | 17 | 1481 | 7.82 | 594 | 571 | 116.4 |
| C | 1 | 81 | 1876 | 7.44 | 655 | 613 | 169.7 |
| C | 1 | 80 | 1868 | 7.4 | 655 | 613 | 169.7 |
| C | 12 | 241 | 1729 | 6.58 | 655 | 613 | 169.7 |
| D | 6 | 231 | 1391 | 6.07 | 547 | 499 | 147.0 |
| D | 7 | 3 | 1382 | 6.01 | 547 | 499 | 147.0 |
| D | 10 | 113 | 1358 | 5.84 | 547 | 499 | 147.0 |
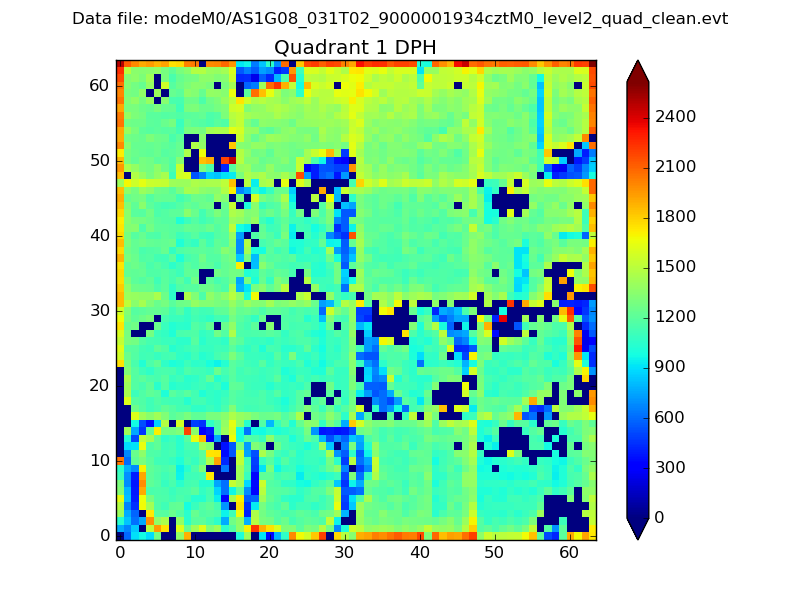
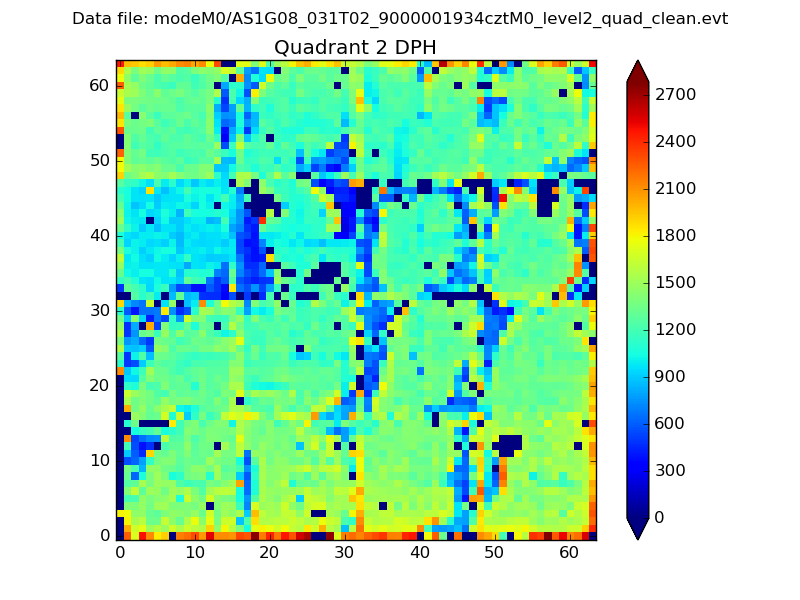
Histogram calculated using DETX and DETY for each event in the final _common_clean file
| Quadrant A |  |
 |
Quadrant B |
|---|---|---|---|
| Quadrant D | 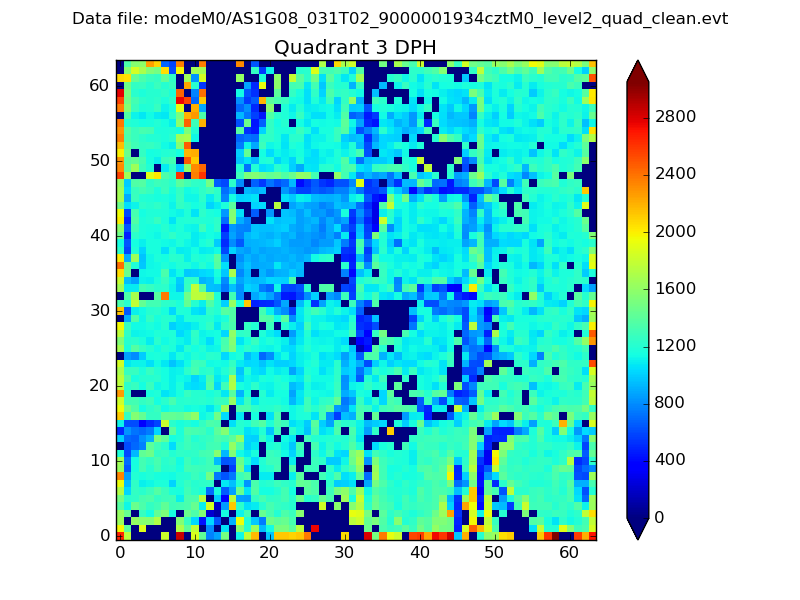 |
 |
Quadrant C |
| Plot type | Count rate plots | Images |
|---|---|---|
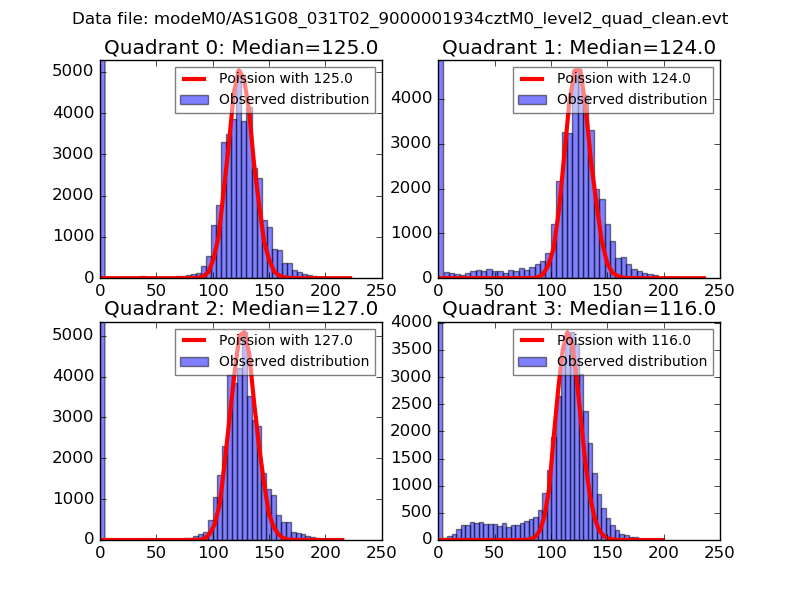
| Comparison with Poisson distribution Blue bars denote a histogram of data divided into 1 sec bins. Red curve is a Poisson curve with rate = median count rate of data. |
 |
 |
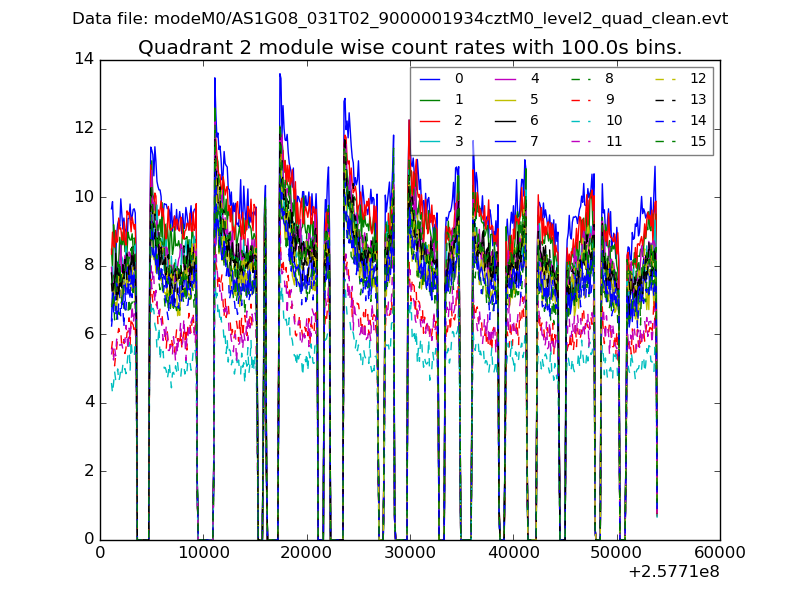
| Quadrant-wise count rates Data is divided into 100 sec bins |
 |
|
| Module-wise count rates for Quadrant A Data is divided into 100 sec bins |
 |
 |
| Module-wise count rates for Quadrant B Data is divided into 100 sec bins |
 |
 |
| Module-wise count rates for Quadrant C Data is divided into 100 sec bins |
 |
 |
| Module-wise count rates for Quadrant D Data is divided into 100 sec bins |
 |
 |
| Parameter | Plot |
|---|---|
| CZT HV Monitor | 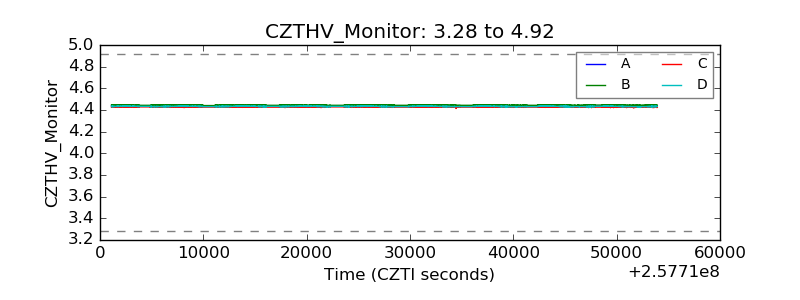 |
| D_VDD | 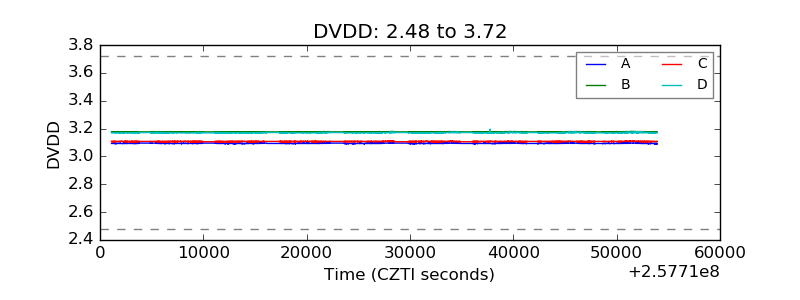 |
| Temperature 1 |  |
| Veto HV Monitor |  |
| Veto LLD | 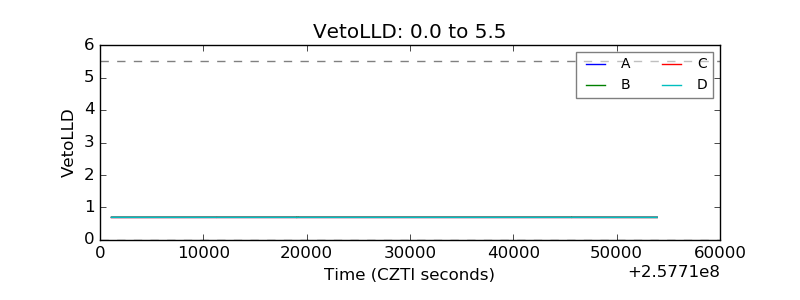 |
| Alpha Counter |  |
| _CPM_Rate | 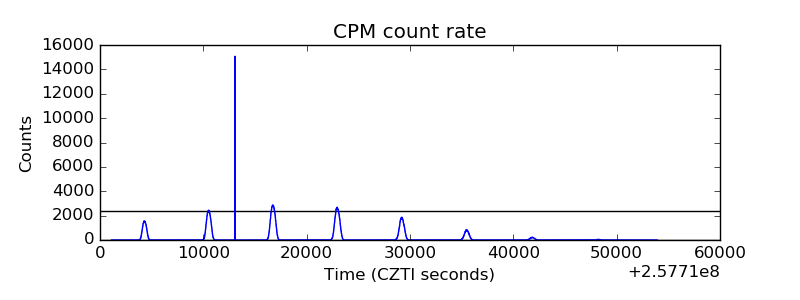 |
| CZT Counter | 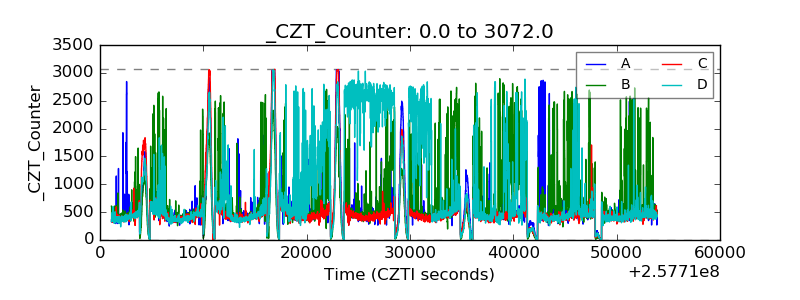 |
| +2.5 Volts monitor | 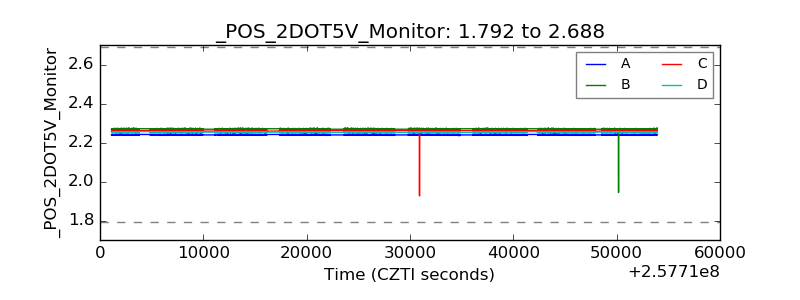 |
| +5 Volts monitor |  |
| _ROLL_ROT |  |
| _Roll_DEC |  |
| _Roll_RA |  |
| Veto Counter |  |