| Param | Original file | Final file |
|---|---|---|
| Filename | modeM0/AS1G08_031T02_9000001934_13123cztM0_level2.evt | modeM0/AS1G08_031T02_9000001934_13123cztM0_level2_quad_clean.evt |
| Size (bytes) | 284,040,000 | 69,471,360 |
| Size | 270.9 MB | 66.3 MB |
| Events in quadrant A | 2,092,066 | 458,350 |
| Events in quadrant B | 2,564,974 | 441,681 |
| Events in quadrant C | 1,779,644 | 470,296 |
| Events in quadrant D | 1,894,263 | 453,440 |
| Mode M9 | |||
|---|---|---|---|
| Quadrant | BADHDUFLAG | Total packets | Discarded packets |
| A | 0 | 10 | 0 |
| B | 0 | 10 | 0 |
| C | 0 | 10 | 0 |
| D | 0 | 10 | 0 |
| Mode M0 | |||
|---|---|---|---|
| Quadrant | BADHDUFLAG | Total packets | Discarded packets |
| A | 0 | 8985 | 2 |
| B | 0 | 10408 | 1 |
| C | 0 | 8132 | 1 |
| D | 0 | 8581 | 1 |
| Mode SS | |||
|---|---|---|---|
| Quadrant | BADHDUFLAG | Total packets | Discarded packets |
| A | 0 | 82 | 0 |
| B | 0 | 82 | 0 |
| C | 0 | 82 | 0 |
| D | 0 | 82 | 0 |
| Quadrant | Total seconds | Saturated seconds | Saturation percentage |
|---|---|---|---|
| A | 3966 | 74 | 1.865860% |
| B | 3966 | 320 | 8.068583% |
| C | 3966 | 26 | 0.655572% |
| D | 3966 | 26 | 0.655572% |
Noise dominated data is calculated using 1-second bins in cleaned event files. If a bin has >2000 counts, and if more than 50% of those come from <1% of pixels, then it is considered to be noise-dominated and hence unusable.
| Quadrant | # 1 sec bins | Bins with >0 counts | Bins with >2000 counts | High rate bins dominated by noise | Noise dominated (total time) | Noise dominated (detector-on time) | Marked lightcurve |
|---|---|---|---|---|---|---|---|
| A | 4987 | 3968 | 46 | 46 | 0.92% | 1.16% | 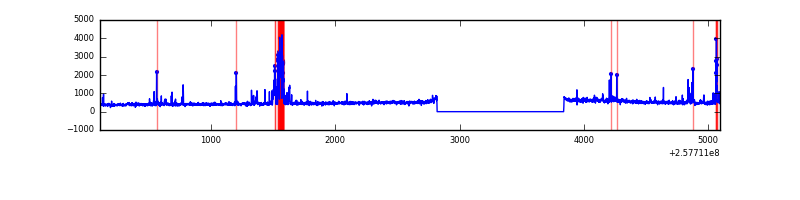 |
| B | 4987 | 3968 | 149 | 149 | 2.99% | 3.76% | 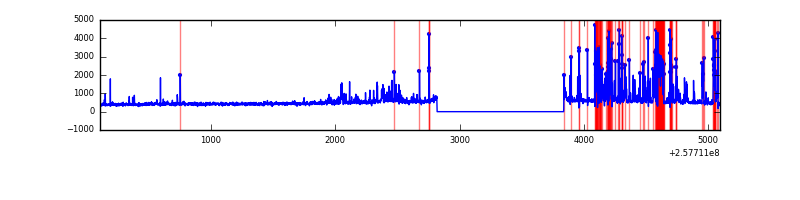 |
| C | 4987 | 3968 | 0 | 0 | 0.00% | 0.00% | 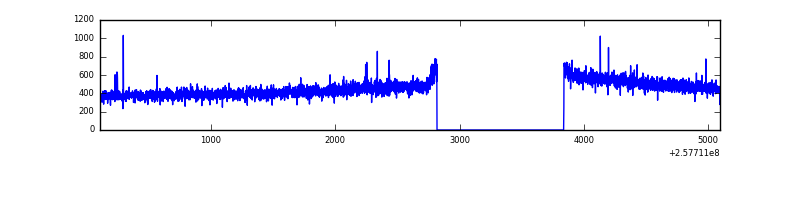 |
| D | 4987 | 3968 | 2 | 2 | 0.04% | 0.05% | 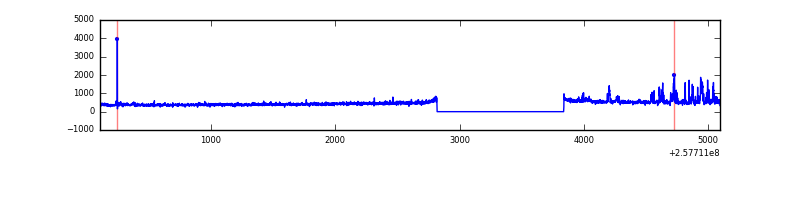 |
Top three noisy pixels from each quadrant. If the there are fewer than three noisy pixels in the level2.evt file, extra rows are filled as -1
| Pixel properties | Quadrant properties | ||||||
|---|---|---|---|---|---|---|---|
| Quadrant | DetID | PixID | Counts | Sigma | Mean | Median | Sigma |
| A | 4 | 2 | 209889 | 2218.87 | 463 | 454 | 94.4 |
| A | 15 | 223 | 32594 | 340.51 | 463 | 454 | 94.4 |
| A | 12 | 189 | 30124 | 314.34 | 463 | 454 | 94.4 |
| B | 4 | 239 | 704631 | 8279.52 | 442 | 431 | 85.1 |
| B | 3 | 64 | 77336 | 904.2 | 442 | 431 | 85.1 |
| B | 0 | 197 | 13138 | 149.4 | 442 | 431 | 85.1 |
| C | 13 | 61 | 3296 | 26.78 | 454 | 456 | 106.0 |
| C | 12 | 4 | 3171 | 25.6 | 454 | 456 | 106.0 |
| C | 15 | 208 | 2036 | 14.9 | 454 | 456 | 106.0 |
| D | 1 | 52 | 155978 | 1427.37 | 452 | 438 | 109.0 |
| D | 2 | 234 | 15339 | 136.74 | 452 | 438 | 109.0 |
| D | 14 | 49 | 8798 | 76.72 | 452 | 438 | 109.0 |
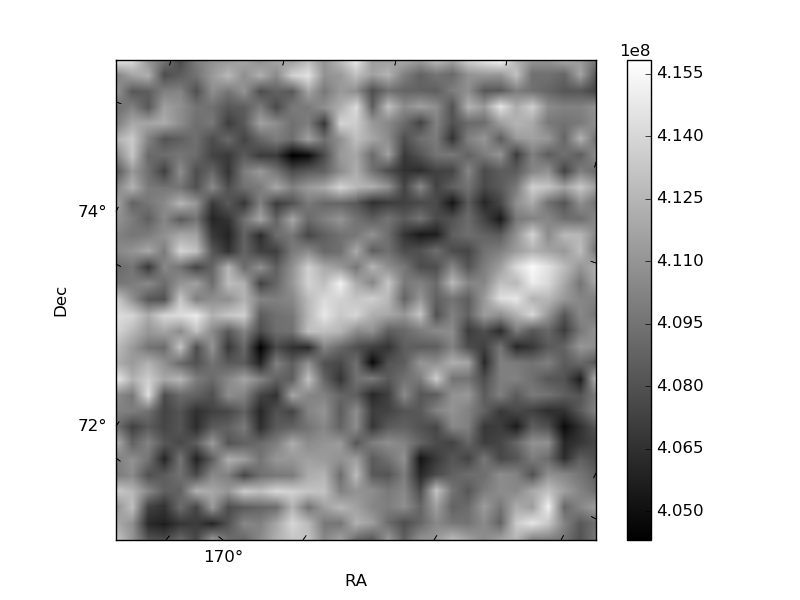
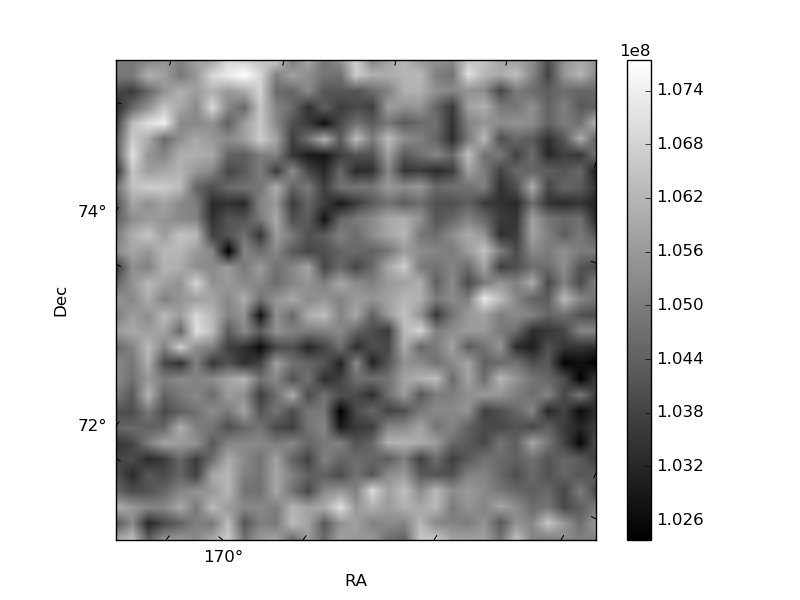
Histogram calculated using DETX and DETY for each event in the final _common_clean file
| Quadrant A | 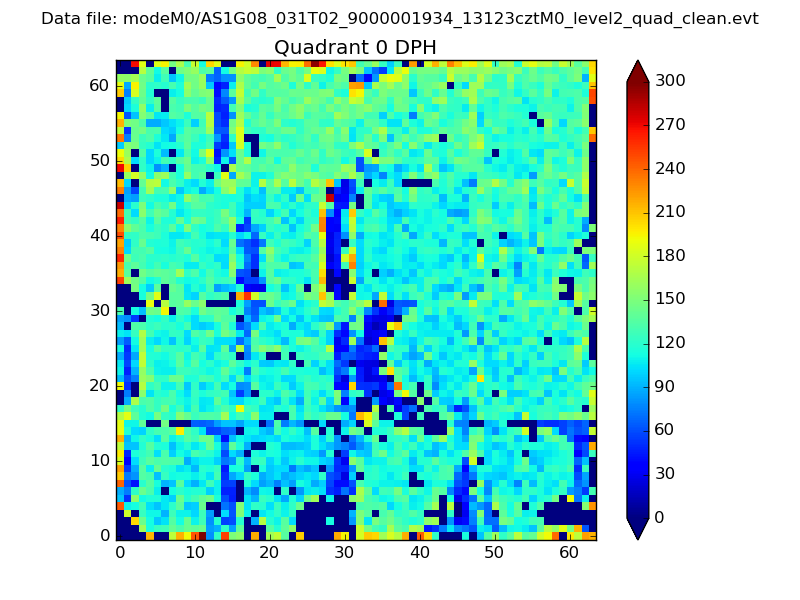 |
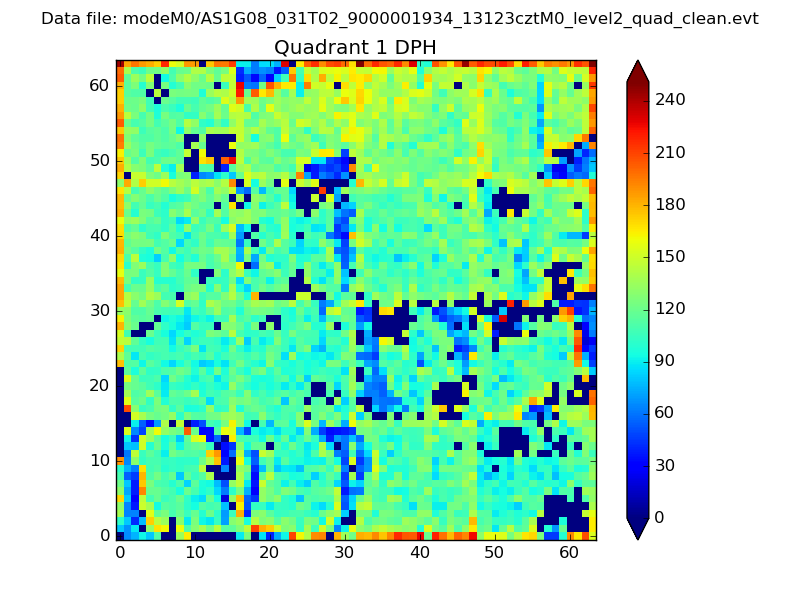 |
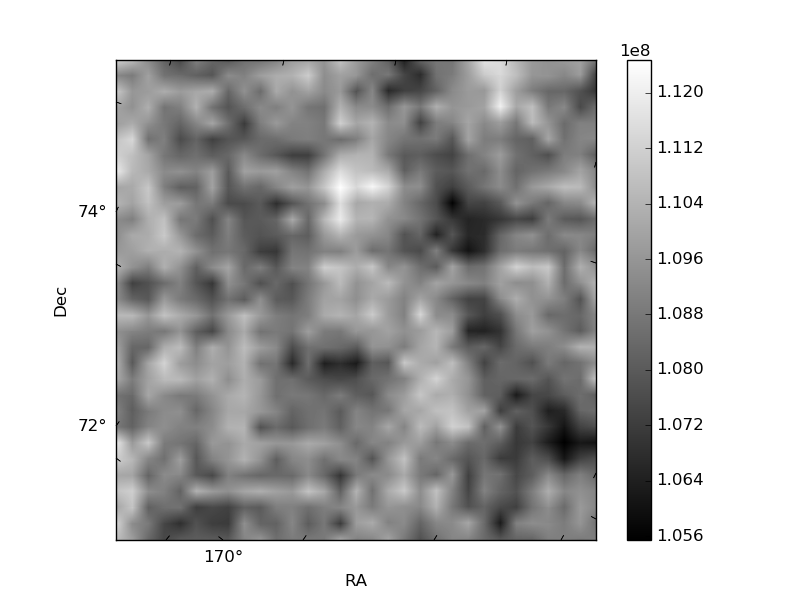
Quadrant B |
|---|---|---|---|
| Quadrant D | 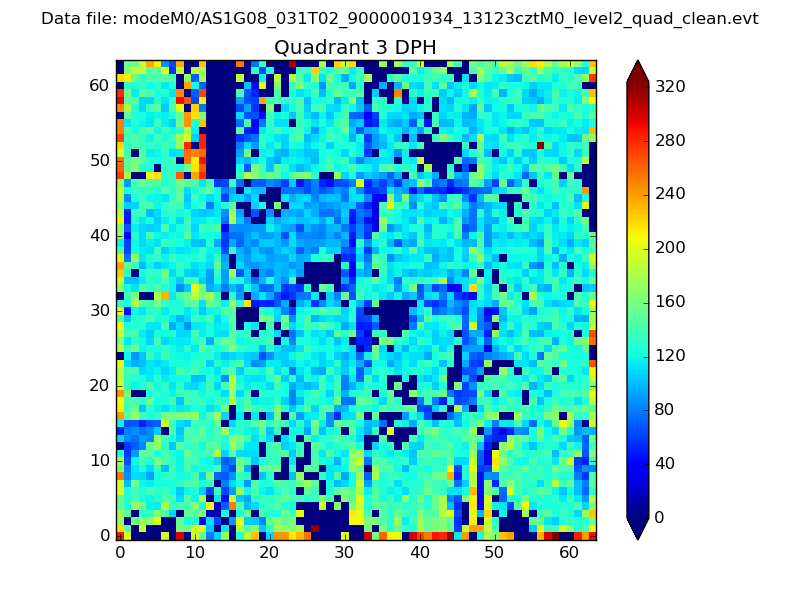 |
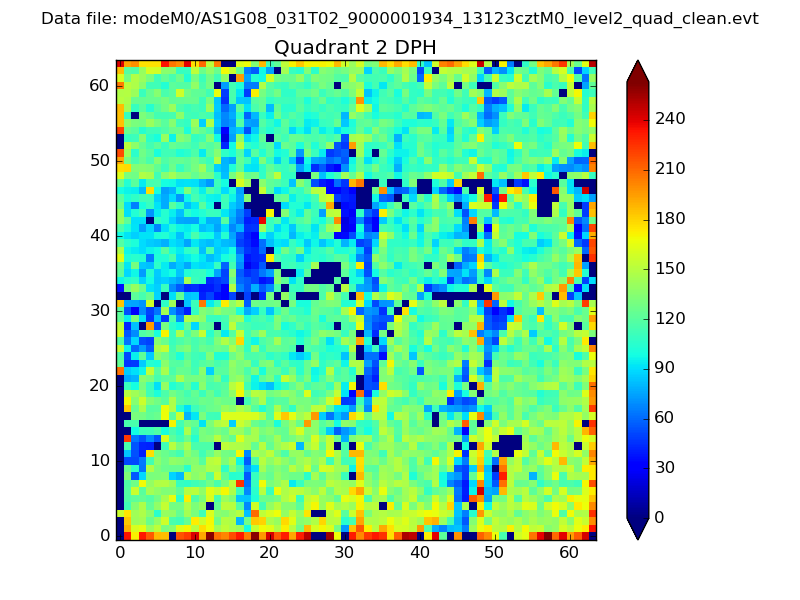 |
Quadrant C |
| Plot type | Count rate plots | Images |
|---|---|---|
| Comparison with Poisson distribution Blue bars denote a histogram of data divided into 1 sec bins. Red curve is a Poisson curve with rate = median count rate of data. |
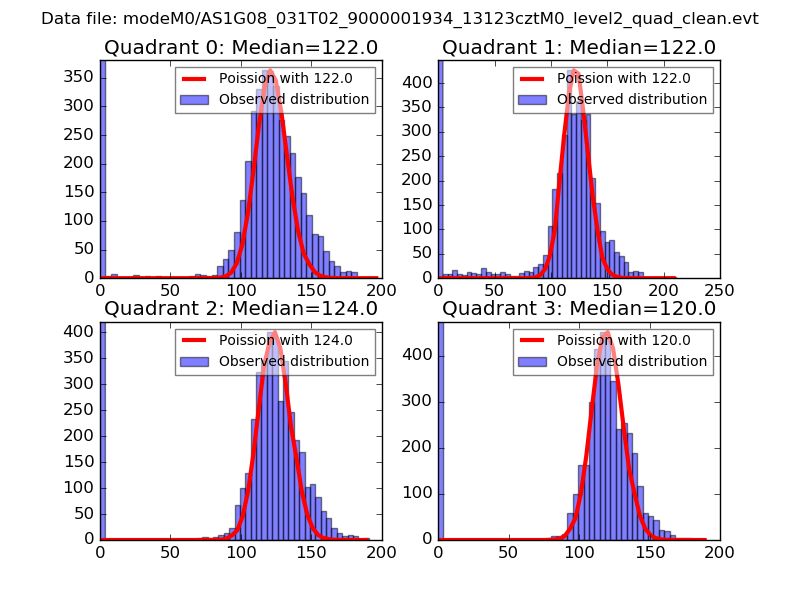 |
 |
| Quadrant-wise count rates Data is divided into 100 sec bins |
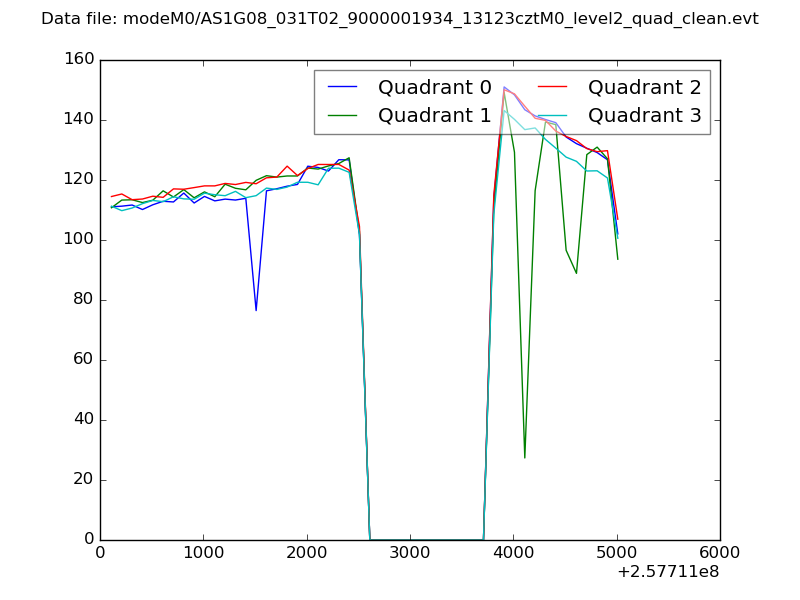 |
|
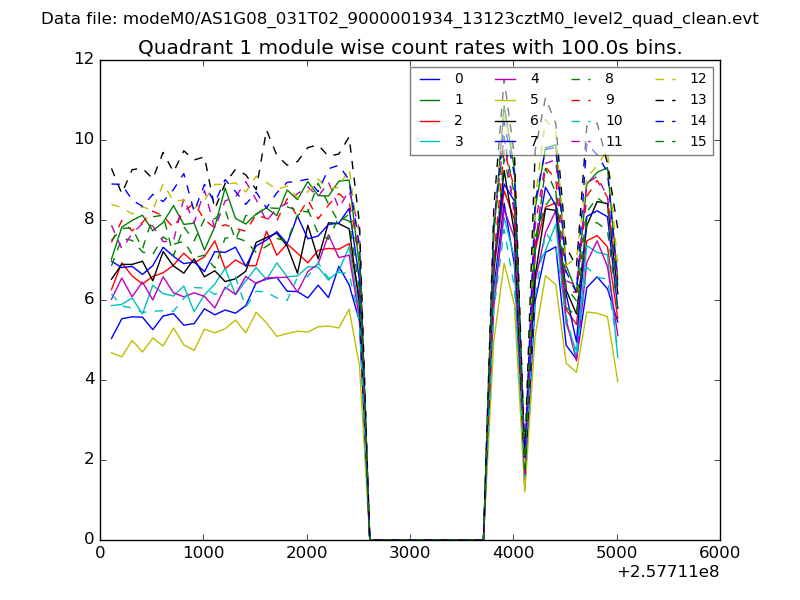
| Module-wise count rates for Quadrant A Data is divided into 100 sec bins |
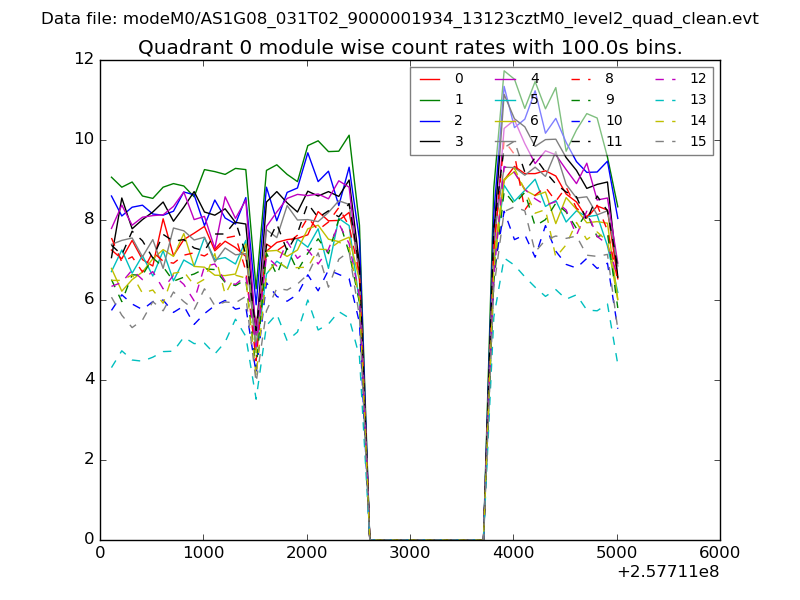 |
 |
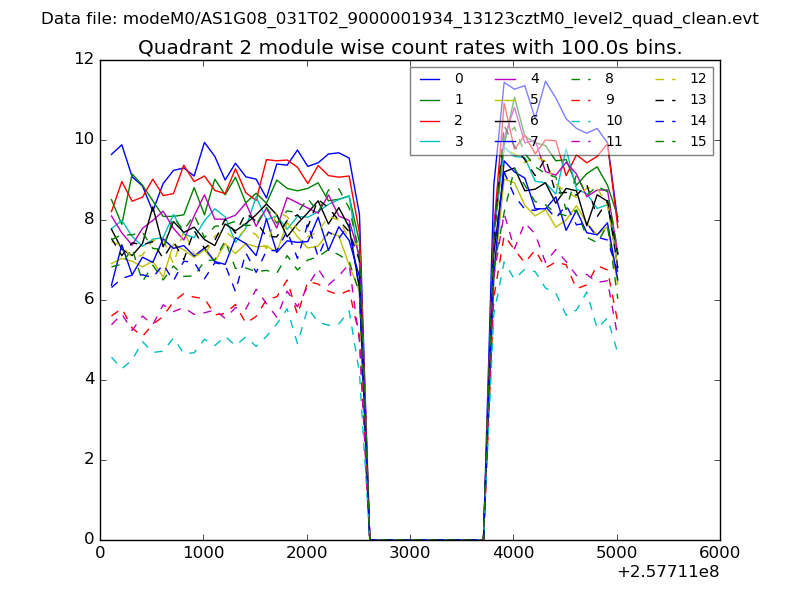
| Module-wise count rates for Quadrant B Data is divided into 100 sec bins |
 |
 |
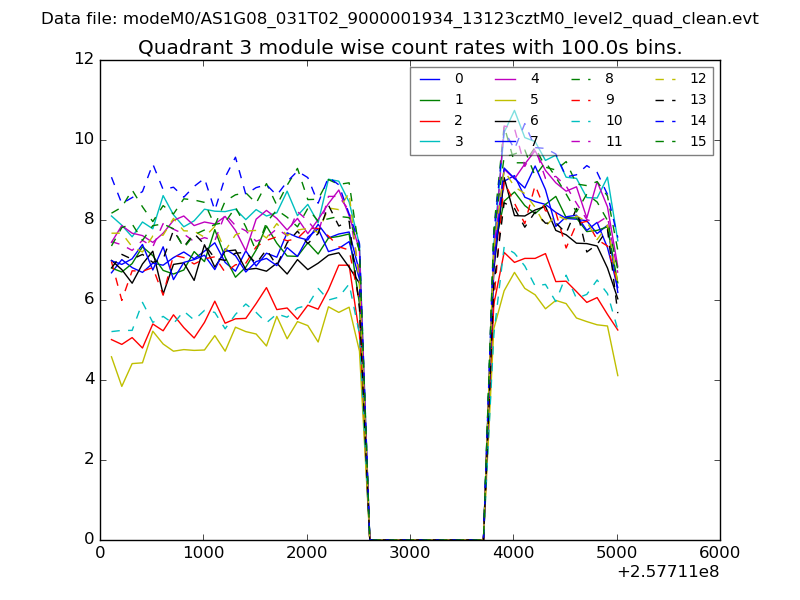
| Module-wise count rates for Quadrant C Data is divided into 100 sec bins |
 |
 |
| Module-wise count rates for Quadrant D Data is divided into 100 sec bins |
 |
 |
| Parameter | Plot |
|---|---|
| CZT HV Monitor |  |
| D_VDD | 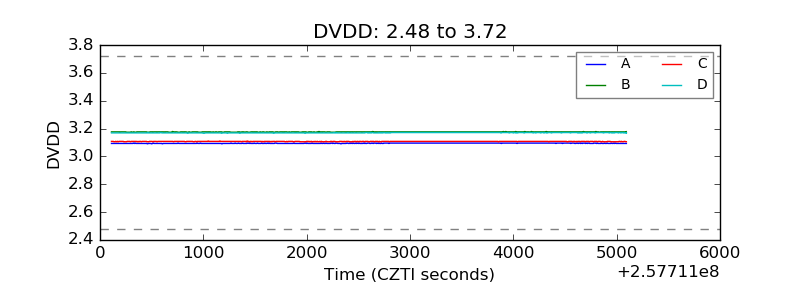 |
| Temperature 1 |  |
| Veto HV Monitor | 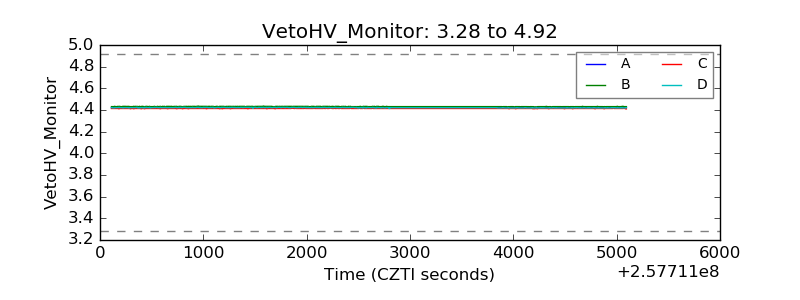 |
| Veto LLD |  |
| Alpha Counter | 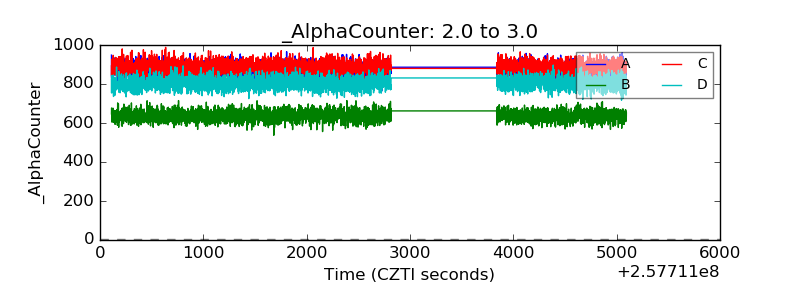 |
| _CPM_Rate | 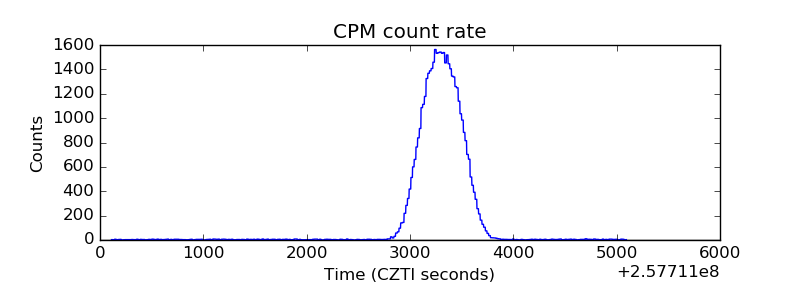 |
| CZT Counter | 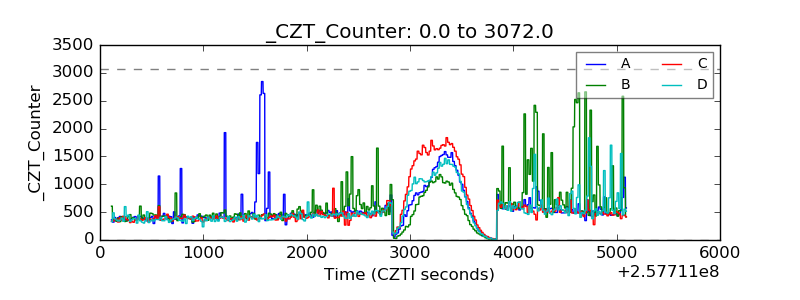 |
| +2.5 Volts monitor |  |
| +5 Volts monitor |  |
| _ROLL_ROT | 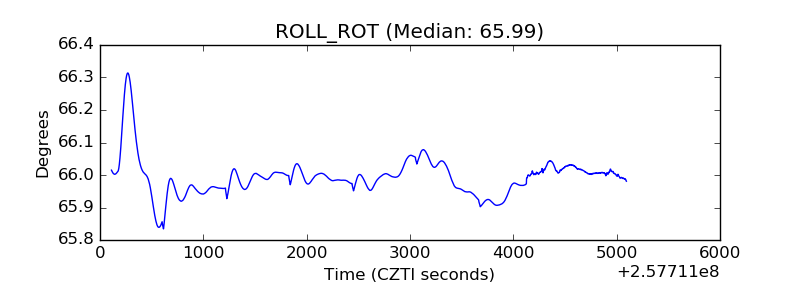 |
| _Roll_DEC | 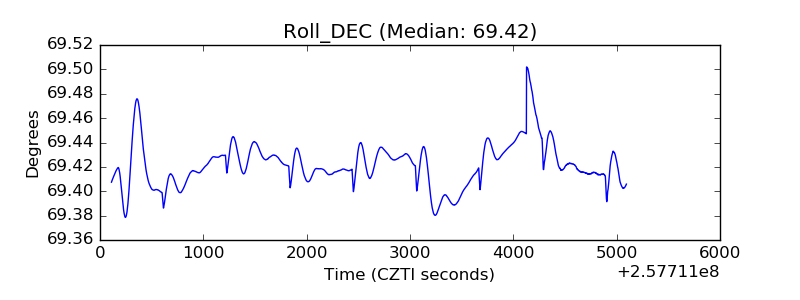 |
| _Roll_RA | 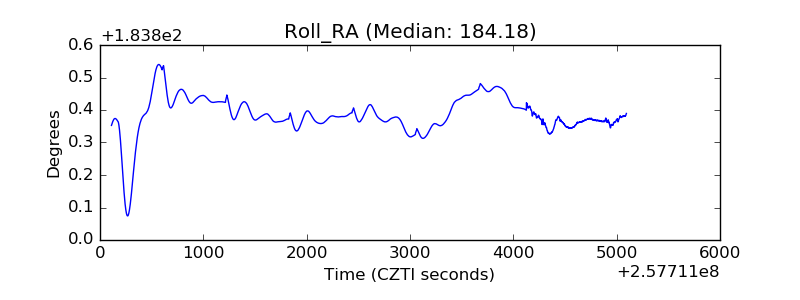 |
| Veto Counter | 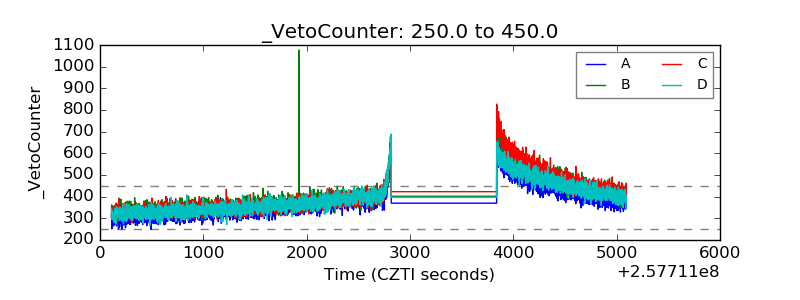 |