| Param | Original file | Final file |
|---|---|---|
| Filename | modeM0/AS1G08_031T02_9000001934_13126cztM0_level2.evt | modeM0/AS1G08_031T02_9000001934_13126cztM0_level2_quad_clean.evt |
| Size (bytes) | 479,727,360 | 114,649,920 |
| Size | 457.5 MB | 109.3 MB |
| Events in quadrant A | 3,298,538 | 760,716 |
| Events in quadrant B | 4,169,368 | 747,024 |
| Events in quadrant C | 2,936,602 | 787,724 |
| Events in quadrant D | 3,692,774 | 733,871 |
| Mode M9 | |||
|---|---|---|---|
| Quadrant | BADHDUFLAG | Total packets | Discarded packets |
| A | 0 | 16 | 0 |
| B | 0 | 16 | 0 |
| C | 0 | 16 | 0 |
| D | 0 | 17 | 0 |
| Mode M0 | |||
|---|---|---|---|
| Quadrant | BADHDUFLAG | Total packets | Discarded packets |
| A | 0 | 14164 | 3 |
| B | 0 | 16742 | 2 |
| C | 0 | 13190 | 2 |
| D | 0 | 15695 | 2 |
| Mode SS | |||
|---|---|---|---|
| Quadrant | BADHDUFLAG | Total packets | Discarded packets |
| A | 0 | 130 | 0 |
| B | 0 | 130 | 0 |
| C | 0 | 130 | 0 |
| D | 0 | 130 | 0 |
| Quadrant | Total seconds | Saturated seconds | Saturation percentage |
|---|---|---|---|
| A | 6343 | 57 | 0.898628% |
| B | 6343 | 565 | 8.907457% |
| C | 6343 | 24 | 0.378370% |
| D | 6343 | 104 | 1.639603% |
Noise dominated data is calculated using 1-second bins in cleaned event files. If a bin has >2000 counts, and if more than 50% of those come from <1% of pixels, then it is considered to be noise-dominated and hence unusable.
| Quadrant | # 1 sec bins | Bins with >0 counts | Bins with >2000 counts | High rate bins dominated by noise | Noise dominated (total time) | Noise dominated (detector-on time) | Marked lightcurve |
|---|---|---|---|---|---|---|---|
| A | 7569 | 6345 | 23 | 23 | 0.30% | 0.36% | 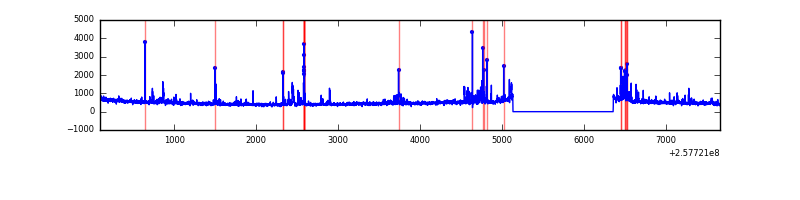 |
| B | 7569 | 6345 | 266 | 266 | 3.51% | 4.19% | 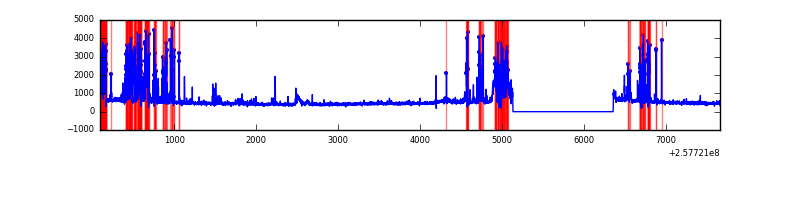 |
| C | 7569 | 6345 | 0 | 0 | 0.00% | 0.00% | 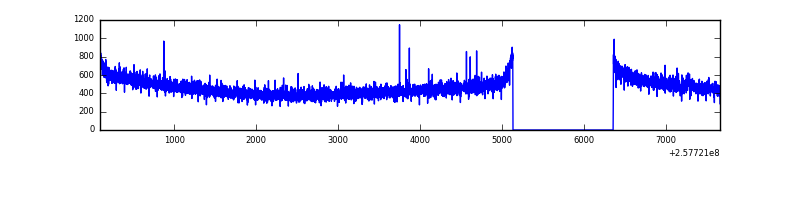 |
| D | 7569 | 6345 | 74 | 74 | 0.98% | 1.17% | 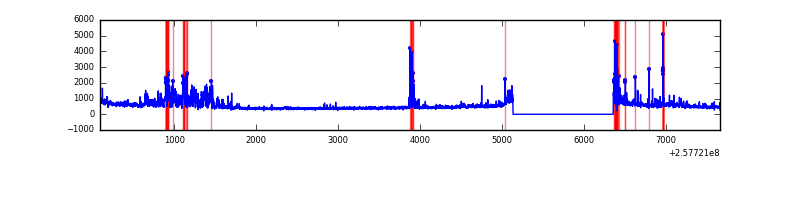 |
Top three noisy pixels from each quadrant. If the there are fewer than three noisy pixels in the level2.evt file, extra rows are filled as -1
| Pixel properties | Quadrant properties | ||||||
|---|---|---|---|---|---|---|---|
| Quadrant | DetID | PixID | Counts | Sigma | Mean | Median | Sigma |
| A | 4 | 2 | 284992 | 1879.94 | 751 | 735 | 151.2 |
| A | 12 | 189 | 80114 | 524.98 | 751 | 735 | 151.2 |
| A | 1 | 162 | 15714 | 99.06 | 751 | 735 | 151.2 |
| B | 4 | 239 | 1022855 | 7634.82 | 726 | 708 | 133.9 |
| B | 3 | 64 | 122658 | 910.89 | 726 | 708 | 133.9 |
| B | 0 | 85 | 70229 | 519.28 | 726 | 708 | 133.9 |
| C | 14 | 225 | 7338 | 38.54 | 750 | 753 | 170.9 |
| C | 13 | 61 | 5363 | 26.98 | 750 | 753 | 170.9 |
| C | 15 | 208 | 2654 | 11.13 | 750 | 753 | 170.9 |
| D | 1 | 52 | 817483 | 4738.84 | 727 | 706 | 172.4 |
| D | 10 | 157 | 91486 | 526.69 | 727 | 706 | 172.4 |
| D | 2 | 234 | 21715 | 121.89 | 727 | 706 | 172.4 |
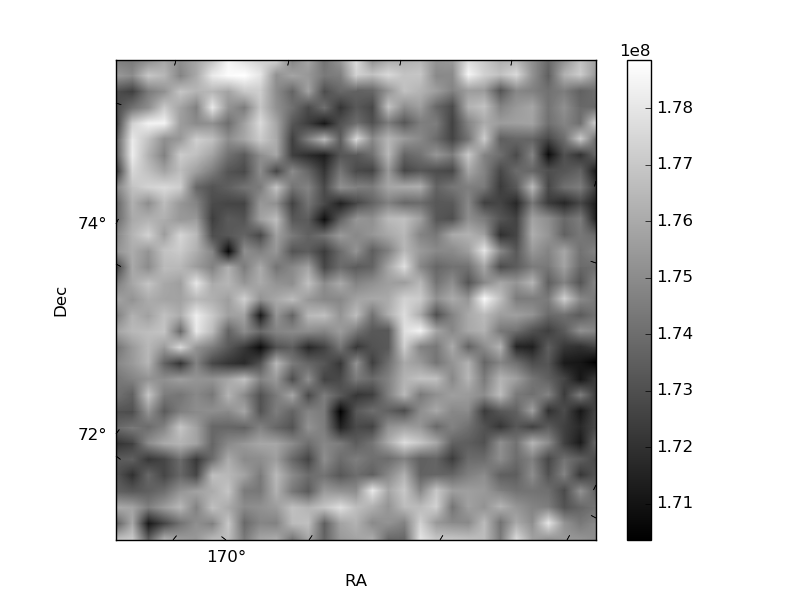
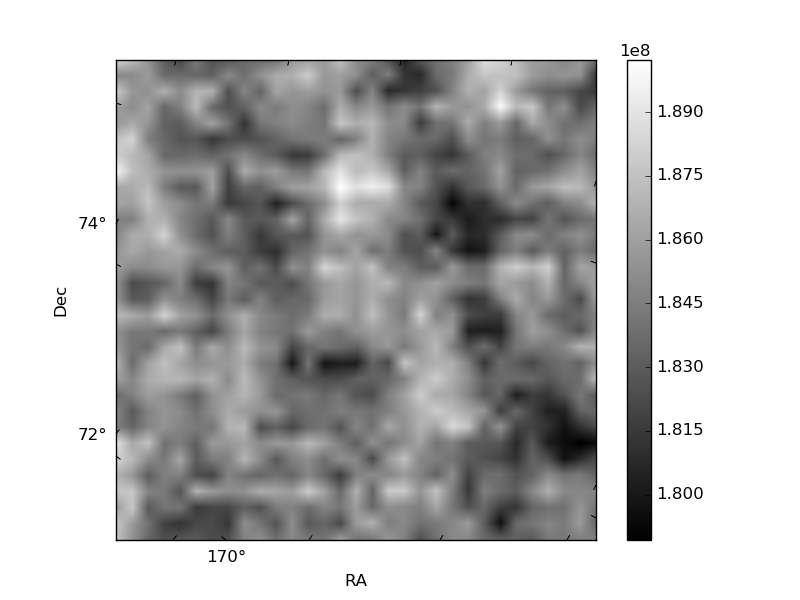
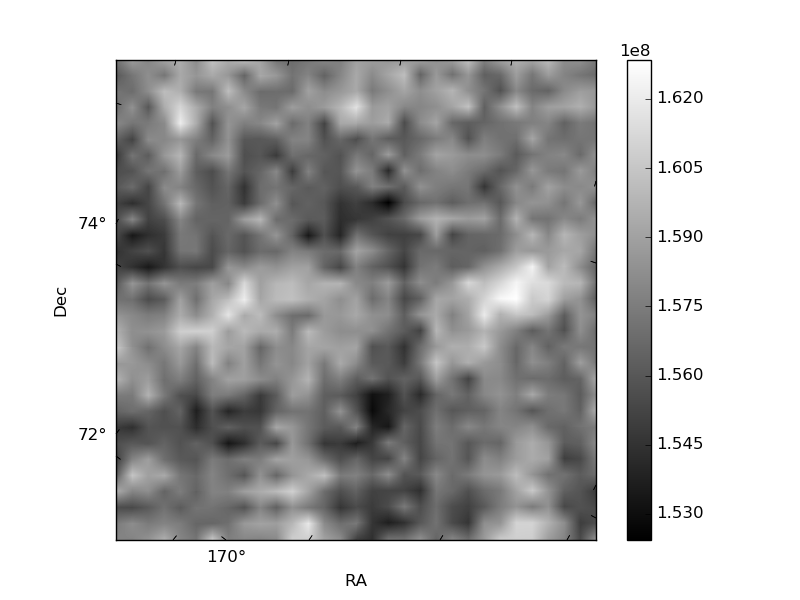
Histogram calculated using DETX and DETY for each event in the final _common_clean file
| Quadrant A | 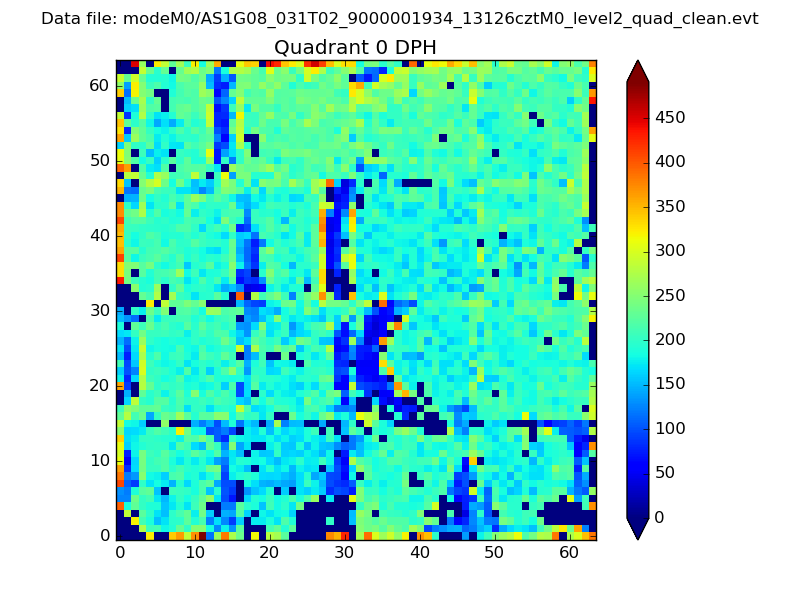 |
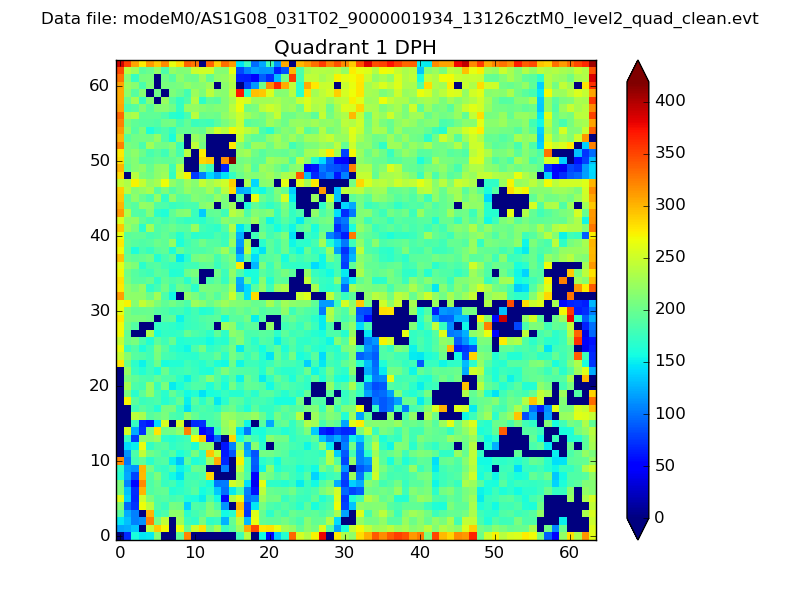 |
Quadrant B |
|---|---|---|---|
| Quadrant D |  |
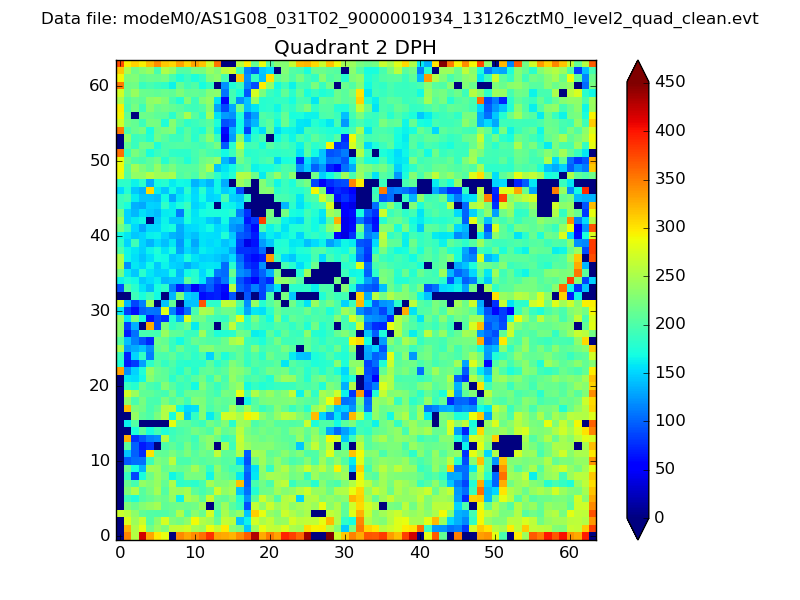 |
Quadrant C |
| Plot type | Count rate plots | Images |
|---|---|---|
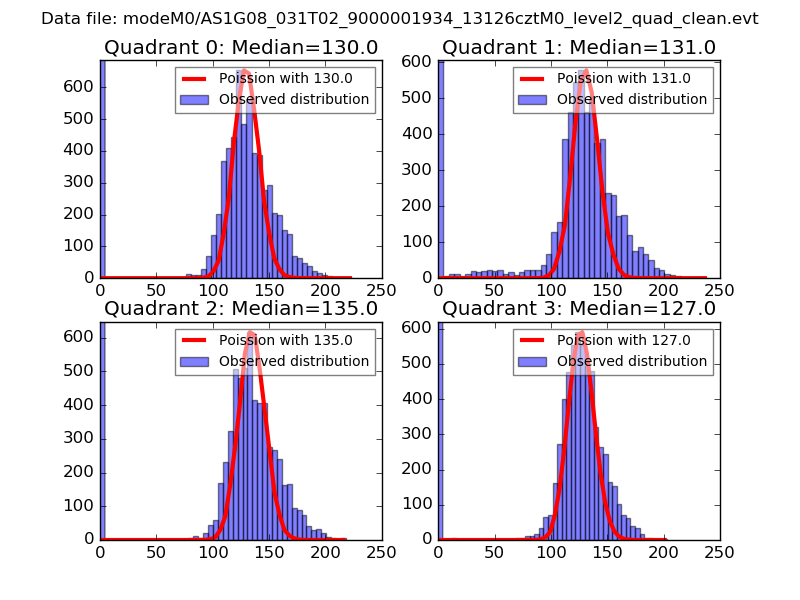
| Comparison with Poisson distribution Blue bars denote a histogram of data divided into 1 sec bins. Red curve is a Poisson curve with rate = median count rate of data. |
 |
 |
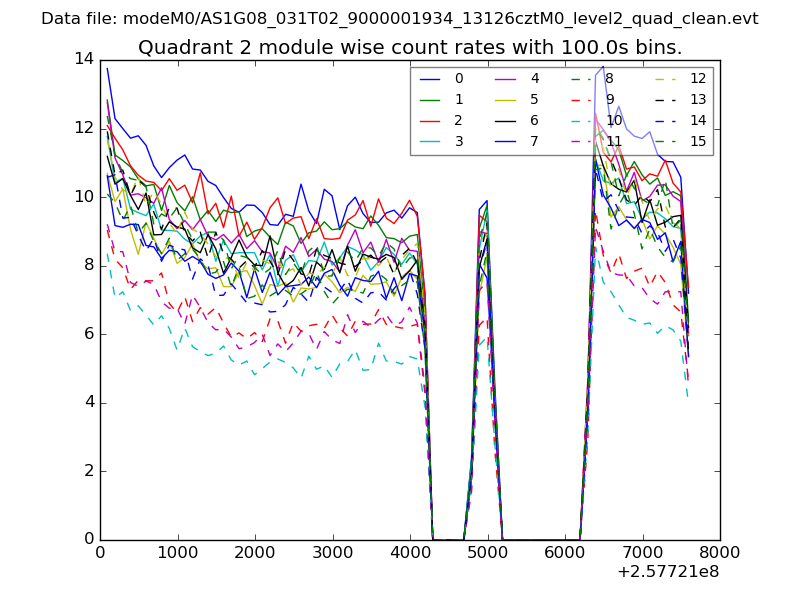
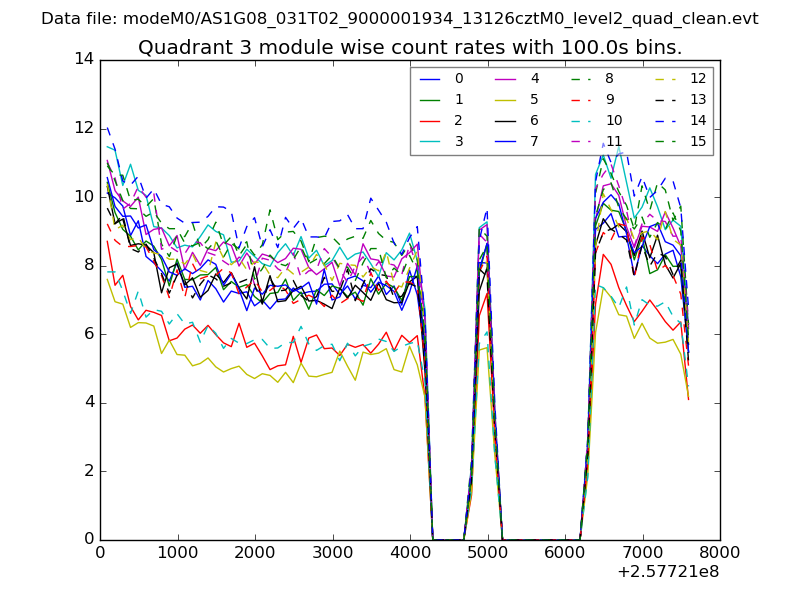
| Quadrant-wise count rates Data is divided into 100 sec bins |
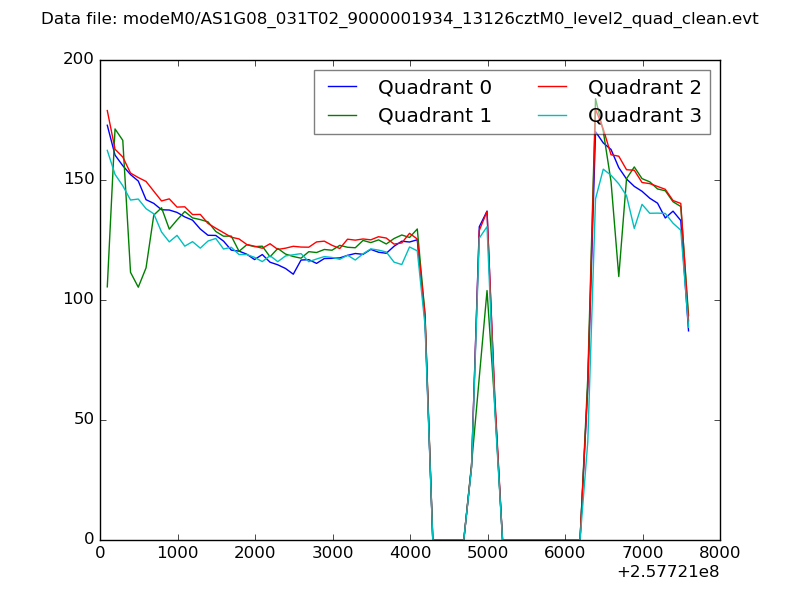 |
|
| Module-wise count rates for Quadrant A Data is divided into 100 sec bins |
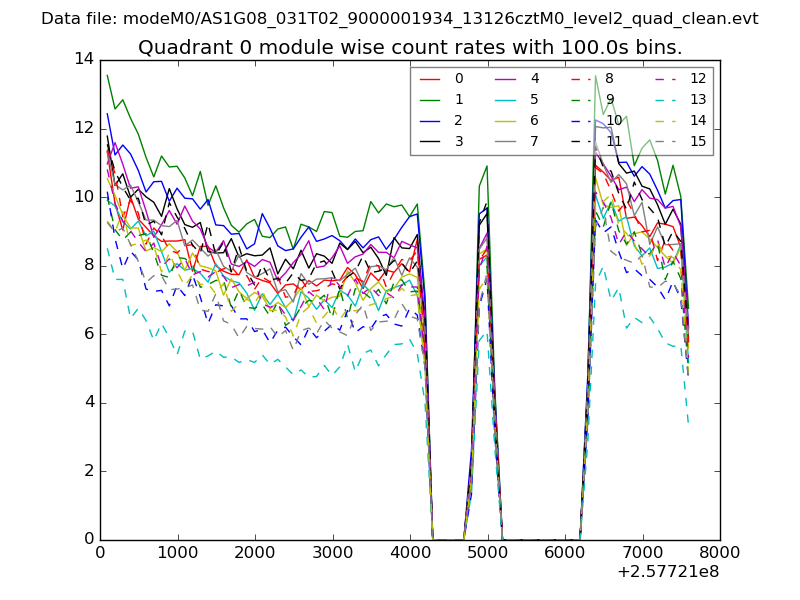 |
 |
| Module-wise count rates for Quadrant B Data is divided into 100 sec bins |
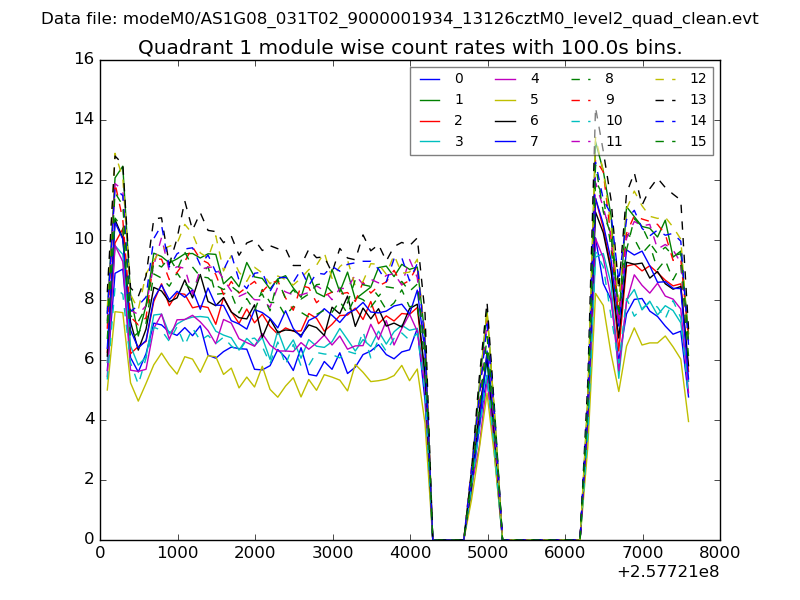 |
 |
| Module-wise count rates for Quadrant C Data is divided into 100 sec bins |
 |
 |
| Module-wise count rates for Quadrant D Data is divided into 100 sec bins |
 |
 |
| Parameter | Plot |
|---|---|
| CZT HV Monitor | 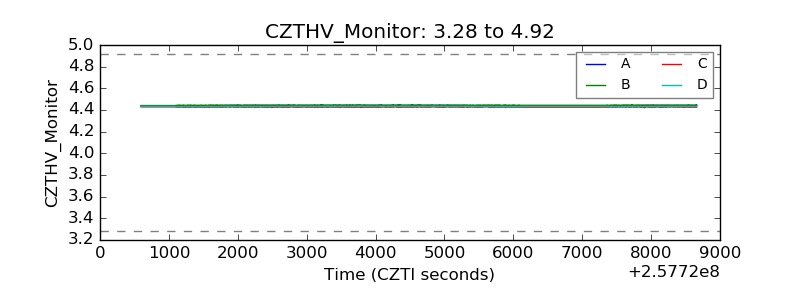 |
| D_VDD | 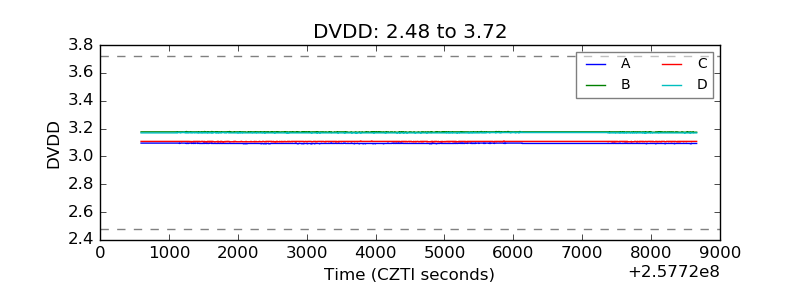 |
| Temperature 1 | 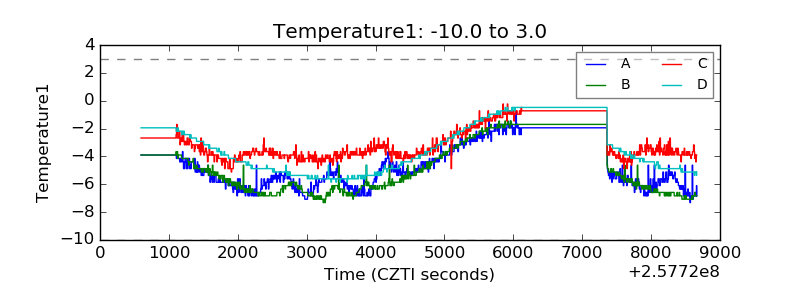 |
| Veto HV Monitor | 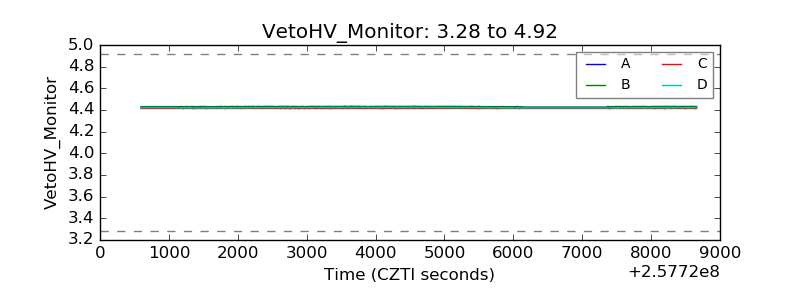 |
| Veto LLD | 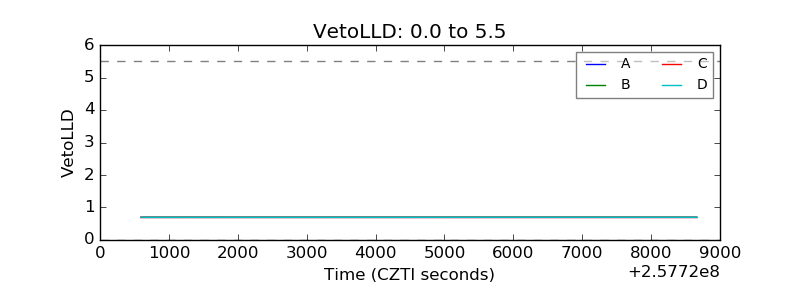 |
| Alpha Counter | 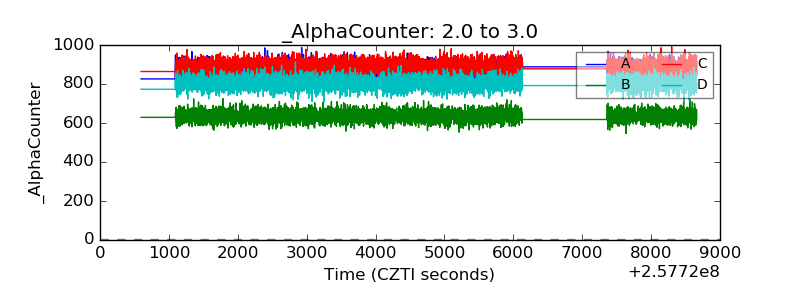 |
| _CPM_Rate | 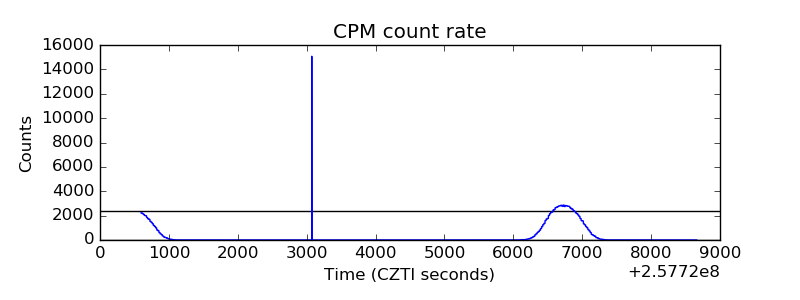 |
| CZT Counter |  |
| +2.5 Volts monitor | 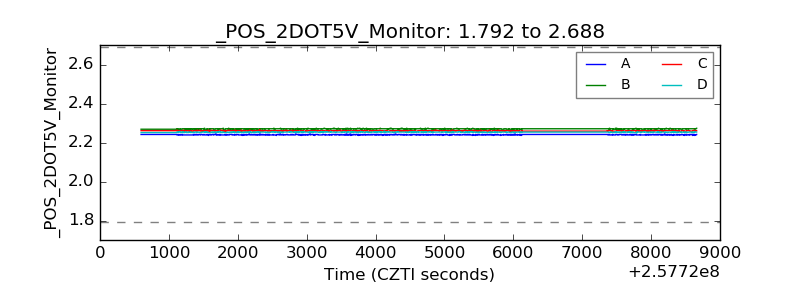 |
| +5 Volts monitor |  |
| _ROLL_ROT | 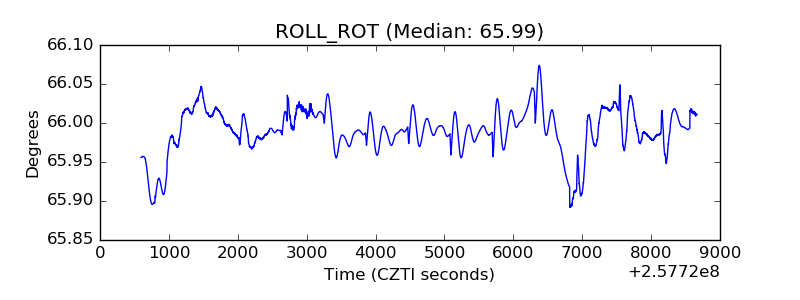 |
| _Roll_DEC | 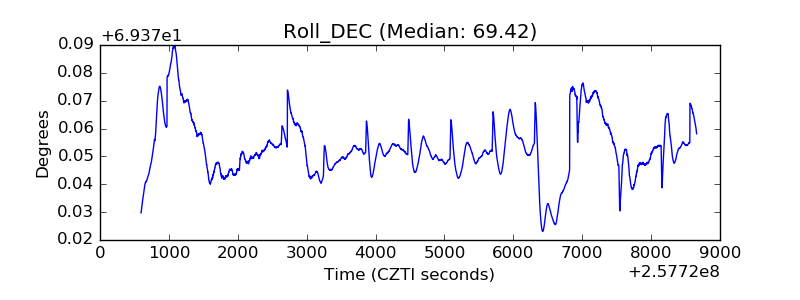 |
| _Roll_RA |  |
| Veto Counter | 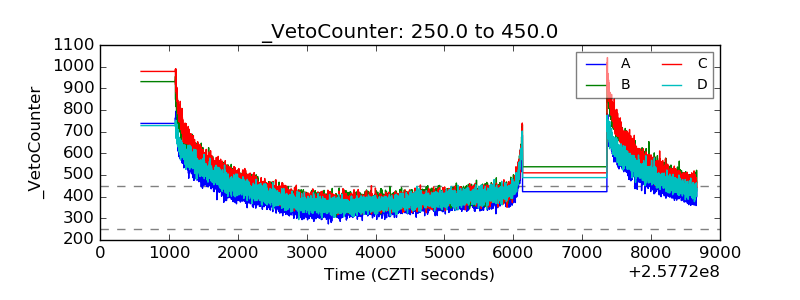 |