| Param | Original file | Final file |
|---|---|---|
| Filename | modeM0/AS1G08_031T02_9000001934_13128cztM0_level2.evt | modeM0/AS1G08_031T02_9000001934_13128cztM0_level2_quad_clean.evt |
| Size (bytes) | 905,829,120 | 106,669,440 |
| Size | 863.9 MB | 101.7 MB |
| Events in quadrant A | 3,340,264 | 795,948 |
| Events in quadrant B | 4,597,669 | 777,436 |
| Events in quadrant C | 2,965,070 | 811,830 |
| Events in quadrant D | 16,088,370 | 386,681 |
| Mode M9 | |||
|---|---|---|---|
| Quadrant | BADHDUFLAG | Total packets | Discarded packets |
| A | 0 | 21 | 0 |
| B | 0 | 21 | 0 |
| C | 0 | 21 | 0 |
| D | 0 | 22 | 0 |
| Mode M0 | |||
|---|---|---|---|
| Quadrant | BADHDUFLAG | Total packets | Discarded packets |
| A | 0 | 14255 | 3 |
| B | 0 | 18002 | 2 |
| C | 0 | 13383 | 2 |
| D | 0 | 52307 | 2 |
| Mode SS | |||
|---|---|---|---|
| Quadrant | BADHDUFLAG | Total packets | Discarded packets |
| A | 0 | 132 | 0 |
| B | 0 | 132 | 0 |
| C | 0 | 132 | 0 |
| D | 0 | 132 | 0 |
| Quadrant | Total seconds | Saturated seconds | Saturation percentage |
|---|---|---|---|
| A | 6540 | 45 | 0.688073% |
| B | 6540 | 604 | 9.235474% |
| C | 6540 | 10 | 0.152905% |
| D | 6540 | 5743 | 87.813456% |
Noise dominated data is calculated using 1-second bins in cleaned event files. If a bin has >2000 counts, and if more than 50% of those come from <1% of pixels, then it is considered to be noise-dominated and hence unusable.
| Quadrant | # 1 sec bins | Bins with >0 counts | Bins with >2000 counts | High rate bins dominated by noise | Noise dominated (total time) | Noise dominated (detector-on time) | Marked lightcurve |
|---|---|---|---|---|---|---|---|
| A | 7851 | 6542 | 28 | 28 | 0.36% | 0.43% | 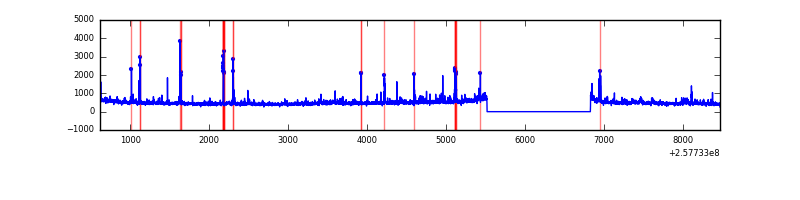 |
| B | 7851 | 6542 | 306 | 306 | 3.90% | 4.68% | 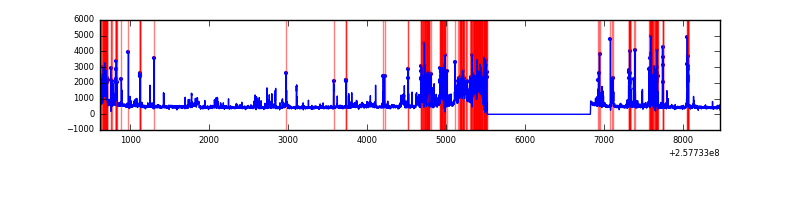 |
| C | 7851 | 6542 | 0 | 0 | 0.00% | 0.00% | 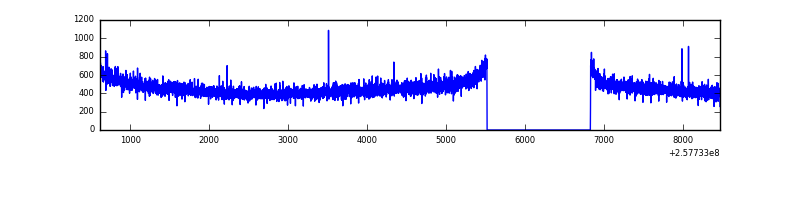 |
| D | 7851 | 6541 | 5667 | 5667 | 72.18% | 86.64% | 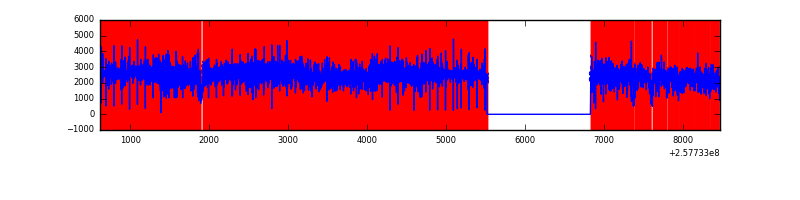 |
Top three noisy pixels from each quadrant. If the there are fewer than three noisy pixels in the level2.evt file, extra rows are filled as -1
| Pixel properties | Quadrant properties | ||||||
|---|---|---|---|---|---|---|---|
| Quadrant | DetID | PixID | Counts | Sigma | Mean | Median | Sigma |
| A | 4 | 2 | 125139 | 812.93 | 770 | 756 | 153.0 |
| A | 12 | 189 | 103284 | 670.09 | 770 | 756 | 153.0 |
| A | 15 | 223 | 76222 | 493.22 | 770 | 756 | 153.0 |
| B | 4 | 239 | 1271525 | 9211.41 | 746 | 729 | 138.0 |
| B | 0 | 85 | 286724 | 2073.04 | 746 | 729 | 138.0 |
| B | 0 | 230 | 42751 | 304.6 | 746 | 729 | 138.0 |
| C | 13 | 61 | 5719 | 28.7 | 759 | 764 | 172.6 |
| C | 14 | 225 | 2718 | 11.32 | 759 | 764 | 172.6 |
| C | 14 | 234 | 2633 | 10.83 | 759 | 764 | 172.6 |
| D | 13 | 122 | 13965582 | 141454.18 | 417 | 406 | 98.7 |
| D | 1 | 52 | 508268 | 5144.17 | 417 | 406 | 98.7 |
| D | 2 | 234 | 12626 | 123.78 | 417 | 406 | 98.7 |
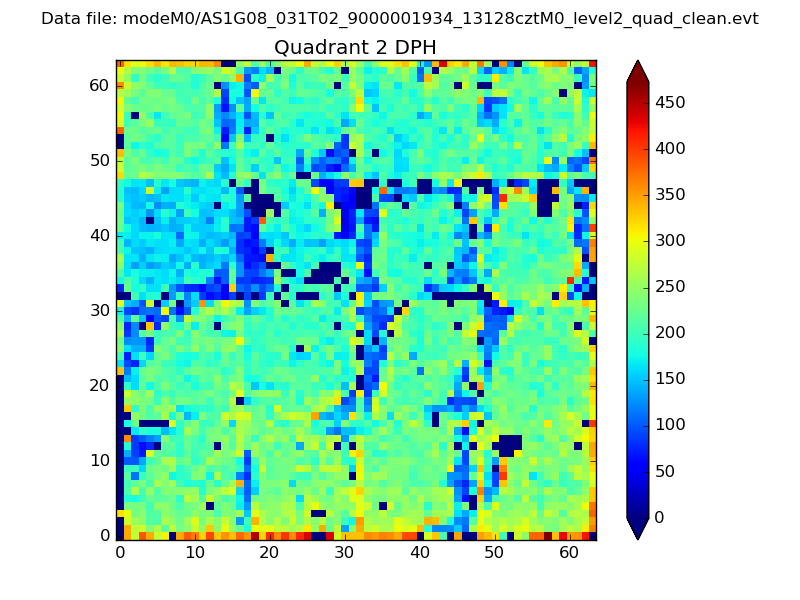
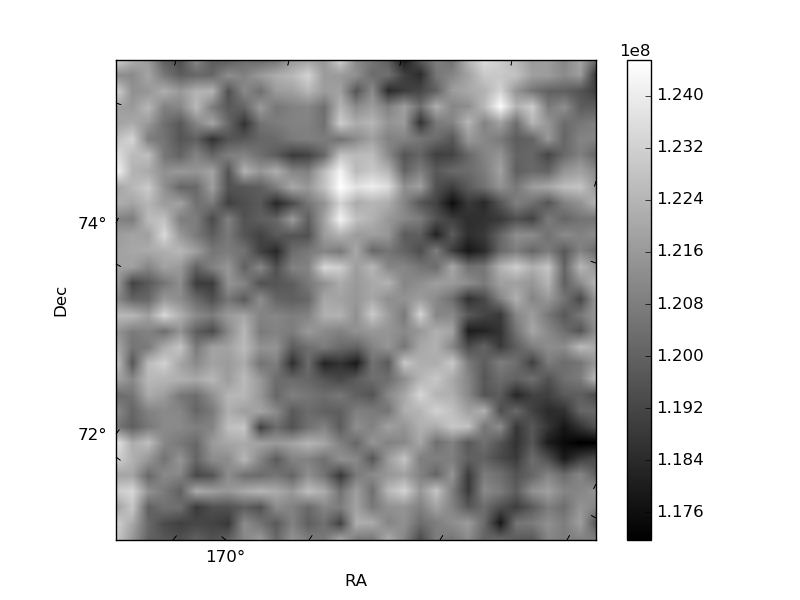
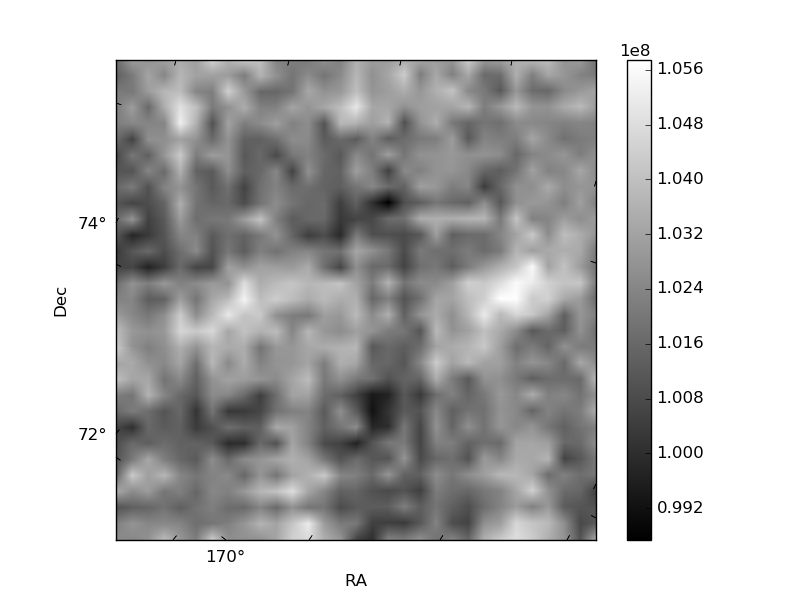
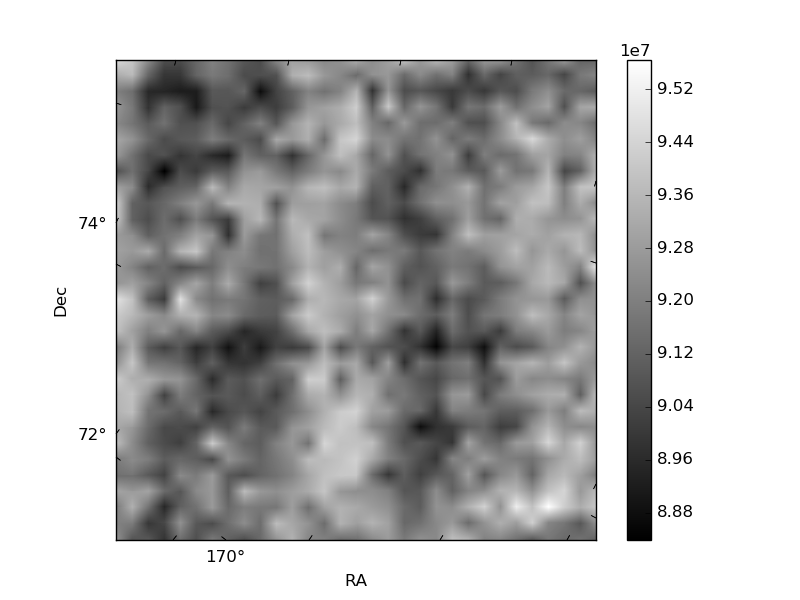
Histogram calculated using DETX and DETY for each event in the final _common_clean file
| Quadrant A | 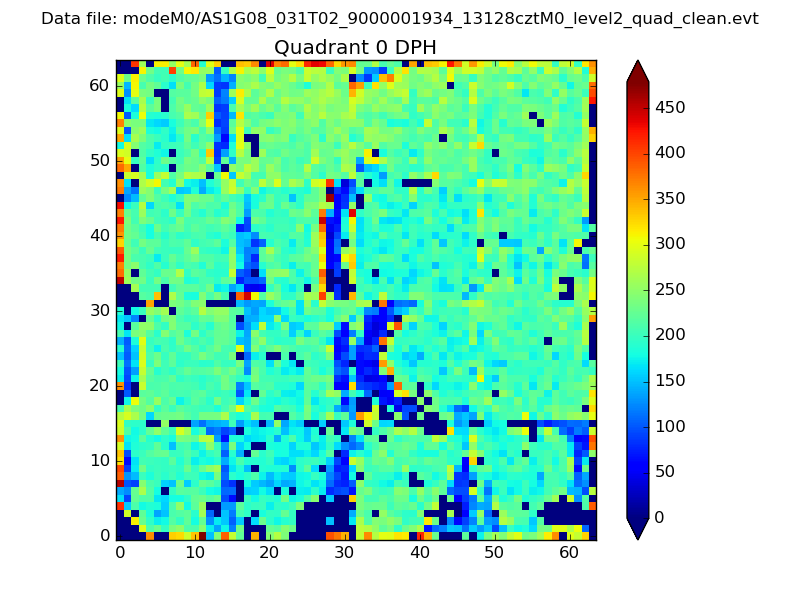 |
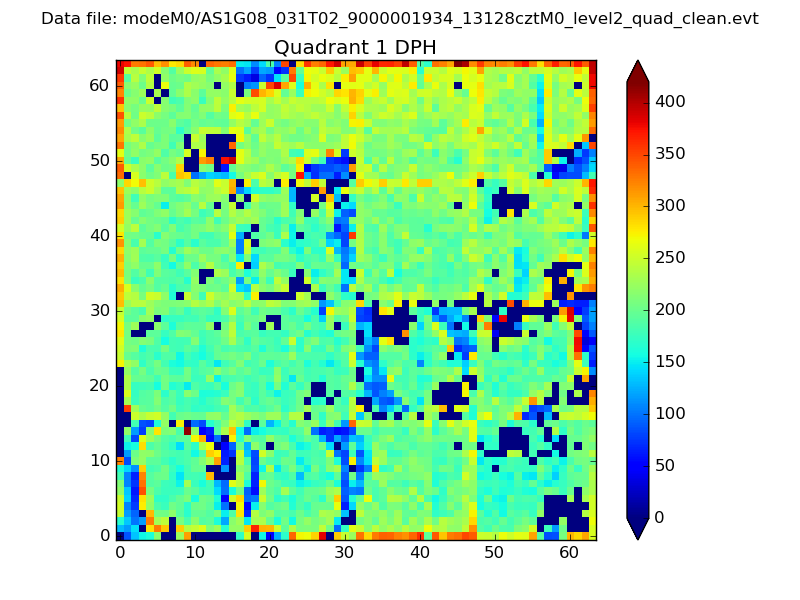 |
Quadrant B |
|---|---|---|---|
| Quadrant D | 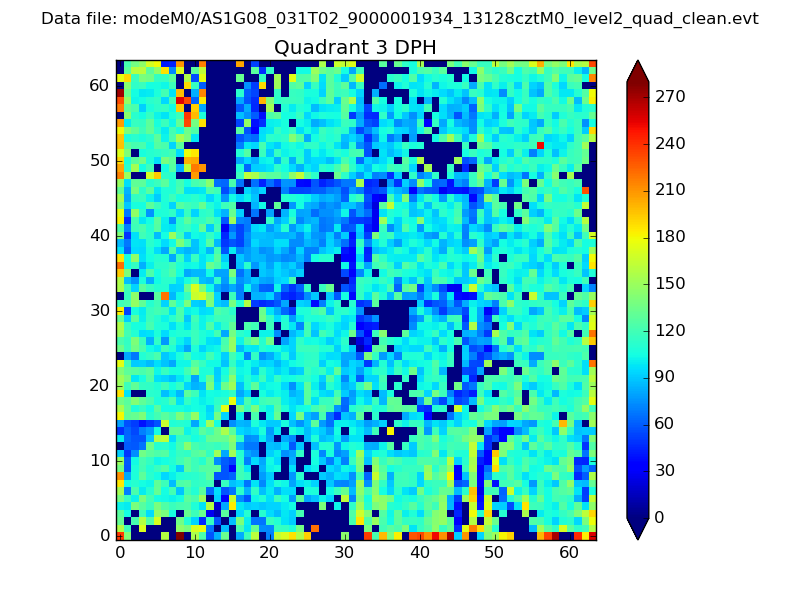 |
 |
Quadrant C |
| Plot type | Count rate plots | Images |
|---|---|---|
| Comparison with Poisson distribution Blue bars denote a histogram of data divided into 1 sec bins. Red curve is a Poisson curve with rate = median count rate of data. |
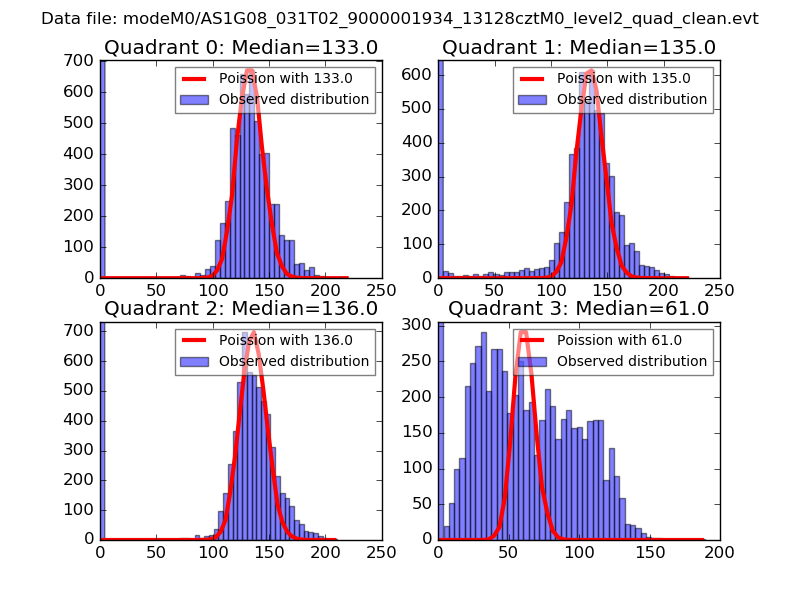 |
 |
| Quadrant-wise count rates Data is divided into 100 sec bins |
 |
|
| Module-wise count rates for Quadrant A Data is divided into 100 sec bins |
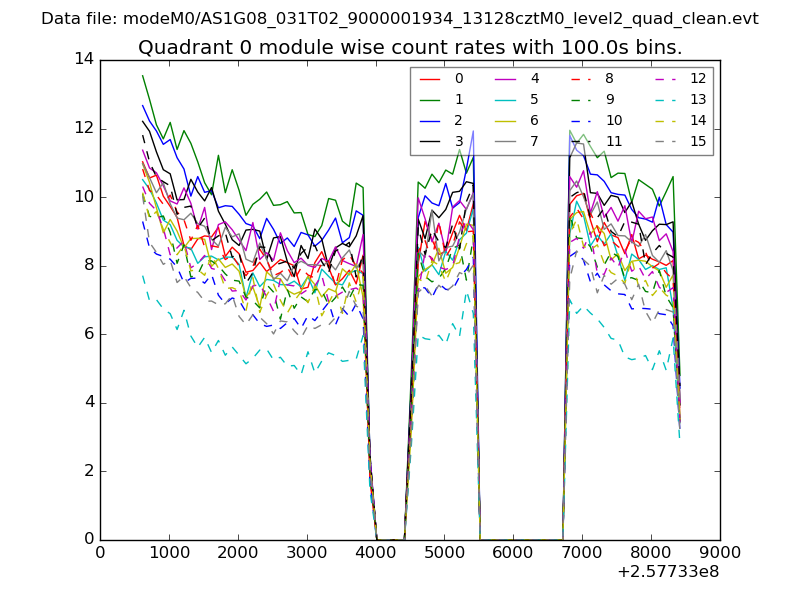 |
 |
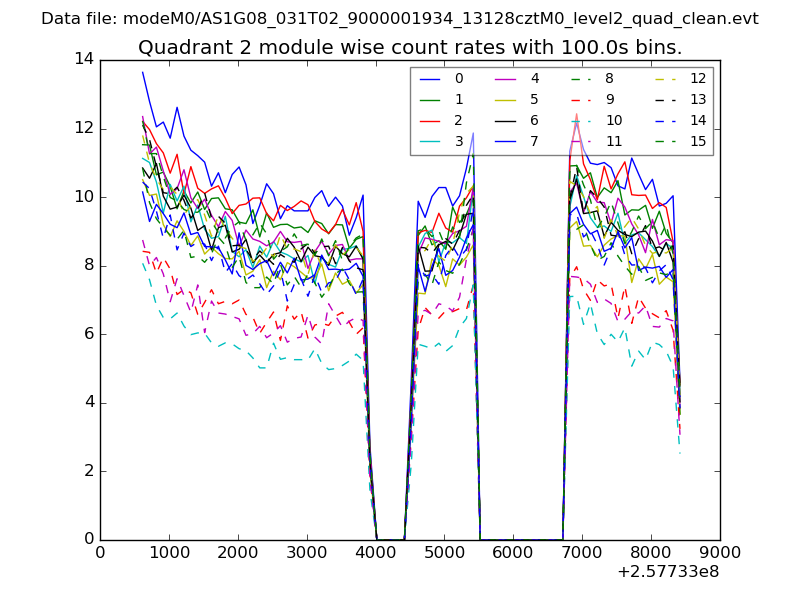
| Module-wise count rates for Quadrant B Data is divided into 100 sec bins |
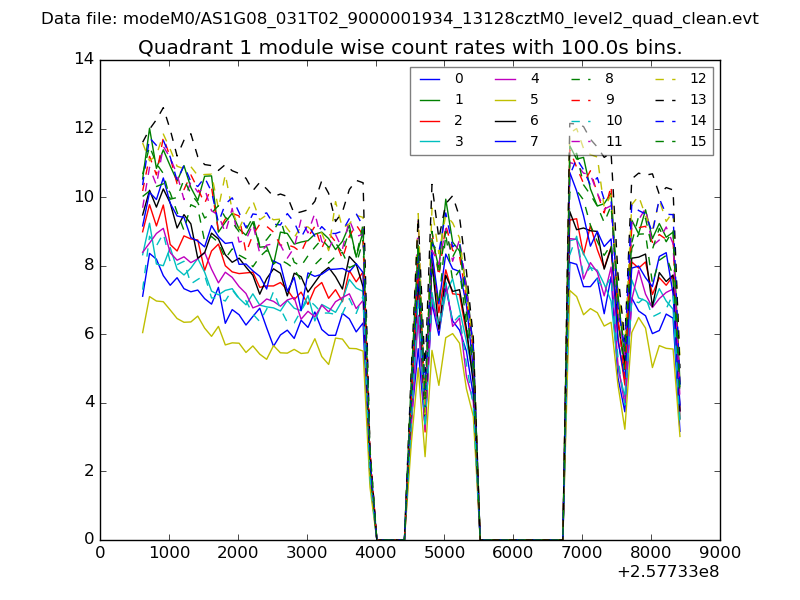 |
 |
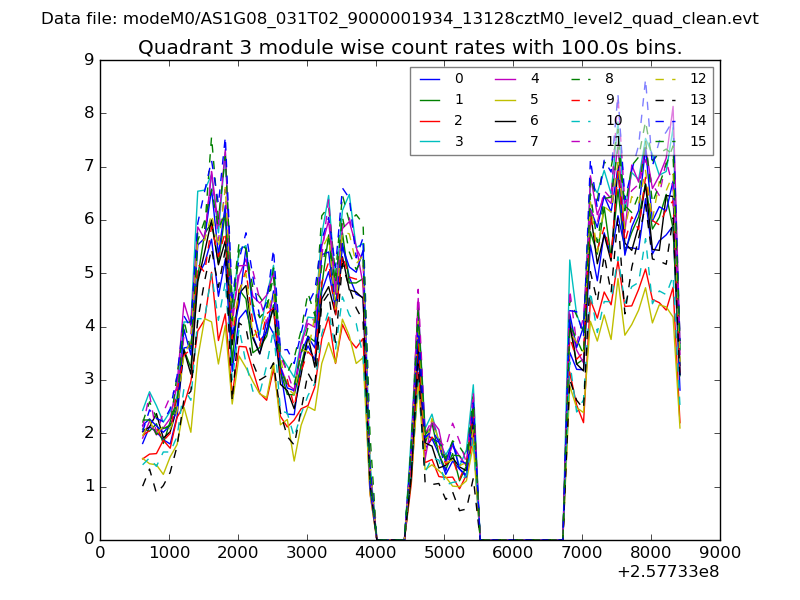
| Module-wise count rates for Quadrant C Data is divided into 100 sec bins |
 |
 |
| Module-wise count rates for Quadrant D Data is divided into 100 sec bins |
 |
 |
| Parameter | Plot |
|---|---|
| CZT HV Monitor | 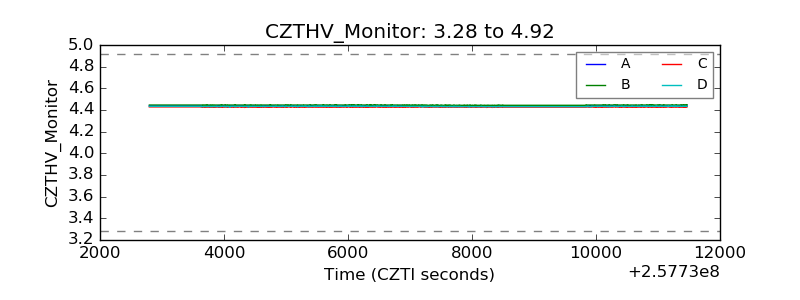 |
| D_VDD | 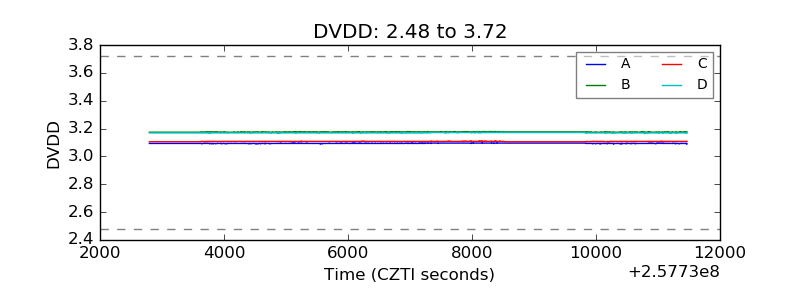 |
| Temperature 1 |  |
| Veto HV Monitor | 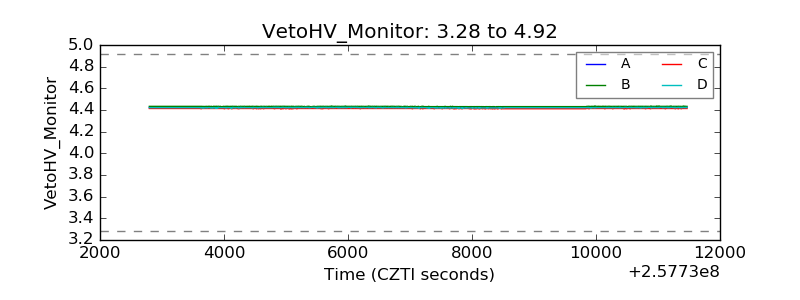 |
| Veto LLD | 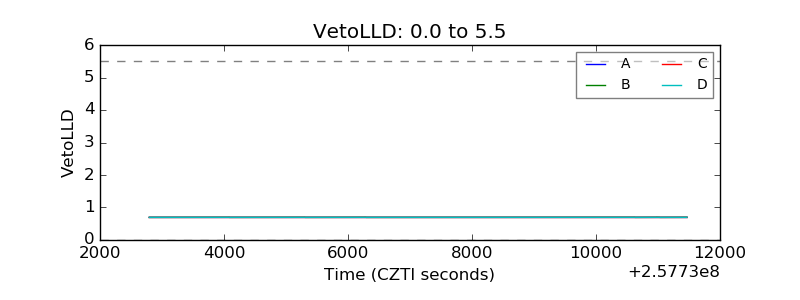 |
| Alpha Counter | 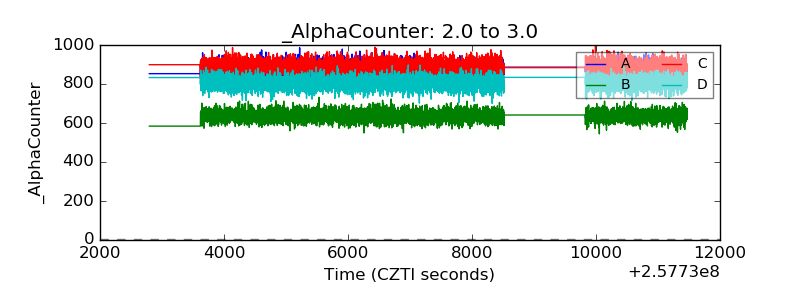 |
| _CPM_Rate | 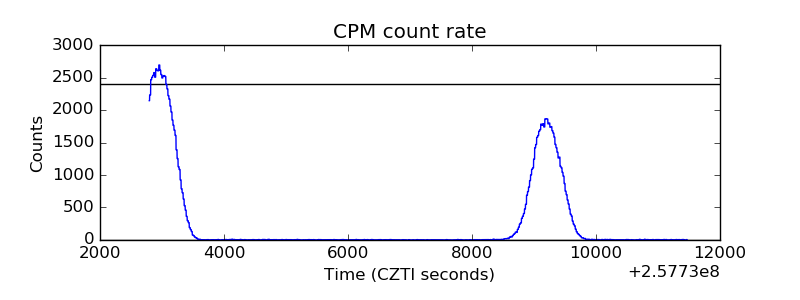 |
| CZT Counter |  |
| +2.5 Volts monitor |  |
| +5 Volts monitor |  |
| _ROLL_ROT | 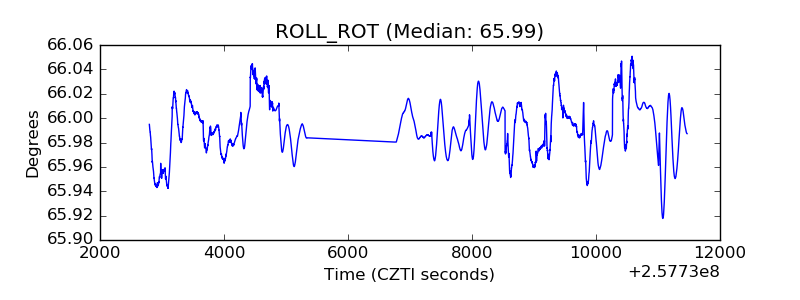 |
| _Roll_DEC | 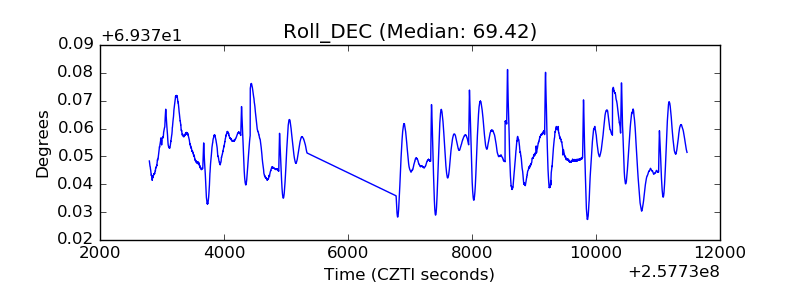 |
| _Roll_RA |  |
| Veto Counter | 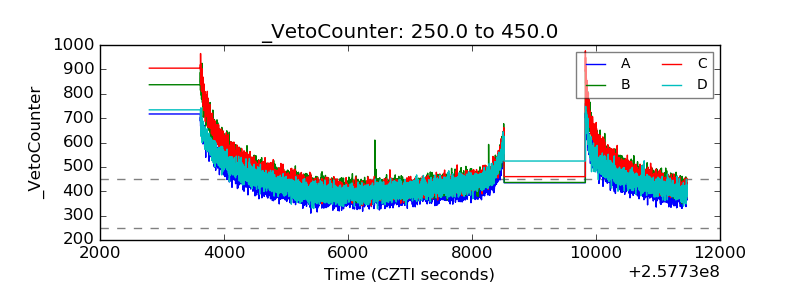 |