| Param | Original file | Final file |
|---|---|---|
| Filename | modeM0/AS1G08_031T02_9000001934_13129cztM0_level2.evt | modeM0/AS1G08_031T02_9000001934_13129cztM0_level2_quad_clean.evt |
| Size (bytes) | 590,771,520 | 104,892,480 |
| Size | 563.4 MB | 100.0 MB |
| Events in quadrant A | 3,058,282 | 719,079 |
| Events in quadrant B | 5,162,113 | 659,985 |
| Events in quadrant C | 2,727,128 | 728,885 |
| Events in quadrant D | 6,523,412 | 635,057 |
| Mode M9 | |||
|---|---|---|---|
| Quadrant | BADHDUFLAG | Total packets | Discarded packets |
| A | 0 | 12 | 0 |
| B | 0 | 12 | 0 |
| C | 0 | 12 | 0 |
| D | 0 | 12 | 0 |
| Mode M0 | |||
|---|---|---|---|
| Quadrant | BADHDUFLAG | Total packets | Discarded packets |
| A | 0 | 13276 | 2 |
| B | 0 | 19534 | 1 |
| C | 0 | 12611 | 1 |
| D | 0 | 23752 | 1 |
| Mode SS | |||
|---|---|---|---|
| Quadrant | BADHDUFLAG | Total packets | Discarded packets |
| A | 0 | 126 | 0 |
| B | 0 | 126 | 0 |
| C | 0 | 126 | 0 |
| D | 0 | 126 | 0 |
| Quadrant | Total seconds | Saturated seconds | Saturation percentage |
|---|---|---|---|
| A | 6201 | 34 | 0.548299% |
| B | 6201 | 1034 | 16.674730% |
| C | 6201 | 7 | 0.112885% |
| D | 6201 | 1168 | 18.835672% |
Noise dominated data is calculated using 1-second bins in cleaned event files. If a bin has >2000 counts, and if more than 50% of those come from <1% of pixels, then it is considered to be noise-dominated and hence unusable.
| Quadrant | # 1 sec bins | Bins with >0 counts | Bins with >2000 counts | High rate bins dominated by noise | Noise dominated (total time) | Noise dominated (detector-on time) | Marked lightcurve |
|---|---|---|---|---|---|---|---|
| A | 7403 | 6203 | 1 | 1 | 0.01% | 0.02% | 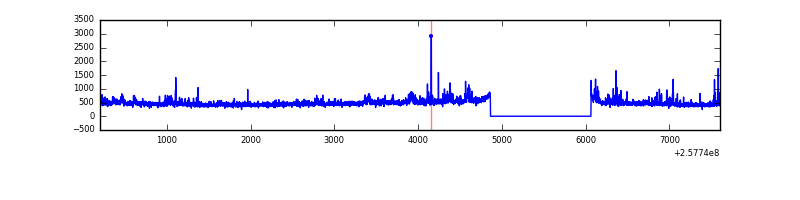 |
| B | 7403 | 6203 | 637 | 637 | 8.60% | 10.27% | 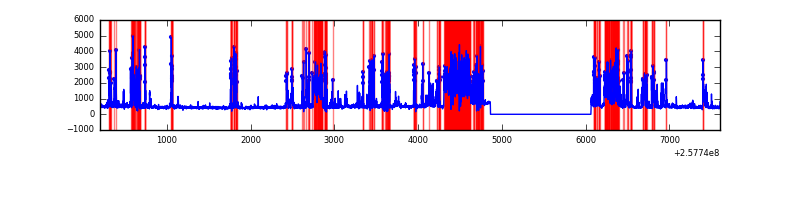 |
| C | 7403 | 6203 | 0 | 0 | 0.00% | 0.00% | 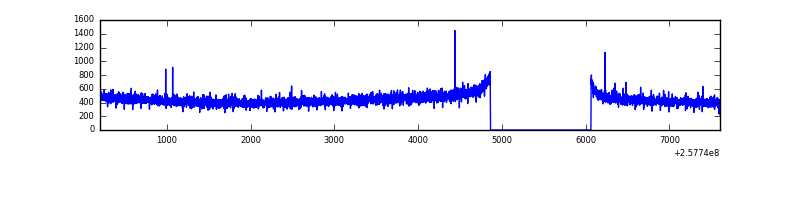 |
| D | 7403 | 6203 | 1395 | 1395 | 18.84% | 22.49% | 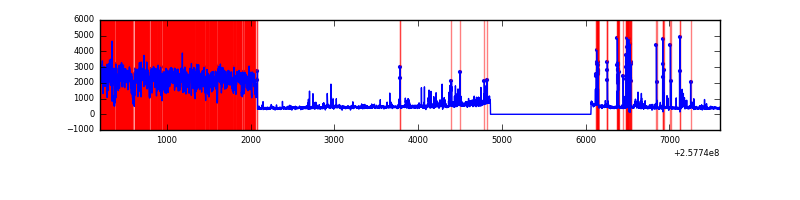 |
Top three noisy pixels from each quadrant. If the there are fewer than three noisy pixels in the level2.evt file, extra rows are filled as -1
| Pixel properties | Quadrant properties | ||||||
|---|---|---|---|---|---|---|---|
| Quadrant | DetID | PixID | Counts | Sigma | Mean | Median | Sigma |
| A | 12 | 189 | 147132 | 1017.92 | 718 | 704 | 143.8 |
| A | 14 | 254 | 50620 | 347.0 | 718 | 704 | 143.8 |
| A | 15 | 223 | 29201 | 198.1 | 718 | 704 | 143.8 |
| B | 0 | 85 | 1186072 | 9705.21 | 660 | 645 | 122.1 |
| B | 4 | 239 | 1071322 | 8765.74 | 660 | 645 | 122.1 |
| B | 3 | 64 | 262100 | 2140.56 | 660 | 645 | 122.1 |
| C | 13 | 61 | 5069 | 27.43 | 697 | 700 | 159.3 |
| C | 14 | 234 | 4632 | 24.69 | 697 | 700 | 159.3 |
| C | 12 | 4 | 3505 | 17.61 | 697 | 700 | 159.3 |
| D | 13 | 122 | 3401559 | 22269.95 | 653 | 636 | 152.7 |
| D | 1 | 52 | 599704 | 3922.82 | 653 | 636 | 152.7 |
| D | 2 | 234 | 19060 | 120.64 | 653 | 636 | 152.7 |
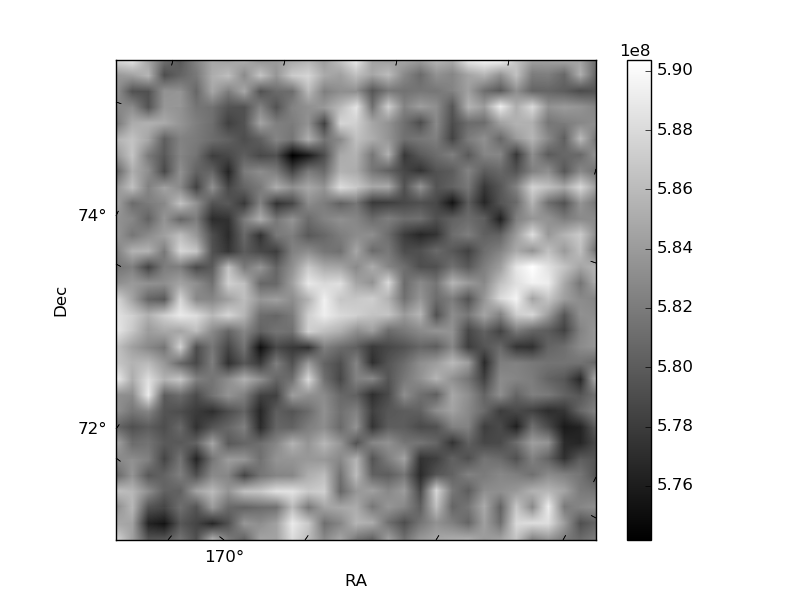
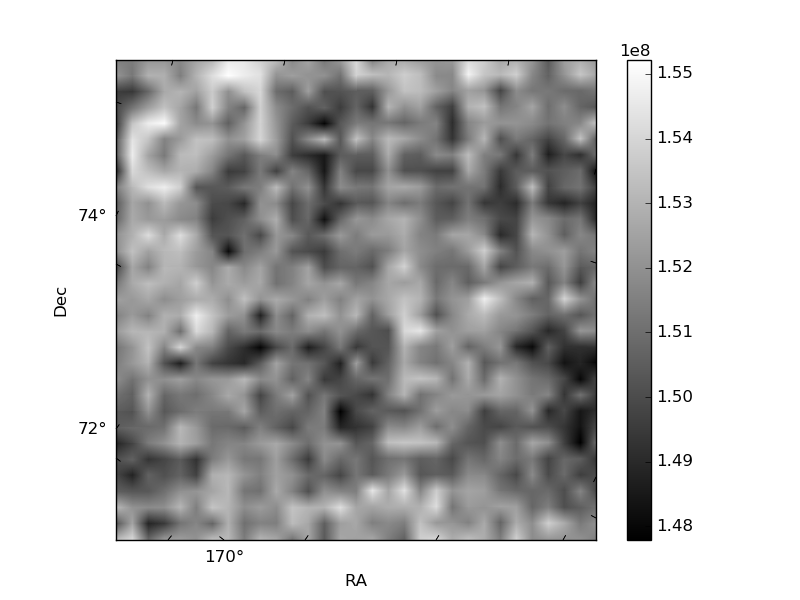
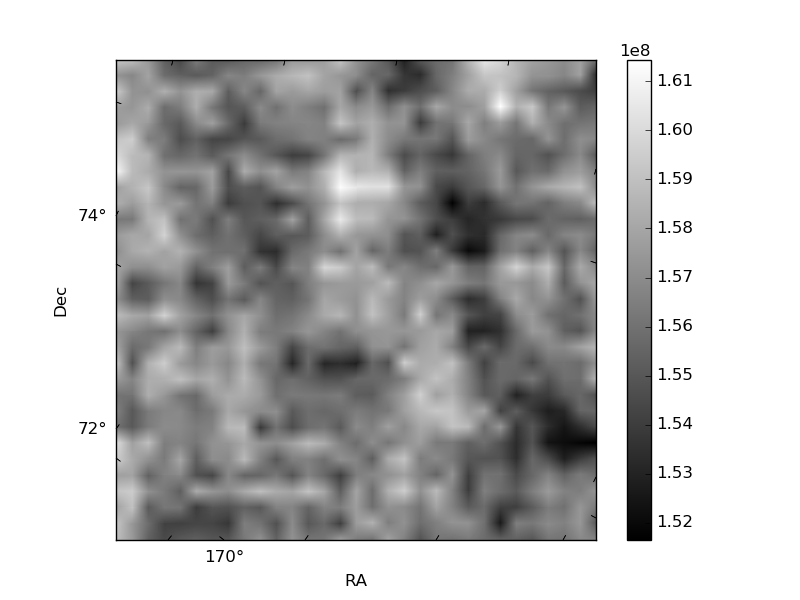
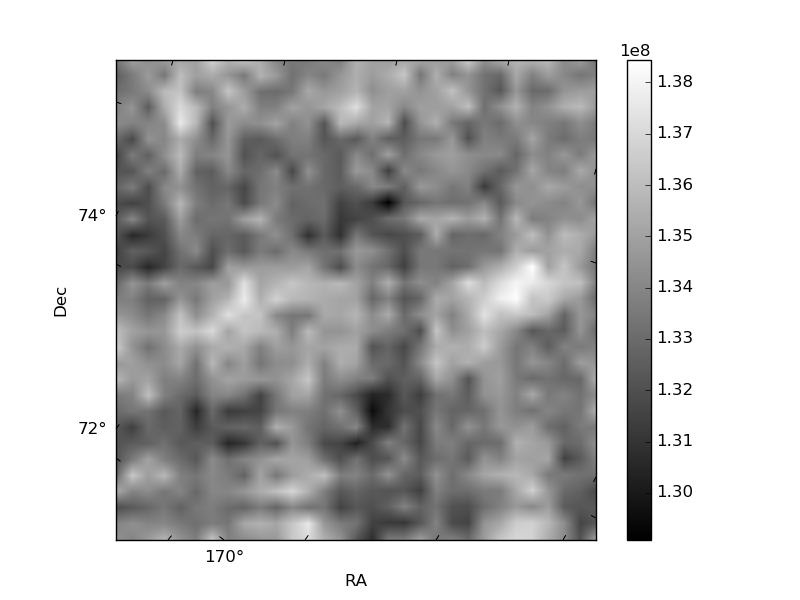
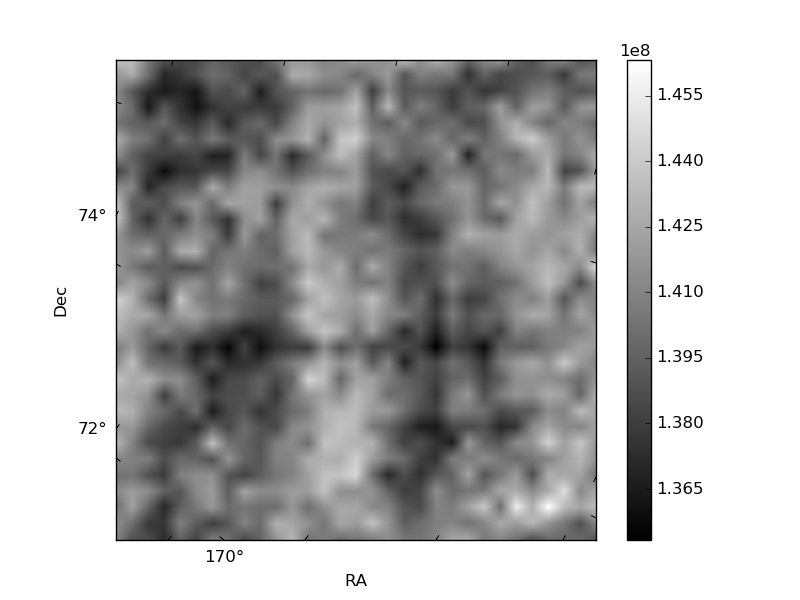
Histogram calculated using DETX and DETY for each event in the final _common_clean file
| Quadrant A | 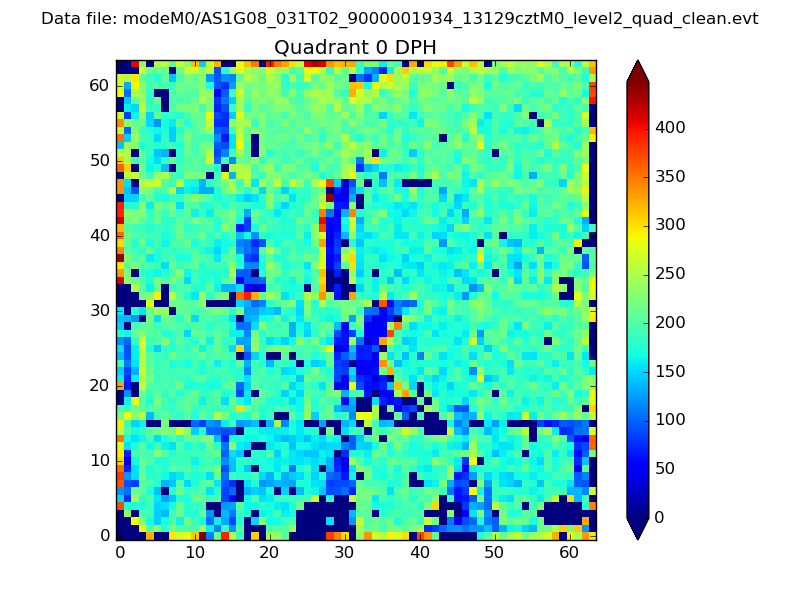 |
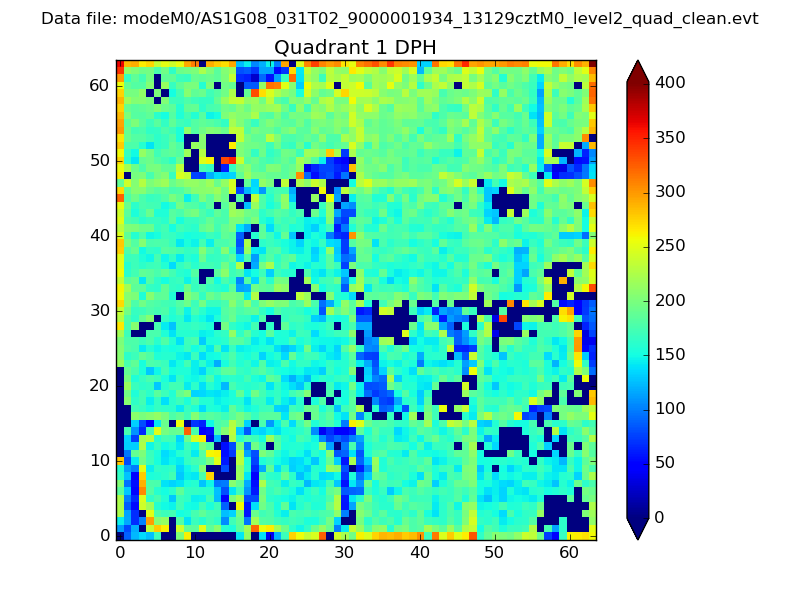 |
Quadrant B |
|---|---|---|---|
| Quadrant D | 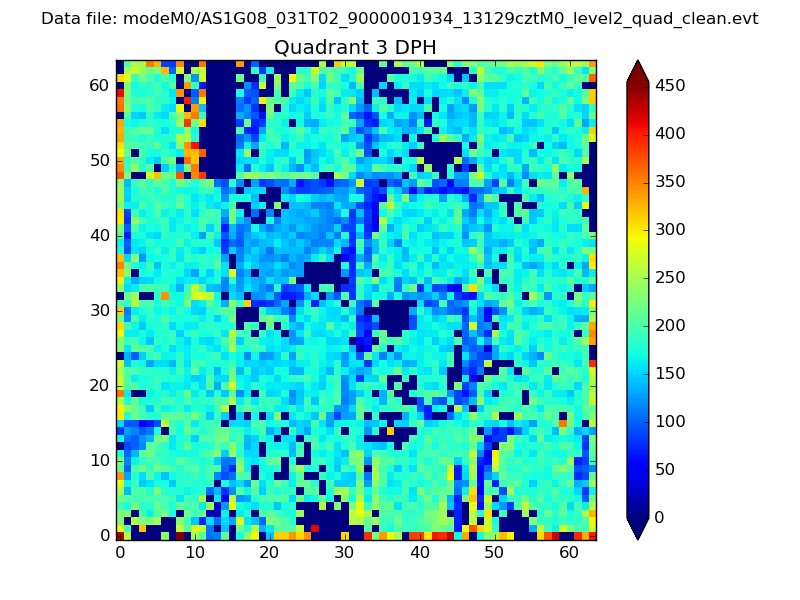 |
 |
Quadrant C |
| Plot type | Count rate plots | Images |
|---|---|---|
| Comparison with Poisson distribution Blue bars denote a histogram of data divided into 1 sec bins. Red curve is a Poisson curve with rate = median count rate of data. |
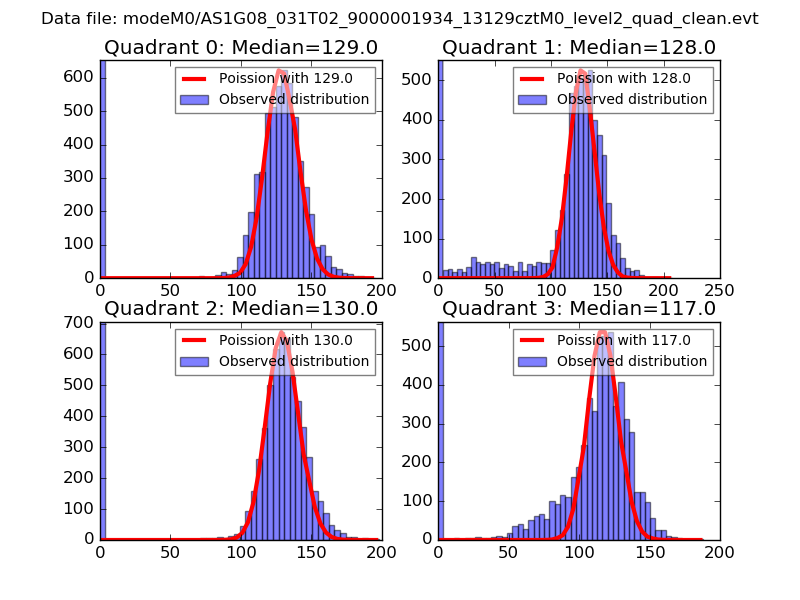 |
 |
| Quadrant-wise count rates Data is divided into 100 sec bins |
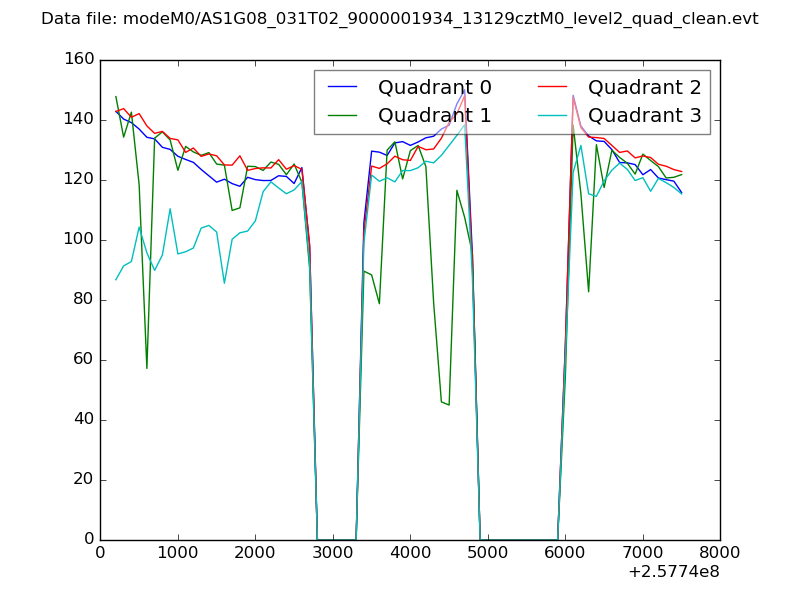 |
|
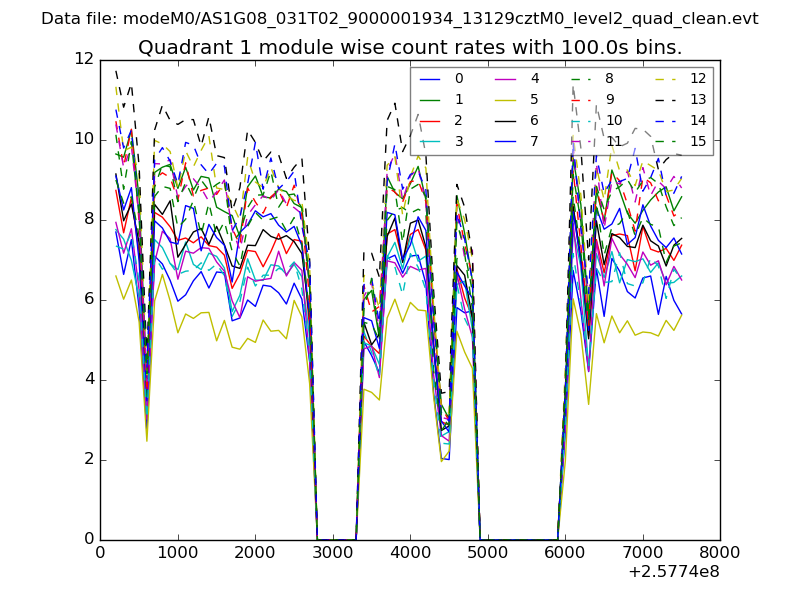
| Module-wise count rates for Quadrant A Data is divided into 100 sec bins |
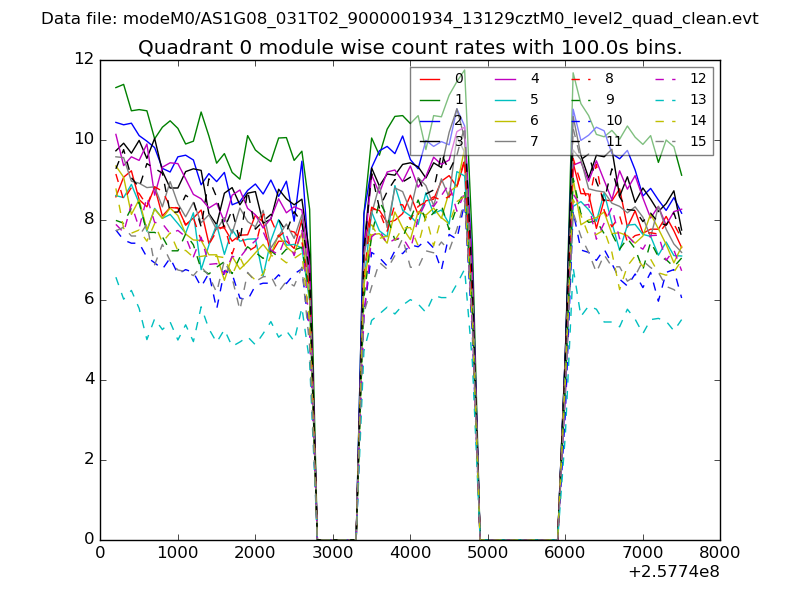 |
 |
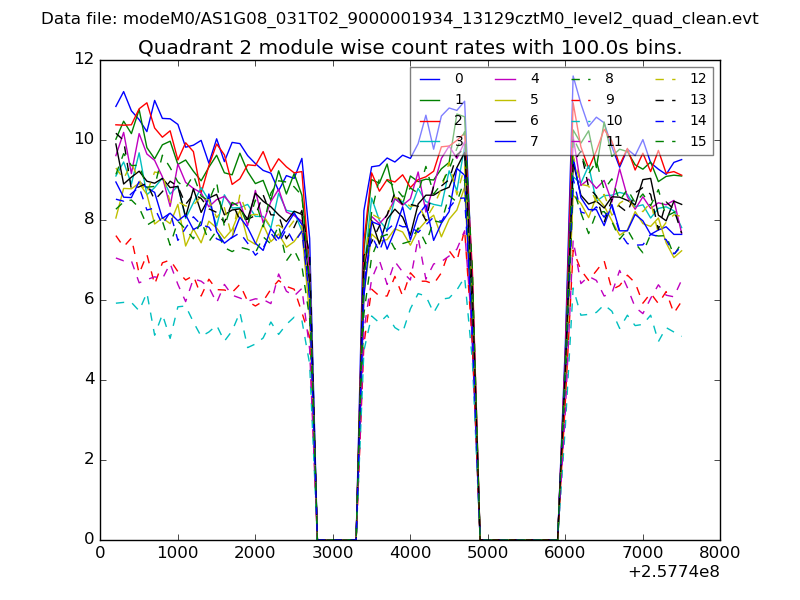
| Module-wise count rates for Quadrant B Data is divided into 100 sec bins |
 |
 |
| Module-wise count rates for Quadrant C Data is divided into 100 sec bins |
 |
 |
| Module-wise count rates for Quadrant D Data is divided into 100 sec bins |
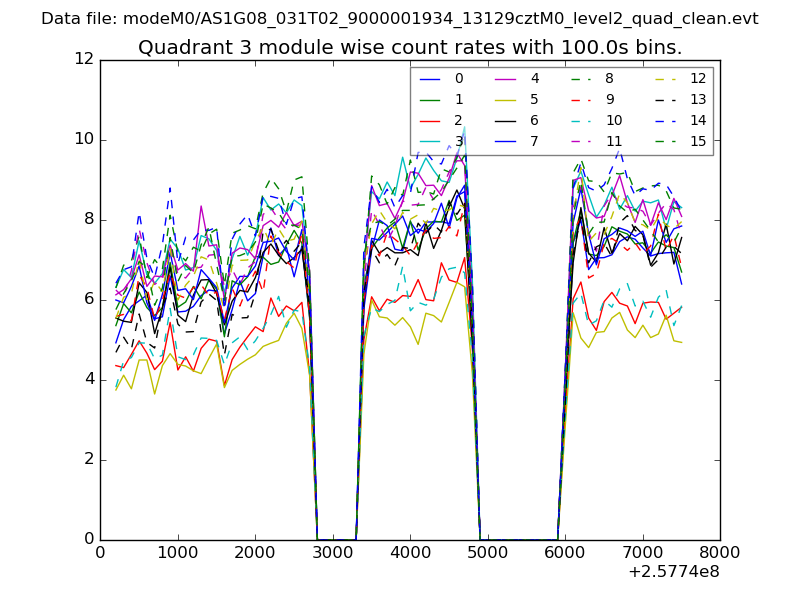 |
 |
| Parameter | Plot |
|---|---|
| CZT HV Monitor | 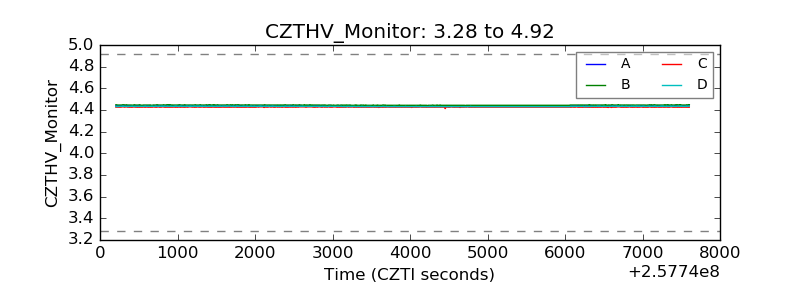 |
| D_VDD | 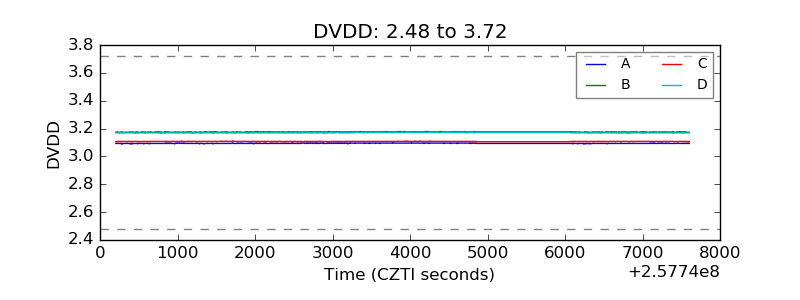 |
| Temperature 1 | 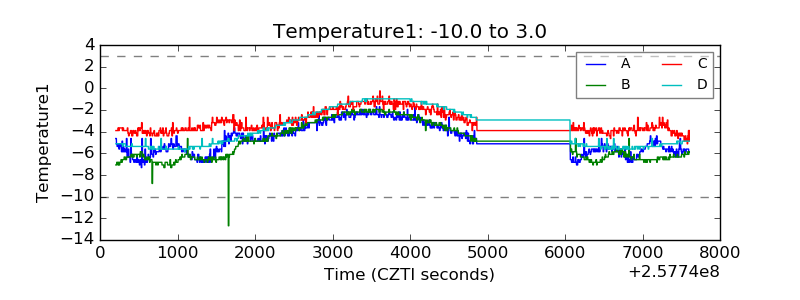 |
| Veto HV Monitor |  |
| Veto LLD | 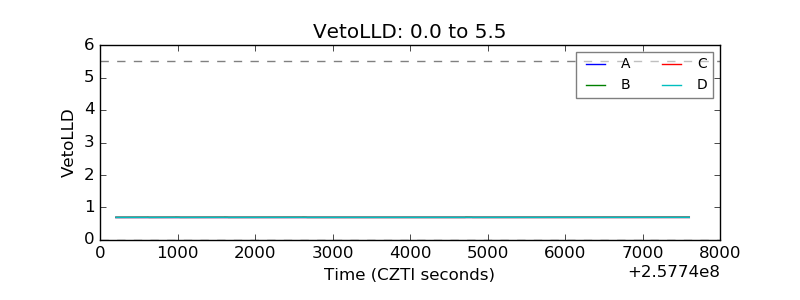 |
| Alpha Counter | 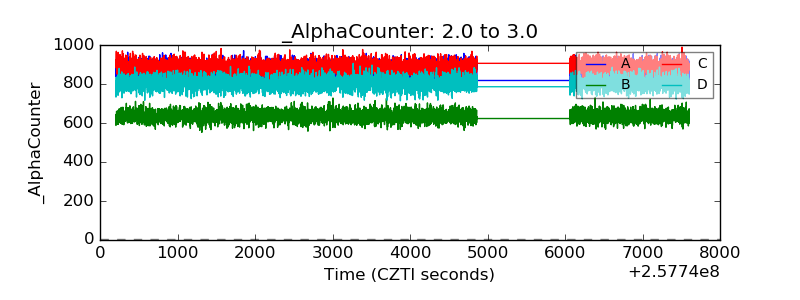 |
| _CPM_Rate | 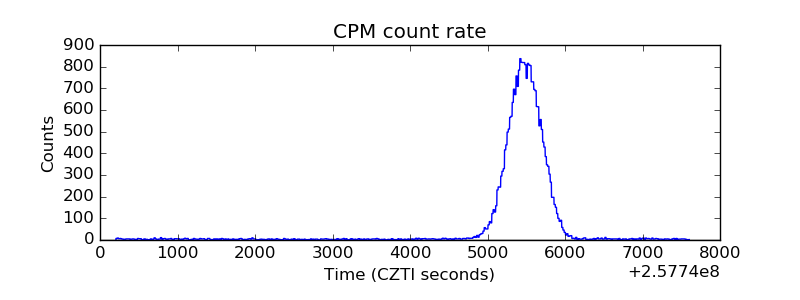 |
| CZT Counter | 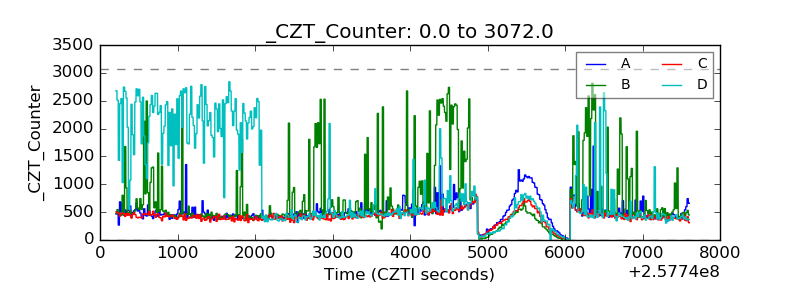 |
| +2.5 Volts monitor |  |
| +5 Volts monitor |  |
| _ROLL_ROT | 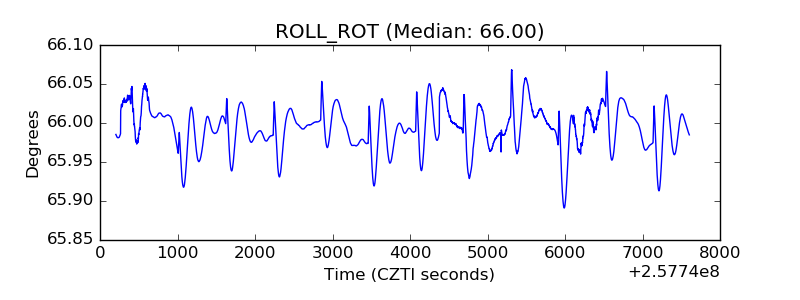 |
| _Roll_DEC | 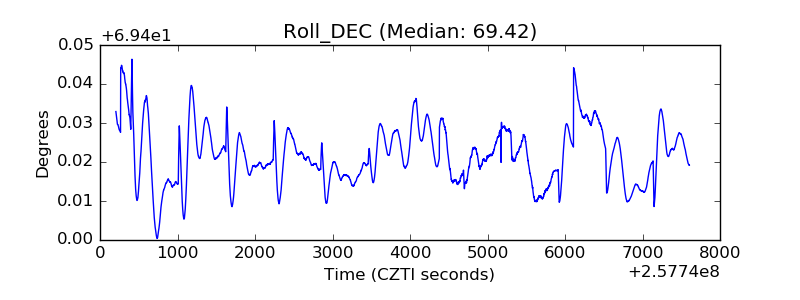 |
| _Roll_RA | 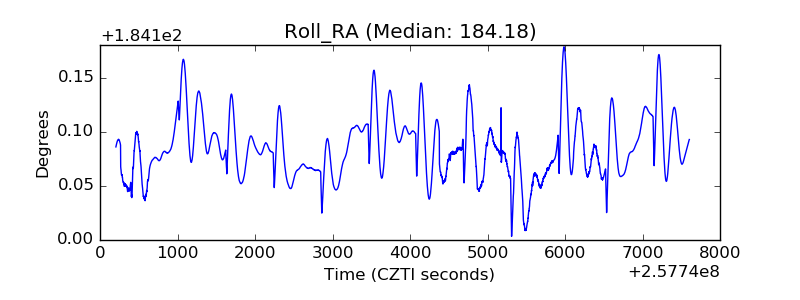 |
| Veto Counter | 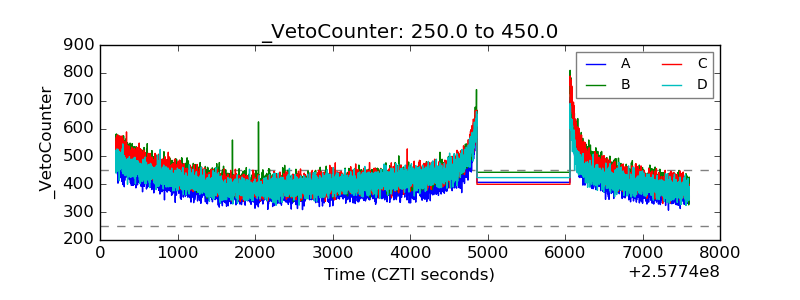 |