| Param | Original file | Final file |
|---|---|---|
| Filename | modeM0/AS1G08_031T02_9000001934_13131cztM0_level2.evt | modeM0/AS1G08_031T02_9000001934_13131cztM0_level2_quad_clean.evt |
| Size (bytes) | 539,038,080 | 115,989,120 |
| Size | 514.1 MB | 110.6 MB |
| Events in quadrant A | 3,818,105 | 755,267 |
| Events in quadrant B | 5,229,466 | 739,938 |
| Events in quadrant C | 3,079,705 | 782,871 |
| Events in quadrant D | 3,718,122 | 742,769 |
| Mode M9 | |||
|---|---|---|---|
| Quadrant | BADHDUFLAG | Total packets | Discarded packets |
| A | 0 | 10 | 0 |
| B | 0 | 10 | 0 |
| C | 0 | 10 | 0 |
| D | 0 | 11 | 0 |
| Mode M0 | |||
|---|---|---|---|
| Quadrant | BADHDUFLAG | Total packets | Discarded packets |
| A | 0 | 16077 | 3 |
| B | 0 | 20298 | 2 |
| C | 0 | 14405 | 2 |
| D | 0 | 16280 | 2 |
| Mode SS | |||
|---|---|---|---|
| Quadrant | BADHDUFLAG | Total packets | Discarded packets |
| A | 0 | 144 | 0 |
| B | 0 | 144 | 0 |
| C | 0 | 144 | 0 |
| D | 0 | 144 | 0 |
| Quadrant | Total seconds | Saturated seconds | Saturation percentage |
|---|---|---|---|
| A | 7057 | 284 | 4.024373% |
| B | 7057 | 749 | 10.613575% |
| C | 7057 | 23 | 0.325918% |
| D | 7057 | 220 | 3.117472% |
Noise dominated data is calculated using 1-second bins in cleaned event files. If a bin has >2000 counts, and if more than 50% of those come from <1% of pixels, then it is considered to be noise-dominated and hence unusable.
| Quadrant | # 1 sec bins | Bins with >0 counts | Bins with >2000 counts | High rate bins dominated by noise | Noise dominated (total time) | Noise dominated (detector-on time) | Marked lightcurve |
|---|---|---|---|---|---|---|---|
| A | 7678 | 7059 | 193 | 193 | 2.51% | 2.73% | 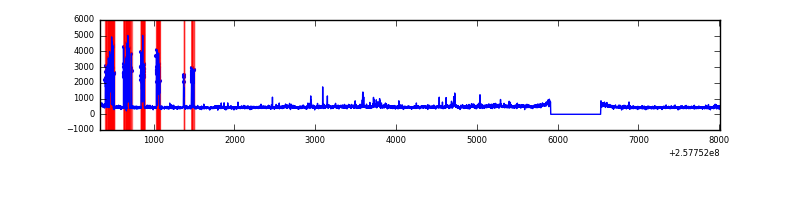 |
| B | 7678 | 7059 | 369 | 369 | 4.81% | 5.23% | 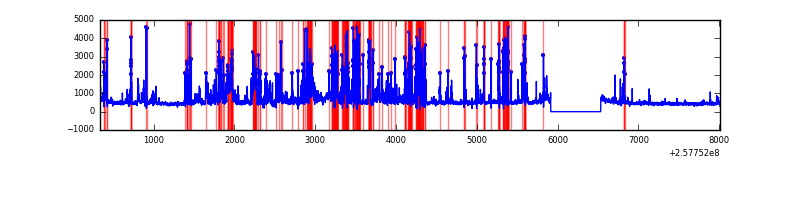 |
| C | 7678 | 7059 | 1 | 1 | 0.01% | 0.01% | 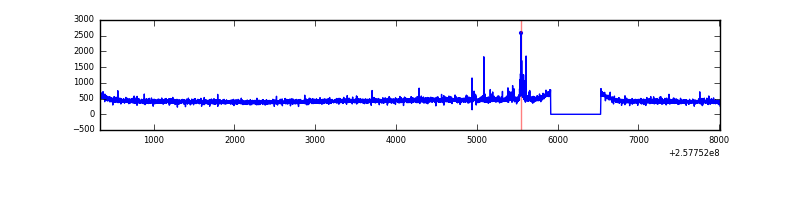 |
| D | 7678 | 7059 | 142 | 142 | 1.85% | 2.01% | 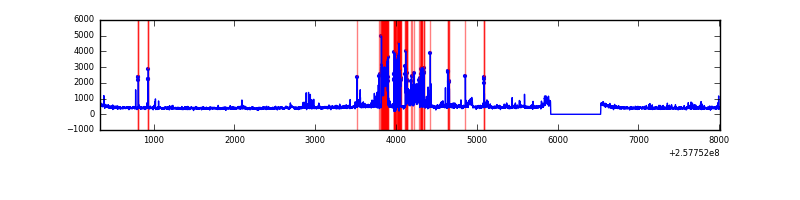 |
Top three noisy pixels from each quadrant. If the there are fewer than three noisy pixels in the level2.evt file, extra rows are filled as -1
| Pixel properties | Quadrant properties | ||||||
|---|---|---|---|---|---|---|---|
| Quadrant | DetID | PixID | Counts | Sigma | Mean | Median | Sigma |
| A | 0 | 23 | 528099 | 3305.16 | 786 | 768 | 159.5 |
| A | 12 | 189 | 162547 | 1013.99 | 786 | 768 | 159.5 |
| A | 0 | 226 | 38562 | 236.88 | 786 | 768 | 159.5 |
| B | 4 | 239 | 1144874 | 7923.95 | 765 | 748 | 144.4 |
| B | 0 | 85 | 724182 | 5010.34 | 765 | 748 | 144.4 |
| B | 3 | 64 | 228794 | 1579.39 | 765 | 748 | 144.4 |
| C | 15 | 208 | 49887 | 275.12 | 776 | 779 | 178.5 |
| C | 13 | 61 | 5706 | 27.6 | 776 | 779 | 178.5 |
| C | 14 | 234 | 2502 | 9.65 | 776 | 779 | 178.5 |
| D | 1 | 52 | 718676 | 3925.73 | 764 | 740 | 182.9 |
| D | 10 | 157 | 43408 | 233.31 | 764 | 740 | 182.9 |
| D | 2 | 69 | 26654 | 141.7 | 764 | 740 | 182.9 |
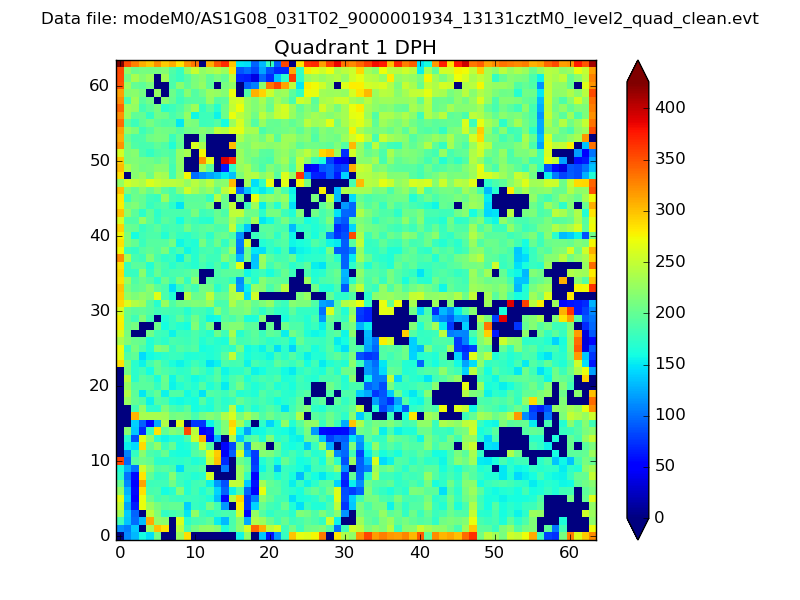
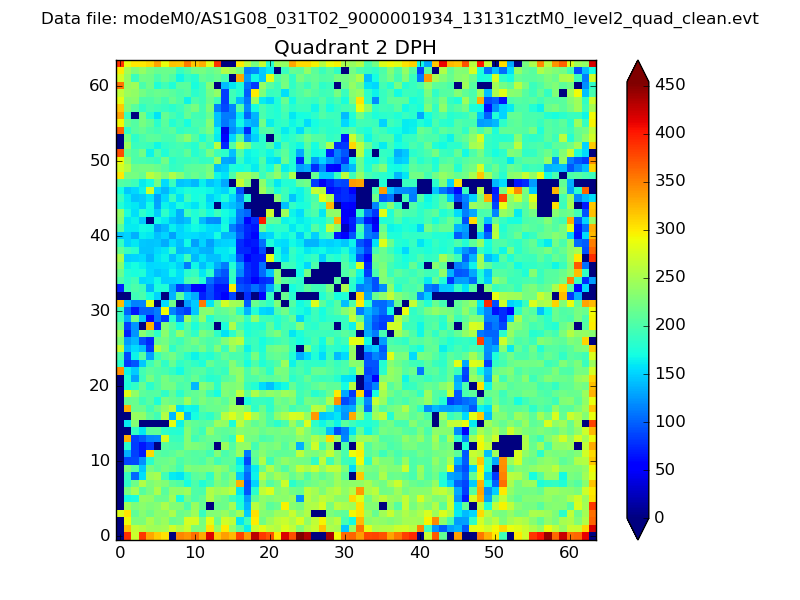
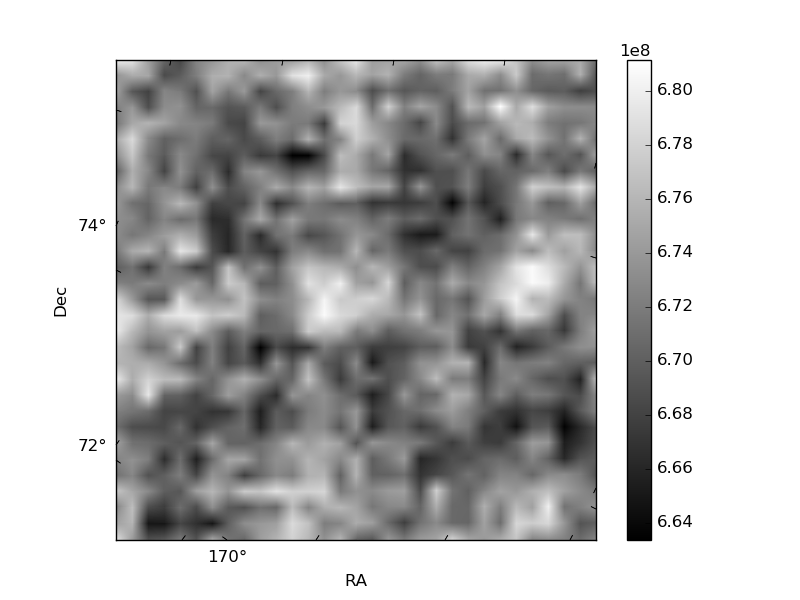
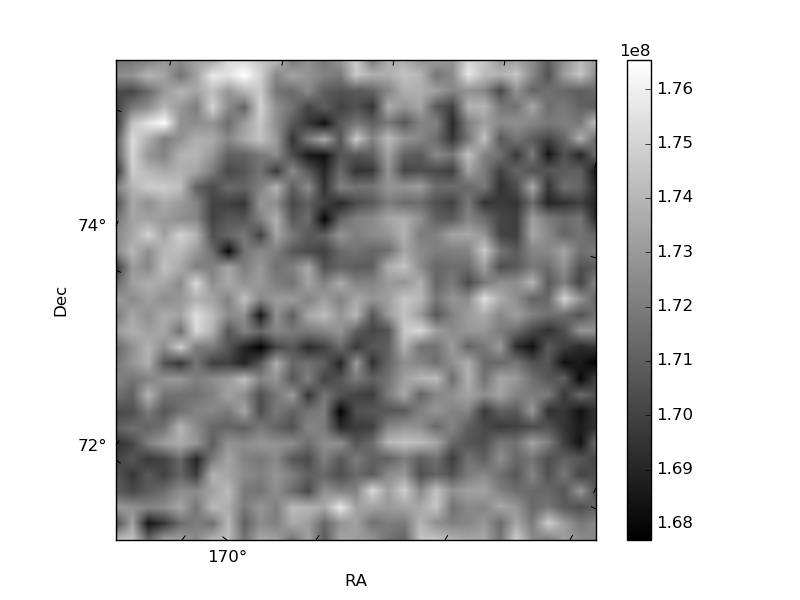
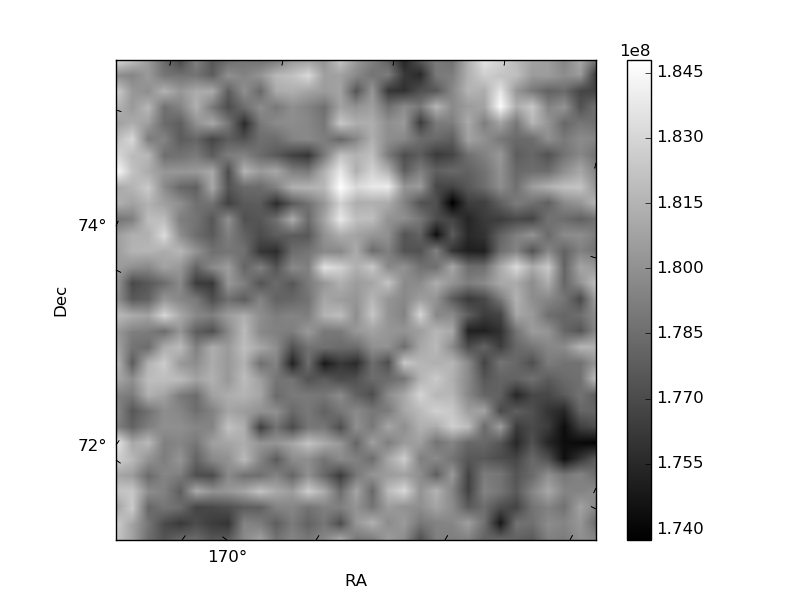
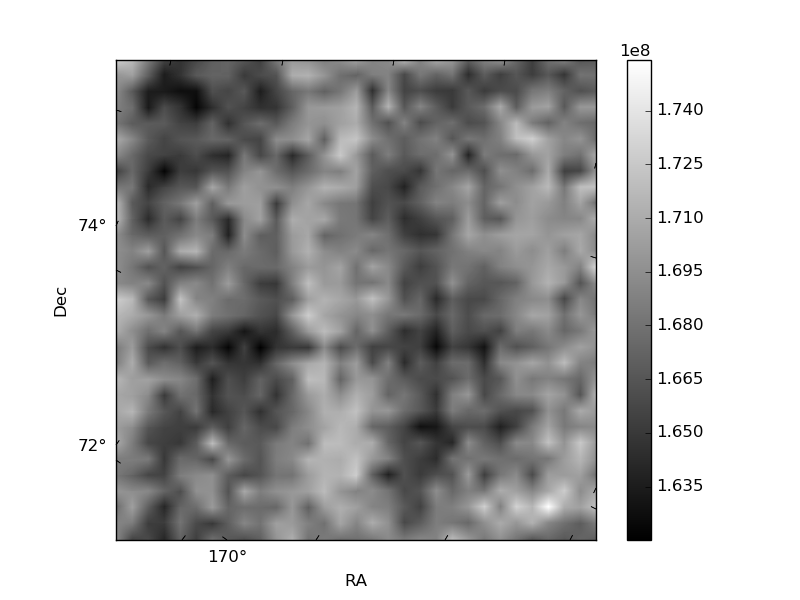
Histogram calculated using DETX and DETY for each event in the final _common_clean file
| Quadrant A |  |
 |
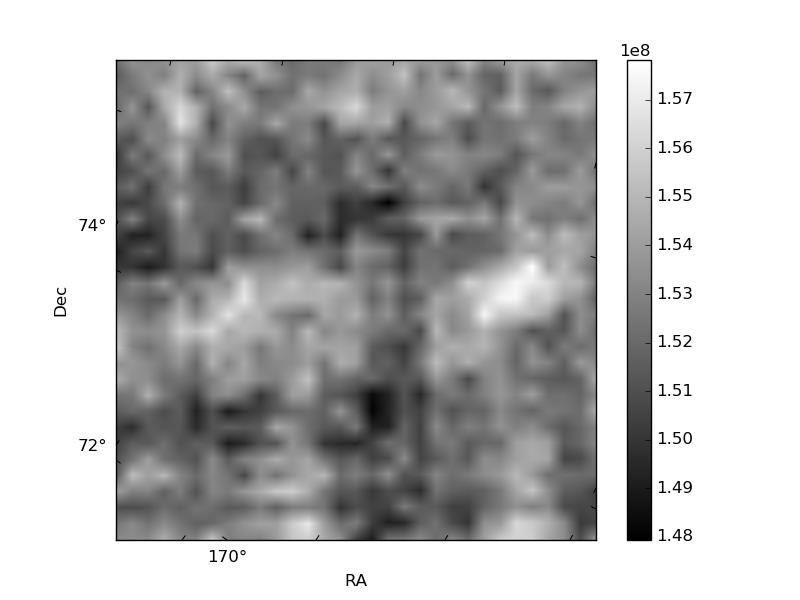
Quadrant B |
|---|---|---|---|
| Quadrant D | 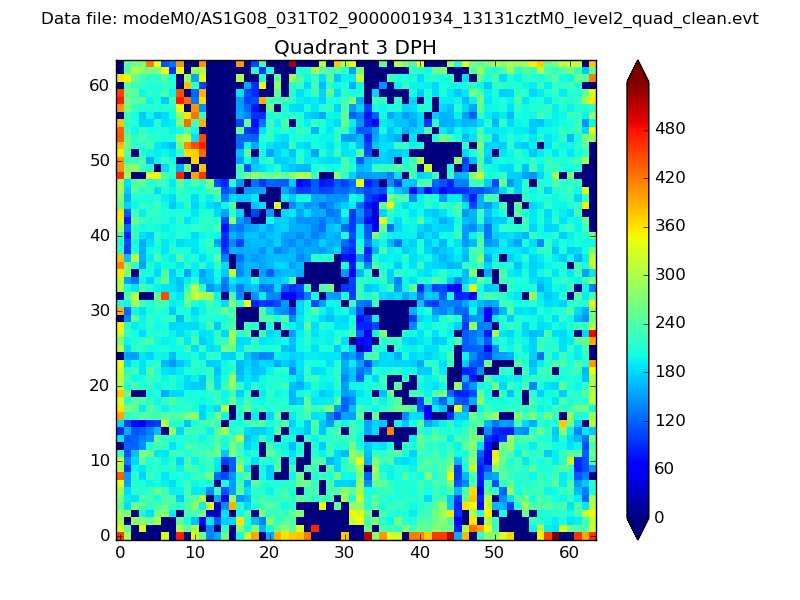 |
 |
Quadrant C |
| Plot type | Count rate plots | Images |
|---|---|---|
| Comparison with Poisson distribution Blue bars denote a histogram of data divided into 1 sec bins. Red curve is a Poisson curve with rate = median count rate of data. |
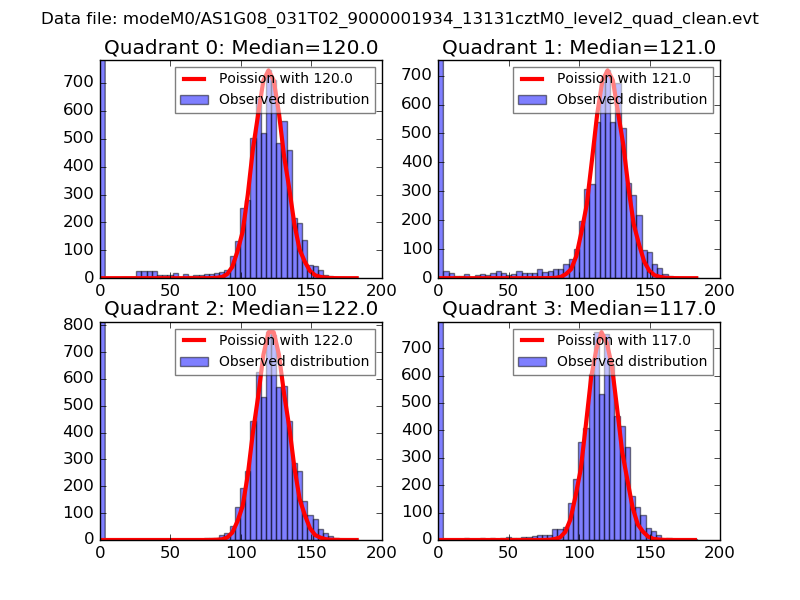 |
 |
| Quadrant-wise count rates Data is divided into 100 sec bins |
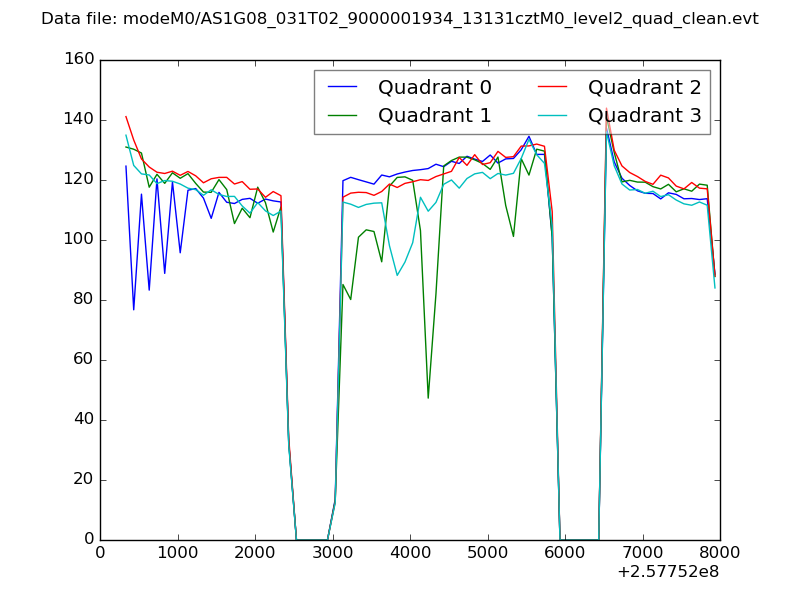 |
|
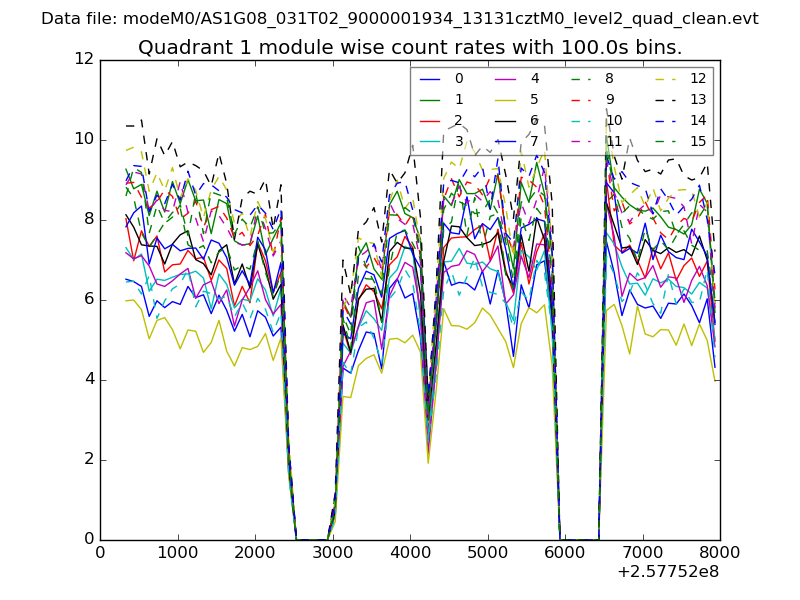
| Module-wise count rates for Quadrant A Data is divided into 100 sec bins |
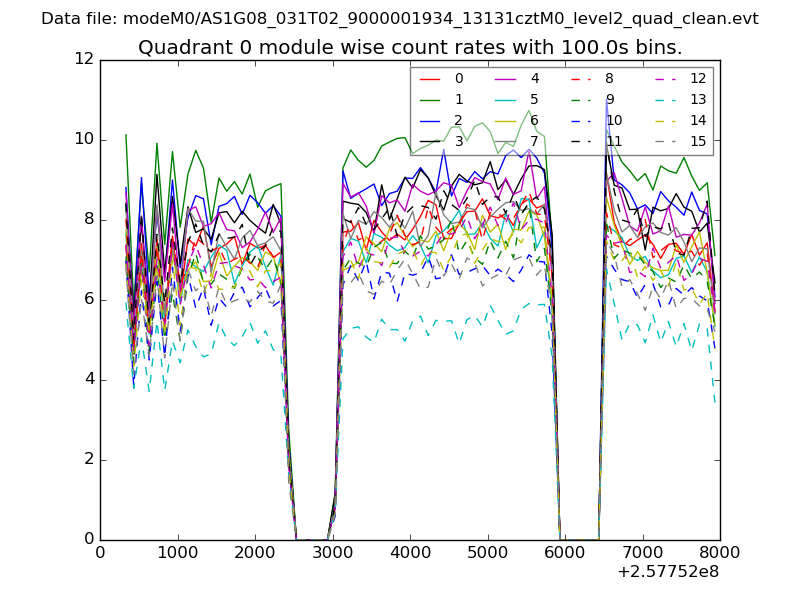 |
 |
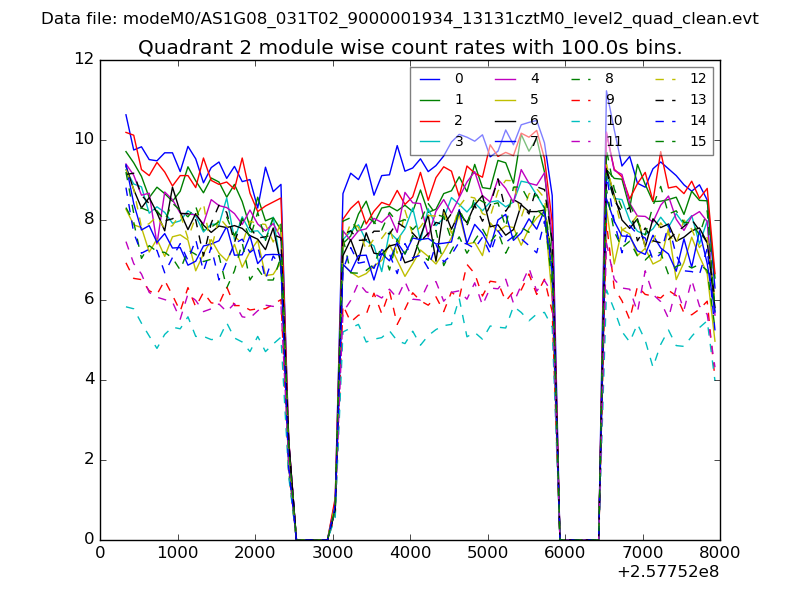
| Module-wise count rates for Quadrant B Data is divided into 100 sec bins |
 |
 |
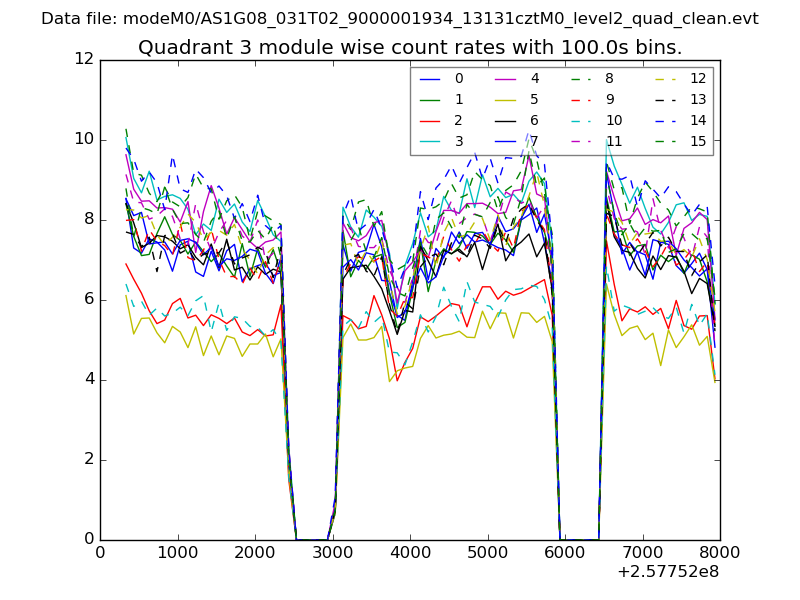
| Module-wise count rates for Quadrant C Data is divided into 100 sec bins |
 |
 |
| Module-wise count rates for Quadrant D Data is divided into 100 sec bins |
 |
 |
| Parameter | Plot |
|---|---|
| CZT HV Monitor | 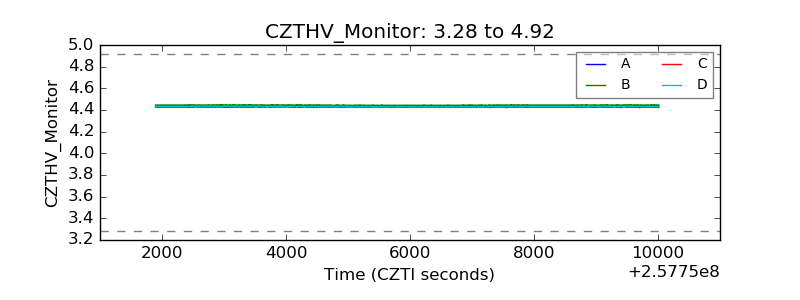 |
| D_VDD | 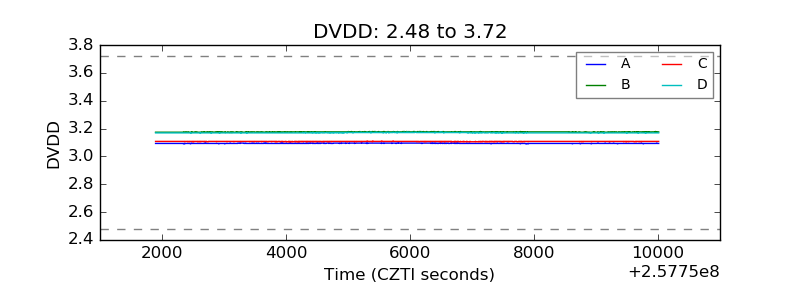 |
| Temperature 1 | 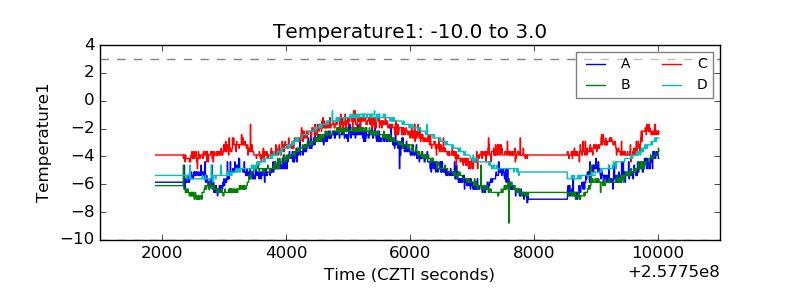 |
| Veto HV Monitor | 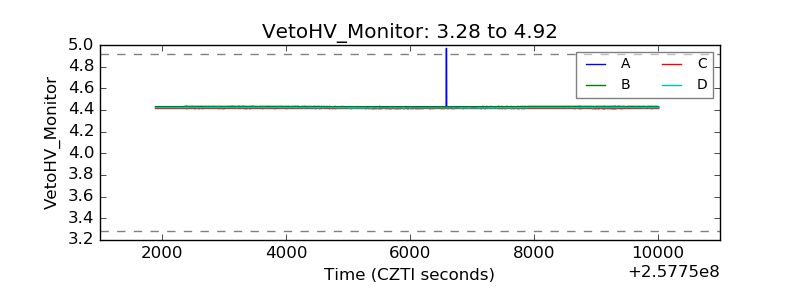 |
| Veto LLD | 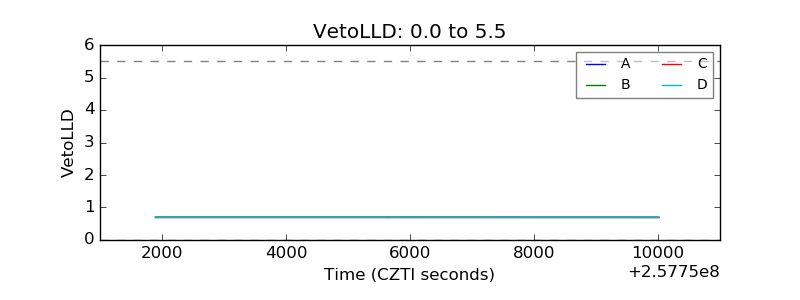 |
| Alpha Counter | 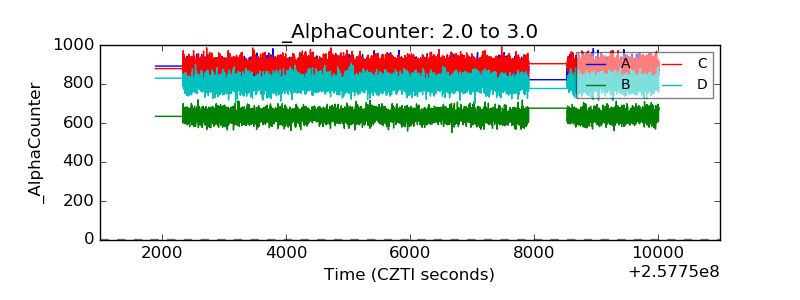 |
| _CPM_Rate | 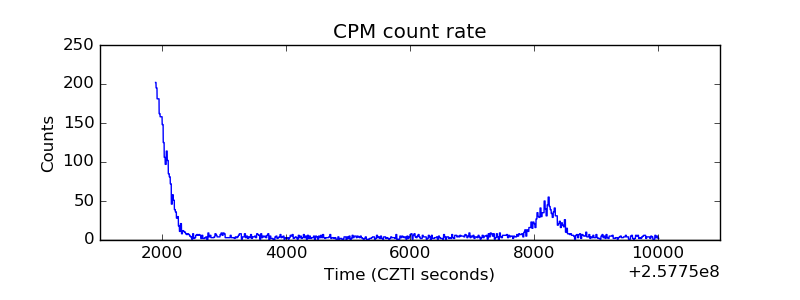 |
| CZT Counter | 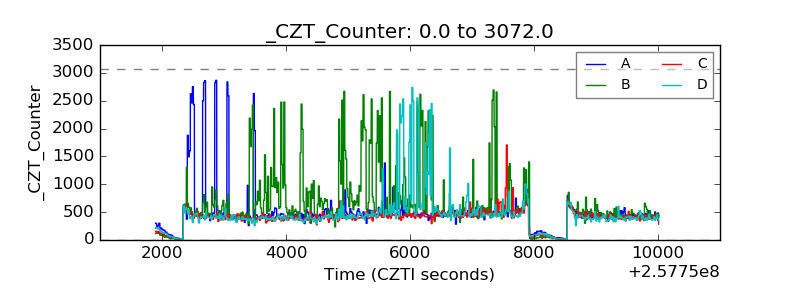 |
| +2.5 Volts monitor |  |
| +5 Volts monitor | 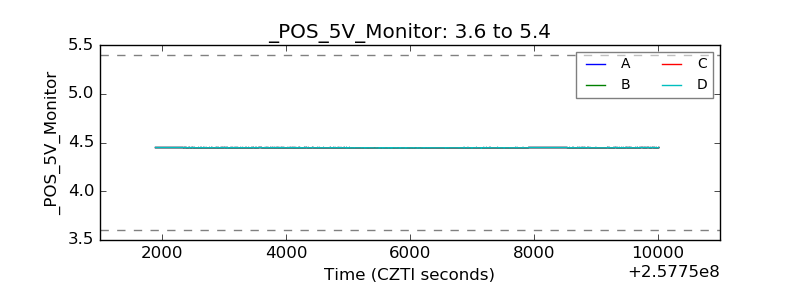 |
| _ROLL_ROT | 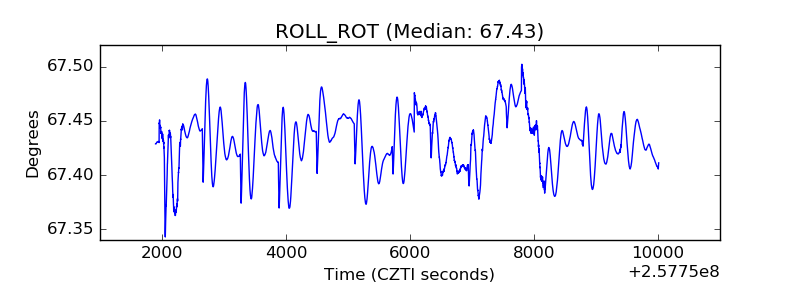 |
| _Roll_DEC | 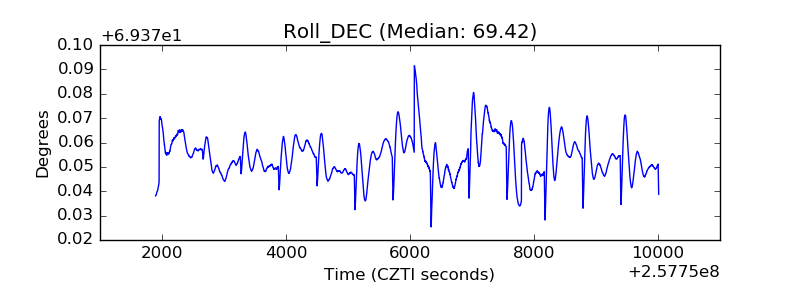 |
| _Roll_RA | 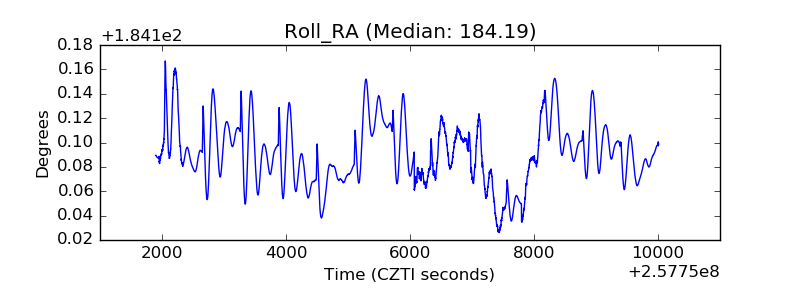 |
| Veto Counter | 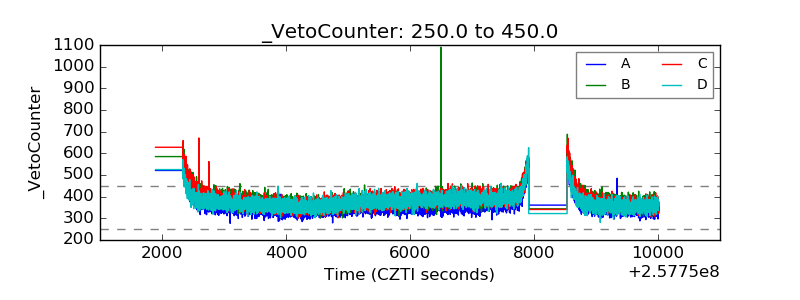 |