| Param | Original file | Final file |
|---|---|---|
| Filename | modeM0/AS1G08_031T02_9000001934_13132cztM0_level2.evt | modeM0/AS1G08_031T02_9000001934_13132cztM0_level2_quad_clean.evt |
| Size (bytes) | 324,446,400 | 73,226,880 |
| Size | 309.4 MB | 69.8 MB |
| Events in quadrant A | 2,197,562 | 479,815 |
| Events in quadrant B | 3,172,219 | 465,368 |
| Events in quadrant C | 1,986,602 | 478,773 |
| Events in quadrant D | 2,148,507 | 463,206 |
| Mode M0 | |||
|---|---|---|---|
| Quadrant | BADHDUFLAG | Total packets | Discarded packets |
| A | 0 | 9654 | 0 |
| B | 0 | 12568 | 0 |
| C | 0 | 9415 | 0 |
| D | 0 | 9851 | 0 |
| Mode SS | |||
|---|---|---|---|
| Quadrant | BADHDUFLAG | Total packets | Discarded packets |
| A | 0 | 94 | 0 |
| B | 0 | 94 | 0 |
| C | 0 | 94 | 0 |
| D | 0 | 94 | 0 |
| Quadrant | Total seconds | Saturated seconds | Saturation percentage |
|---|---|---|---|
| A | 4702 | 17 | 0.361548% |
| B | 4702 | 363 | 7.720119% |
| C | 4702 | 1 | 0.021268% |
| D | 4702 | 21 | 0.446618% |
Noise dominated data is calculated using 1-second bins in cleaned event files. If a bin has >2000 counts, and if more than 50% of those come from <1% of pixels, then it is considered to be noise-dominated and hence unusable.
| Quadrant | # 1 sec bins | Bins with >0 counts | Bins with >2000 counts | High rate bins dominated by noise | Noise dominated (total time) | Noise dominated (detector-on time) | Marked lightcurve |
|---|---|---|---|---|---|---|---|
| A | 4703 | 4703 | 11 | 11 | 0.23% | 0.23% | 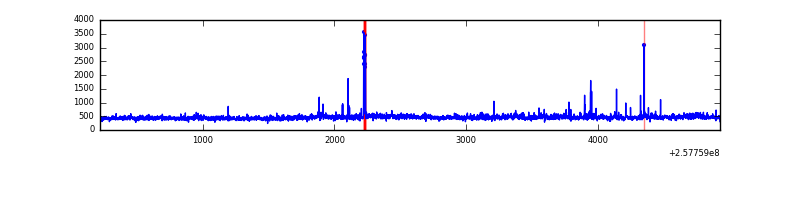 |
| B | 4703 | 4703 | 221 | 221 | 4.70% | 4.70% | 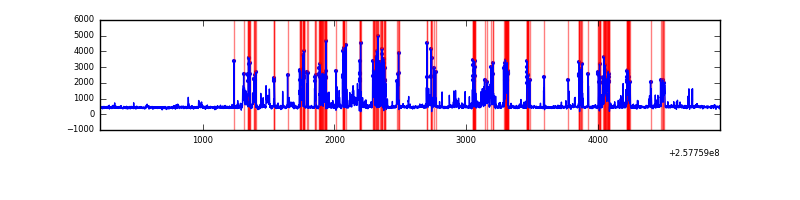 |
| C | 4703 | 4703 | 0 | 0 | 0.00% | 0.00% | 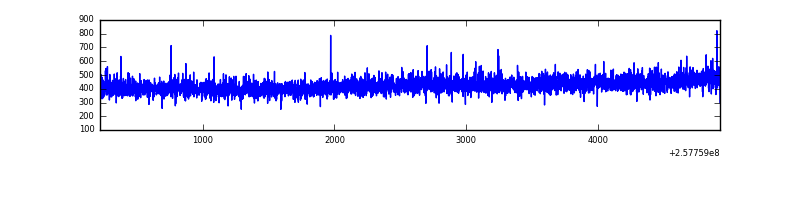 |
| D | 4703 | 4703 | 14 | 14 | 0.30% | 0.30% | 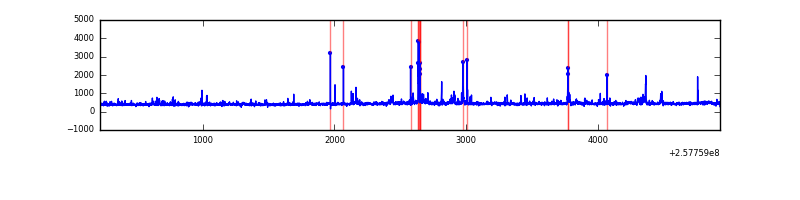 |
Top three noisy pixels from each quadrant. If the there are fewer than three noisy pixels in the level2.evt file, extra rows are filled as -1
| Pixel properties | Quadrant properties | ||||||
|---|---|---|---|---|---|---|---|
| Quadrant | DetID | PixID | Counts | Sigma | Mean | Median | Sigma |
| A | 12 | 189 | 111709 | 1027.27 | 520 | 508 | 108.2 |
| A | 0 | 23 | 34852 | 317.27 | 520 | 508 | 108.2 |
| A | 4 | 2 | 26420 | 239.37 | 520 | 508 | 108.2 |
| B | 4 | 239 | 907168 | 9565.34 | 498 | 486 | 94.8 |
| B | 0 | 85 | 130207 | 1368.53 | 498 | 486 | 94.8 |
| B | 3 | 64 | 102333 | 1074.47 | 498 | 486 | 94.8 |
| C | 13 | 61 | 3822 | 28.09 | 507 | 508 | 118.0 |
| C | 12 | 4 | 3607 | 26.27 | 507 | 508 | 118.0 |
| C | 14 | 234 | 1694 | 10.05 | 507 | 508 | 118.0 |
| D | 1 | 52 | 150070 | 1221.06 | 505 | 490 | 122.5 |
| D | 14 | 34 | 33268 | 267.58 | 505 | 490 | 122.5 |
| D | 2 | 234 | 20025 | 159.47 | 505 | 490 | 122.5 |
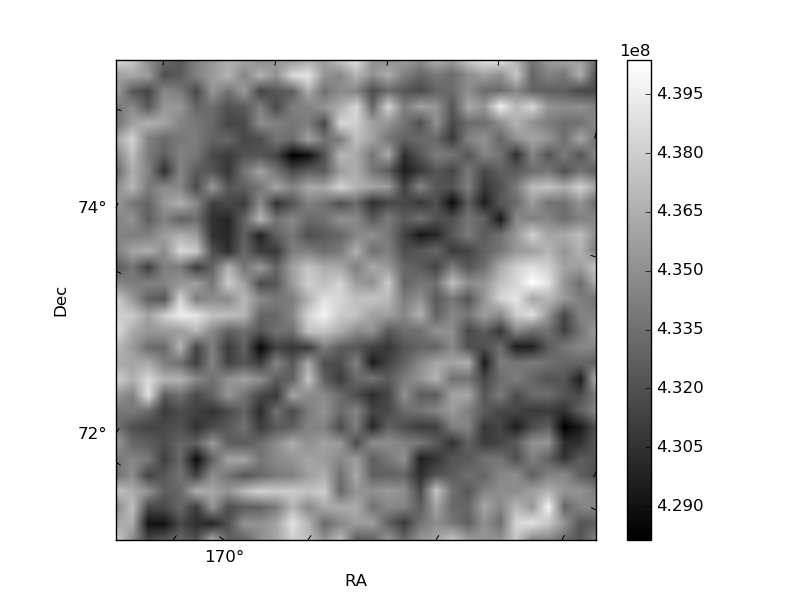
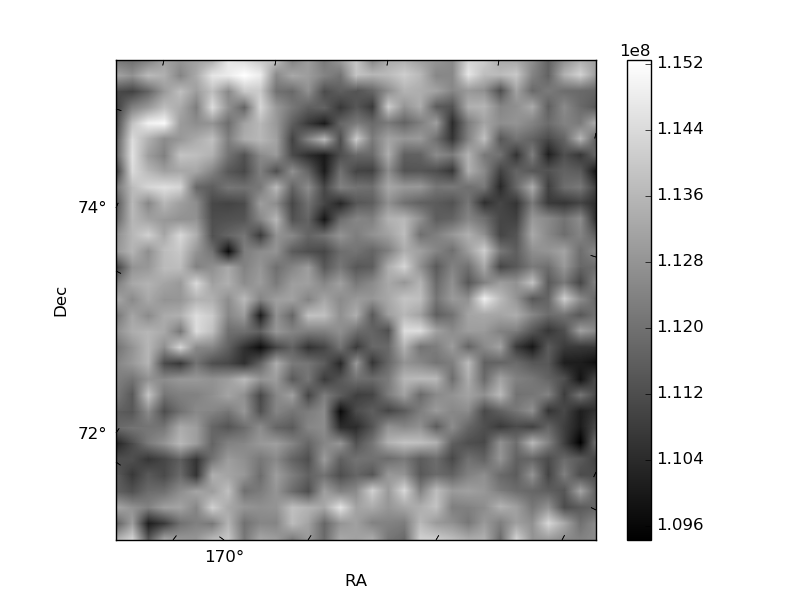
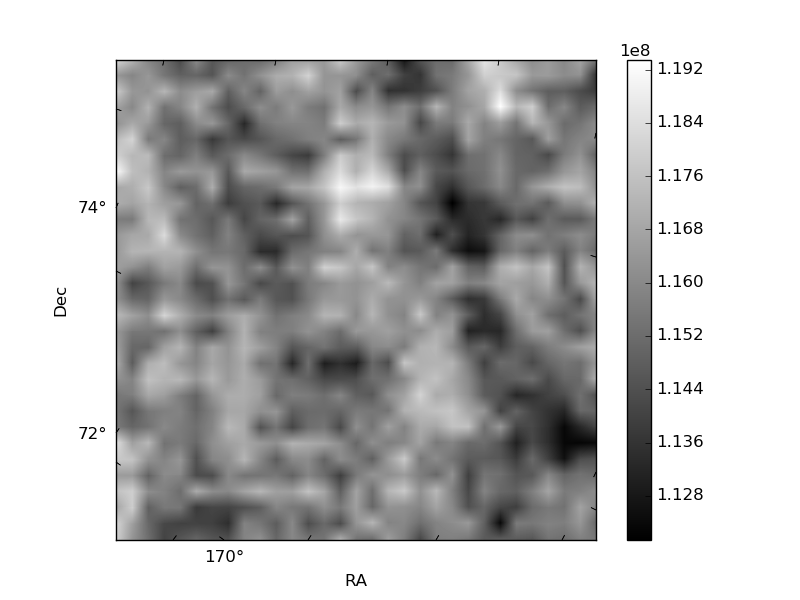
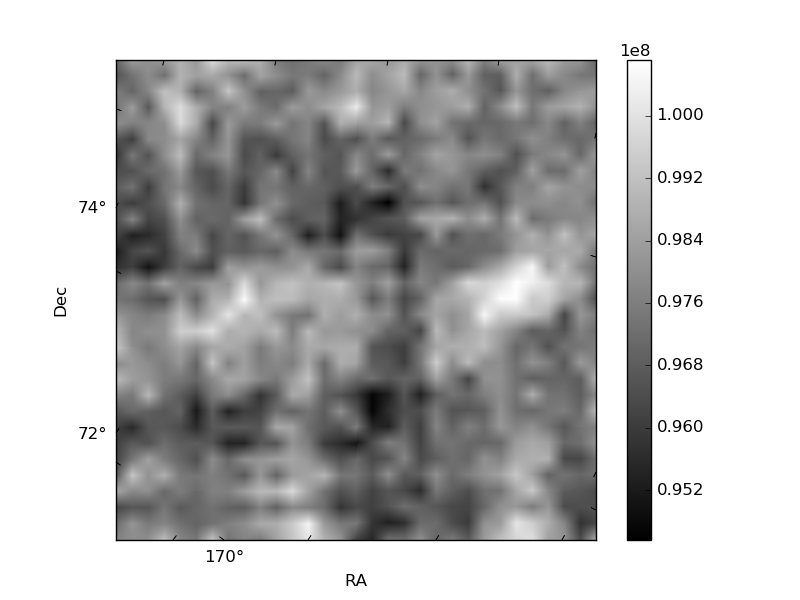
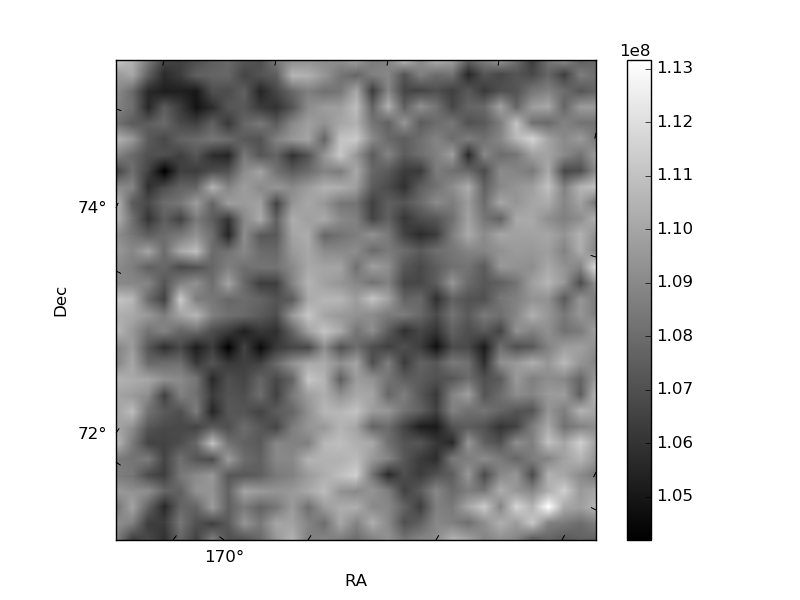
Histogram calculated using DETX and DETY for each event in the final _common_clean file
| Quadrant A | 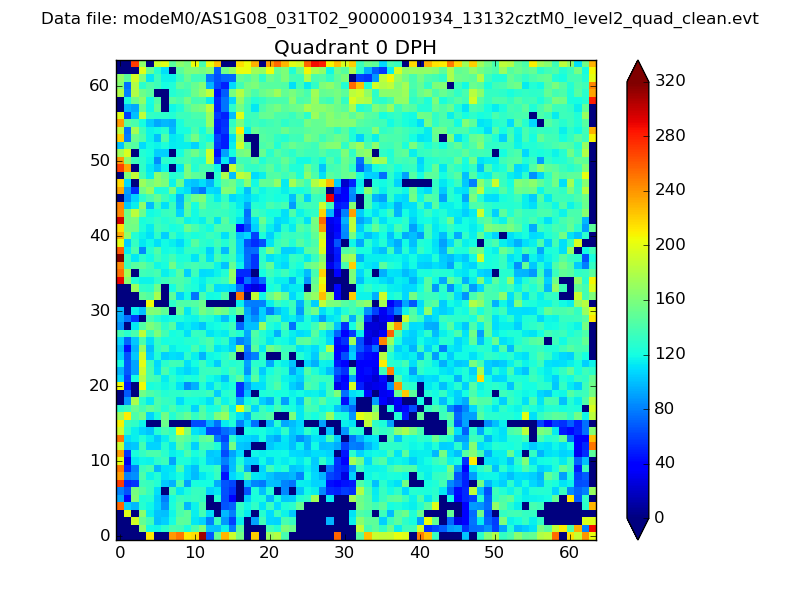 |
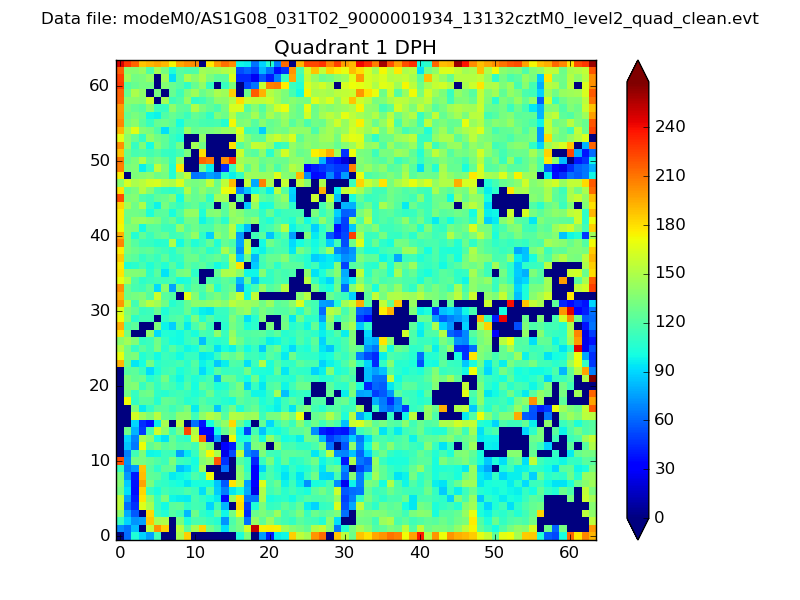 |
Quadrant B |
|---|---|---|---|
| Quadrant D | 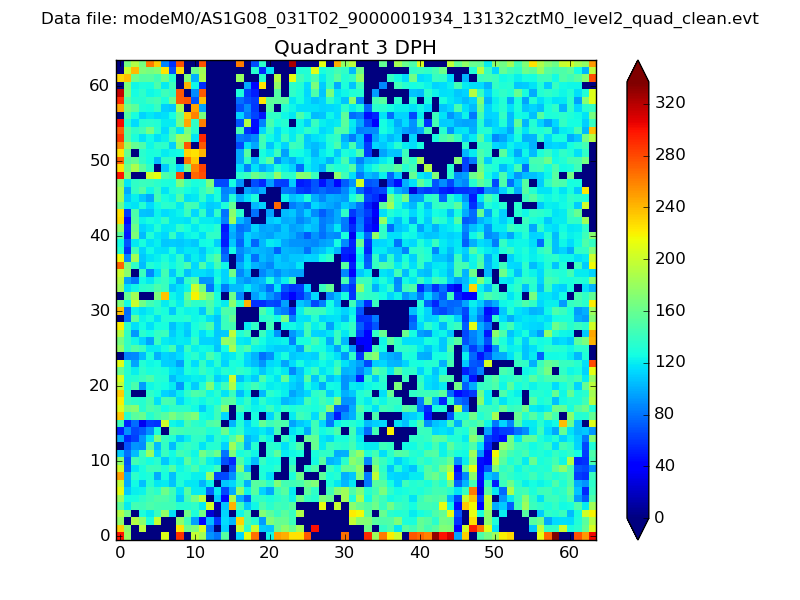 |
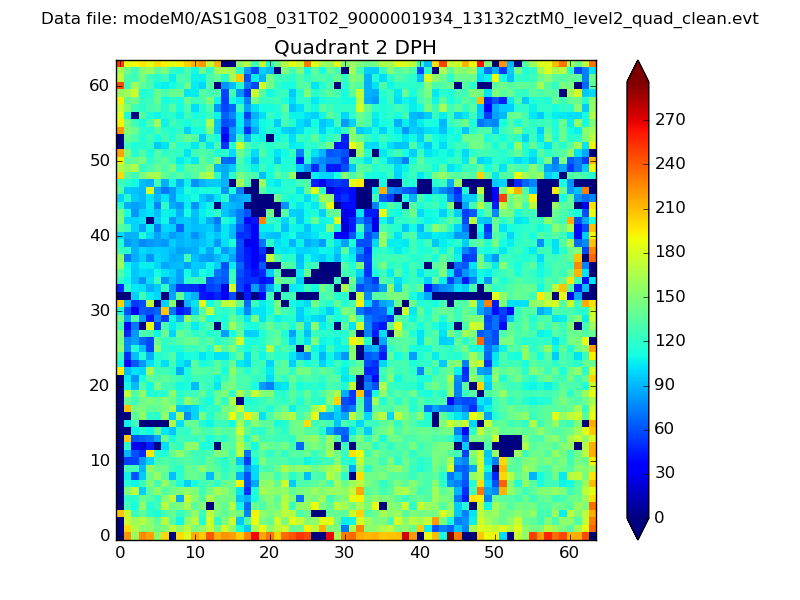 |
Quadrant C |
| Plot type | Count rate plots | Images |
|---|---|---|
| Comparison with Poisson distribution Blue bars denote a histogram of data divided into 1 sec bins. Red curve is a Poisson curve with rate = median count rate of data. |
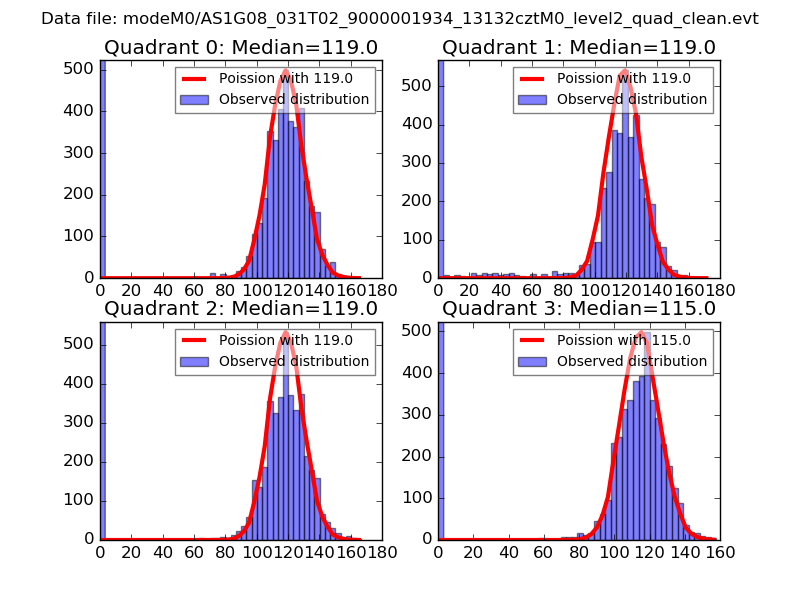 |
 |
| Quadrant-wise count rates Data is divided into 100 sec bins |
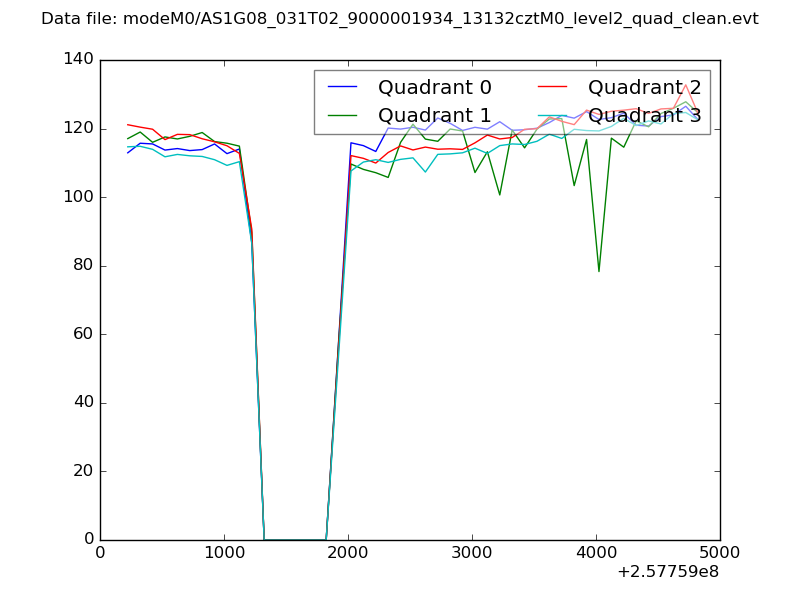 |
|
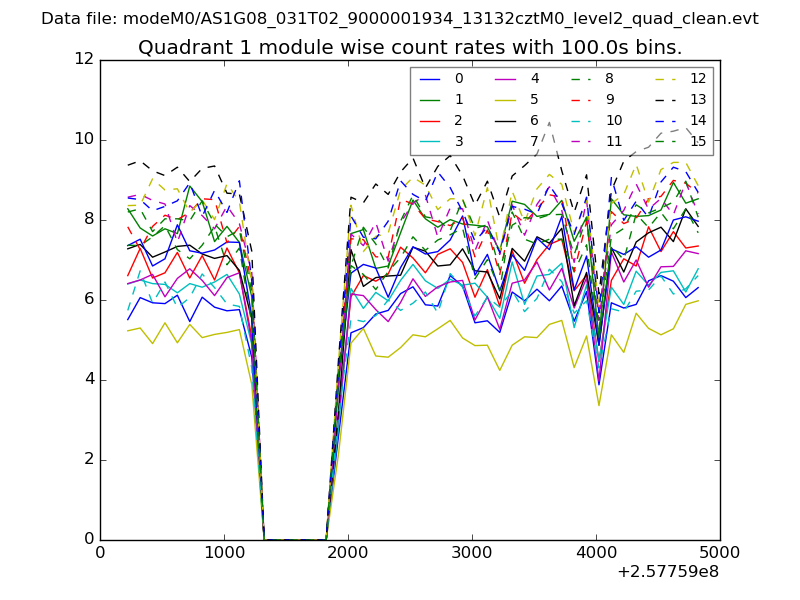
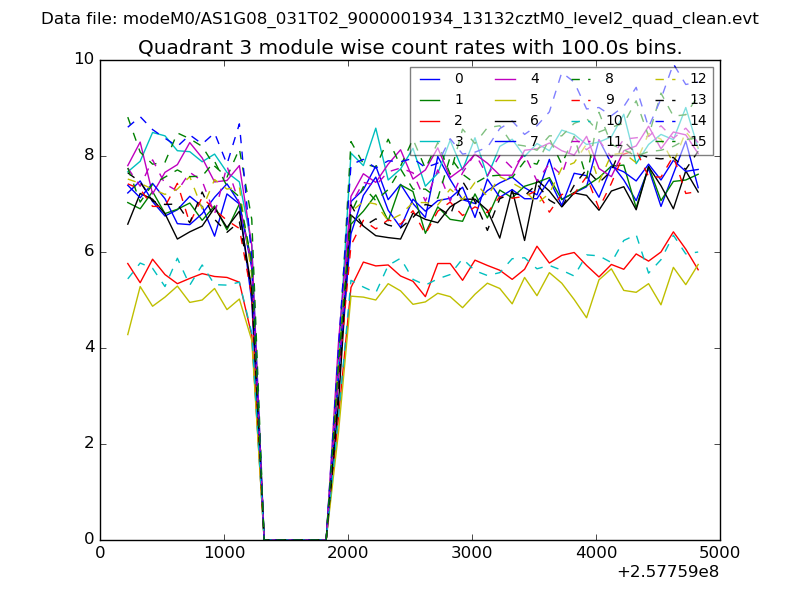
| Module-wise count rates for Quadrant A Data is divided into 100 sec bins |
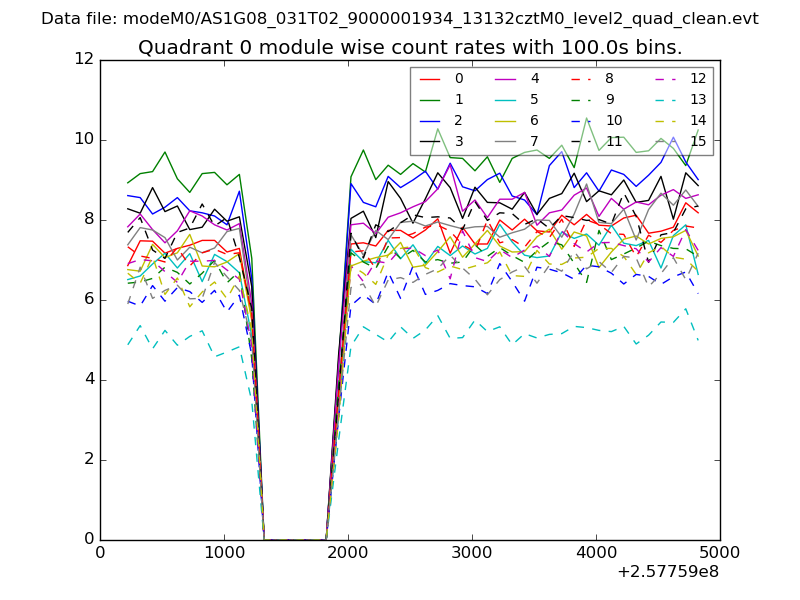 |
 |
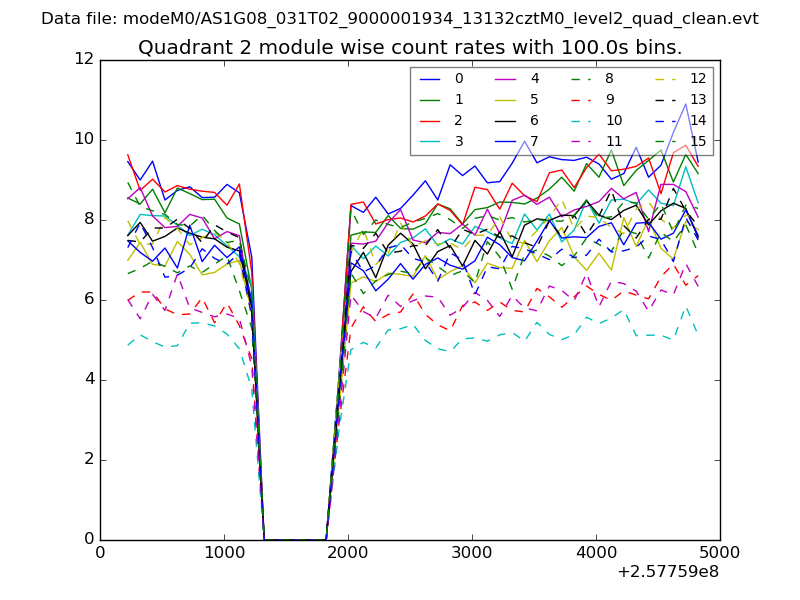
| Module-wise count rates for Quadrant B Data is divided into 100 sec bins |
 |
 |
| Module-wise count rates for Quadrant C Data is divided into 100 sec bins |
 |
 |
| Module-wise count rates for Quadrant D Data is divided into 100 sec bins |
 |
 |
| Parameter | Plot |
|---|---|
| CZT HV Monitor | 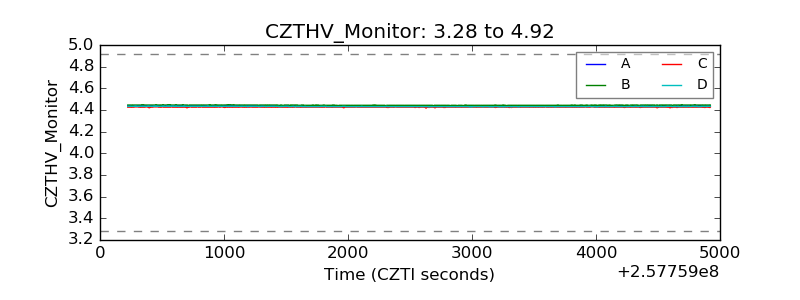 |
| D_VDD | 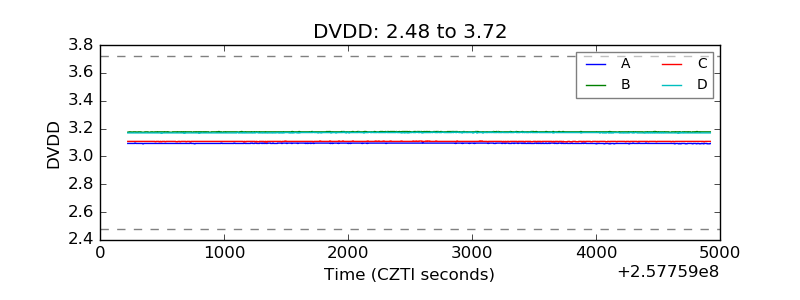 |
| Temperature 1 | 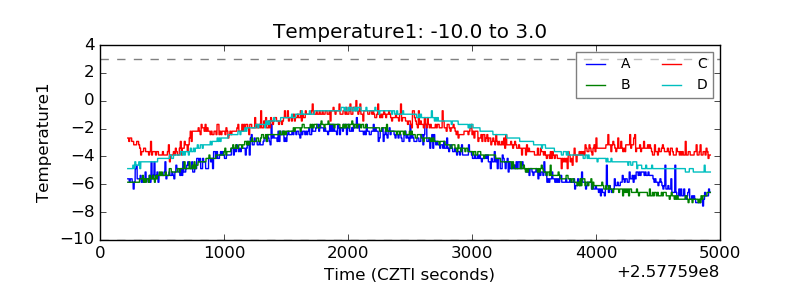 |
| Veto HV Monitor | 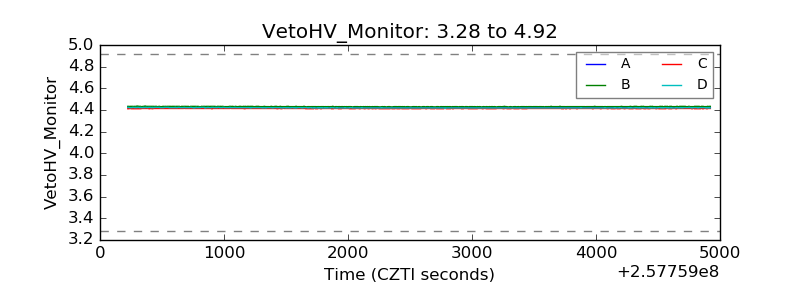 |
| Veto LLD | 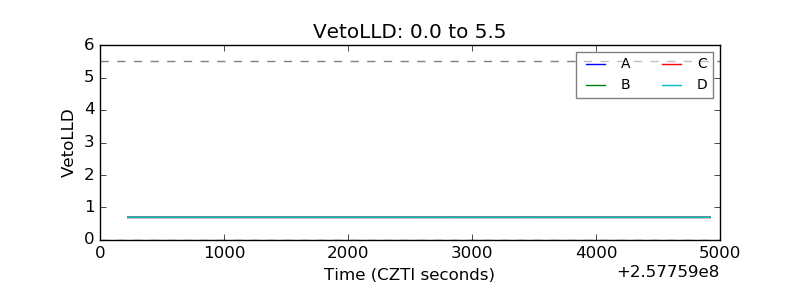 |
| Alpha Counter | 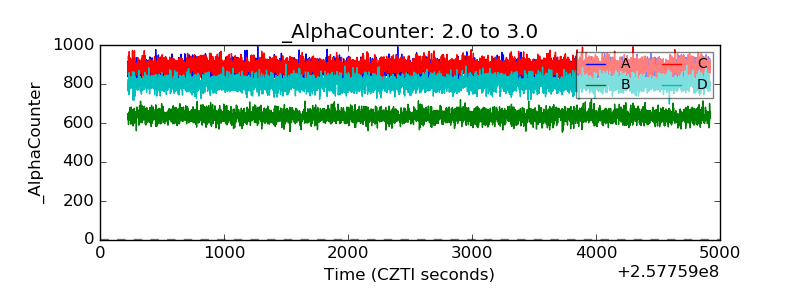 |
| _CPM_Rate | 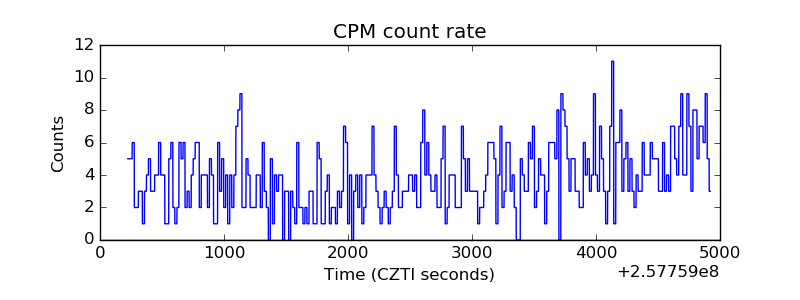 |
| CZT Counter |  |
| +2.5 Volts monitor |  |
| +5 Volts monitor |  |
| _ROLL_ROT | 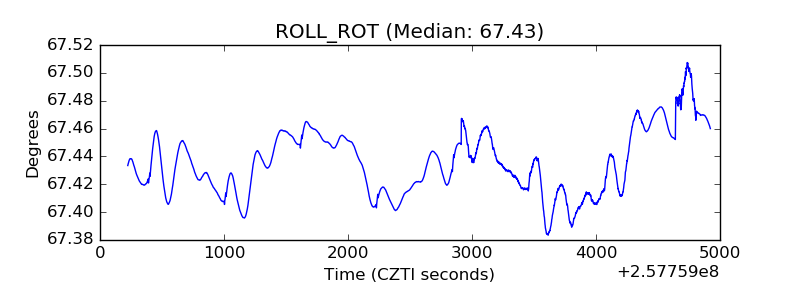 |
| _Roll_DEC |  |
| _Roll_RA | 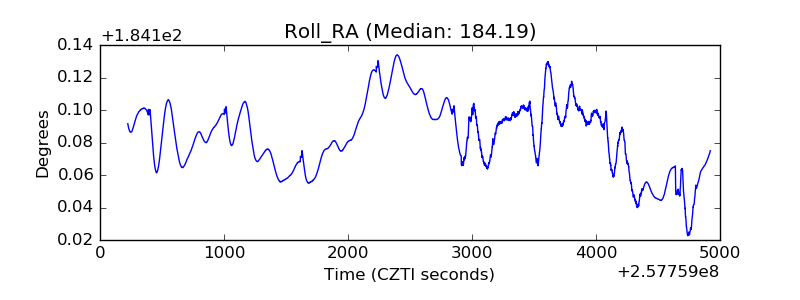 |
| Veto Counter | 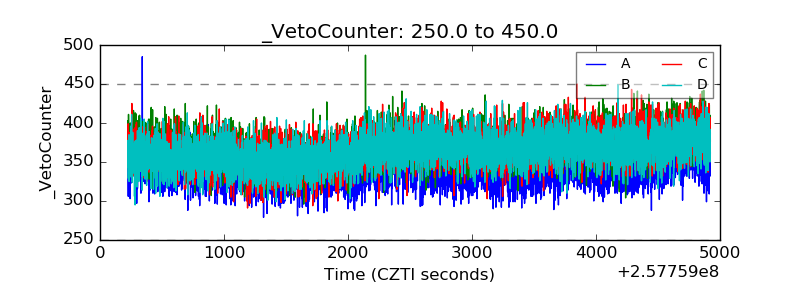 |