| Param | Original file | Final file |
|---|---|---|
| Filename | modeM0/AS1A04_053T05_9000001936cztM0_level2.fits | modeM0/AS1A04_053T05_9000001936cztM0_level2_quad_clean.evt |
| Size (bytes) | 84,864,960 | 89,075,520 |
| Size | 80.9 MB | 84.9 MB |
| Events in quadrant A | 510,782 | 545,470 |
| Events in quadrant B | 444,858 | 471,836 |
| Events in quadrant C | 507,758 | 526,656 |
| Events in quadrant D | 440,616 | 487,599 |
| Mode SS | |||
|---|---|---|---|
| Quadrant | BADHDUFLAG | Total packets | Discarded packets |
| A | 0 | 196 | 0 |
| B | 0 | 196 | 0 |
| C | 0 | 196 | 0 |
| D | 0 | 196 | 0 |
| Mode M0 | |||
|---|---|---|---|
| Quadrant | BADHDUFLAG | Total packets | Discarded packets |
| A | 0 | 20235 | 0 |
| B | 0 | 31547 | 0 |
| C | 0 | 19671 | 0 |
| D | 0 | 20671 | 0 |
| Mode M9 | |||
|---|---|---|---|
| Quadrant | BADHDUFLAG | Total packets | Discarded packets |
| A | 0 | 4 | 0 |
| B | 0 | 4 | 0 |
| C | 0 | 4 | 0 |
| D | 0 | 4 | 0 |
| Quadrant | Total seconds | Saturated seconds | Saturation percentage |
|---|---|---|---|
| A | 9595 | 327 | 3.408025% |
| B | 9595 | 1800 | 18.759771% |
| C | 9595 | 179 | 1.865555% |
| D | 9595 | 227 | 2.365816% |
Noise dominated data is calculated using 1-second bins in cleaned event files. If a bin has >2000 counts, and if more than 50% of those come from <1% of pixels, then it is considered to be noise-dominated and hence unusable.
| Quadrant | # 1 sec bins | Bins with >0 counts | Bins with >2000 counts | High rate bins dominated by noise | Noise dominated (total time) | Noise dominated (detector-on time) | Marked lightcurve |
|---|---|---|---|---|---|---|---|
| A | 9980 | 9595 | 0 | 0 | 0.00% | 0.00% | 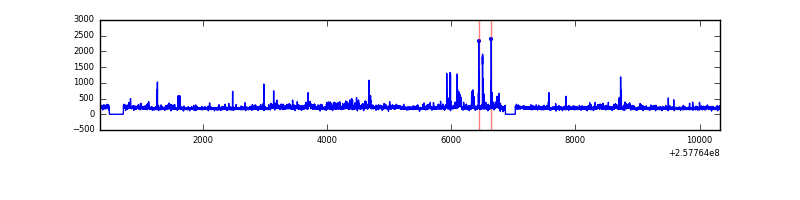 |
| B | 9980 | 9457 | 0 | 0 | 0.00% | 0.00% |  |
| C | 9980 | 9595 | 0 | 0 | 0.00% | 0.00% |  |
| D | 9980 | 9595 | 0 | 0 | 0.00% | 0.00% |  |
Top three noisy pixels from each quadrant. If the there are fewer than three noisy pixels in the level2.evt file, extra rows are filled as -1
| Pixel properties | Quadrant properties | ||||||
|---|---|---|---|---|---|---|---|
| Quadrant | DetID | PixID | Counts | Sigma | Mean | Median | Sigma |
| A | 0 | 29 | 500 | 10.54 | 133 | 125 | 35.6 |
| A | 7 | 110 | 406 | 7.89 | 133 | 125 | 35.6 |
| A | 0 | 30 | 389 | 7.42 | 133 | 125 | 35.6 |
| B | 2 | 9 | 383 | 10.47 | 117 | 112 | 25.9 |
| B | 5 | 232 | 304 | 7.42 | 117 | 112 | 25.9 |
| B | 14 | 254 | 300 | 7.26 | 117 | 112 | 25.9 |
| C | 2 | 191 | 372 | 6.83 | 134 | 125 | 36.2 |
| C | 12 | 241 | 366 | 6.66 | 134 | 125 | 36.2 |
| C | 9 | 233 | 366 | 6.66 | 134 | 125 | 36.2 |
| D | 10 | 189 | 329 | 6.11 | 125 | 113 | 35.3 |
| D | 6 | 231 | 328 | 6.08 | 125 | 113 | 35.3 |
| D | 1 | 19 | 315 | 5.72 | 125 | 113 | 35.3 |
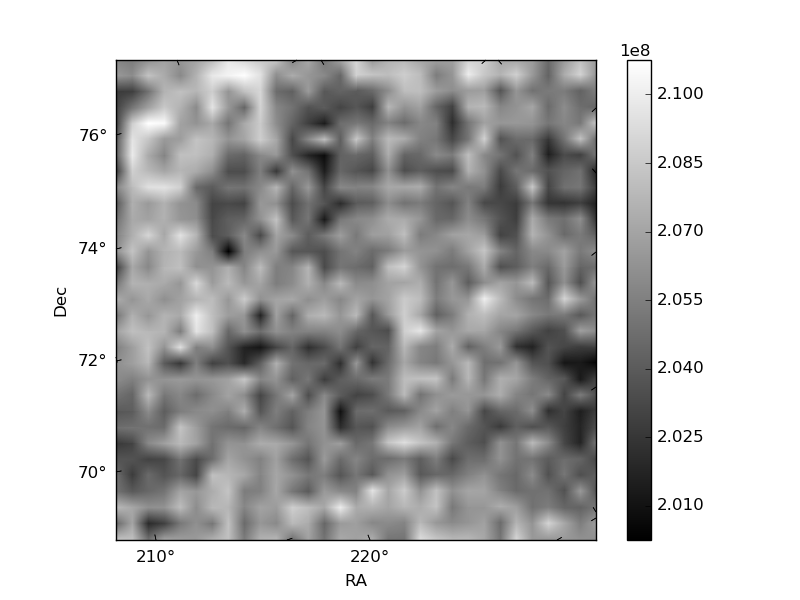
Histogram calculated using DETX and DETY for each event in the final _common_clean file
| Quadrant A | 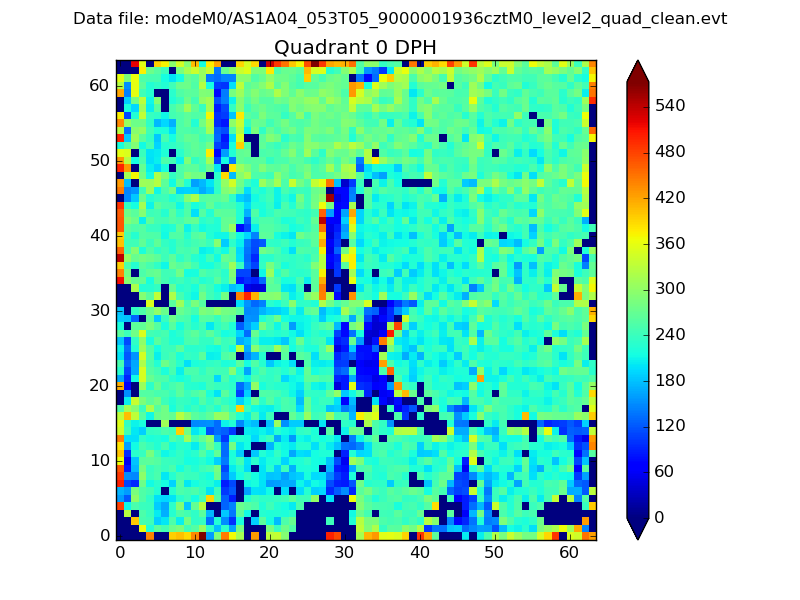 |
 |
Quadrant B |
|---|---|---|---|
| Quadrant D | 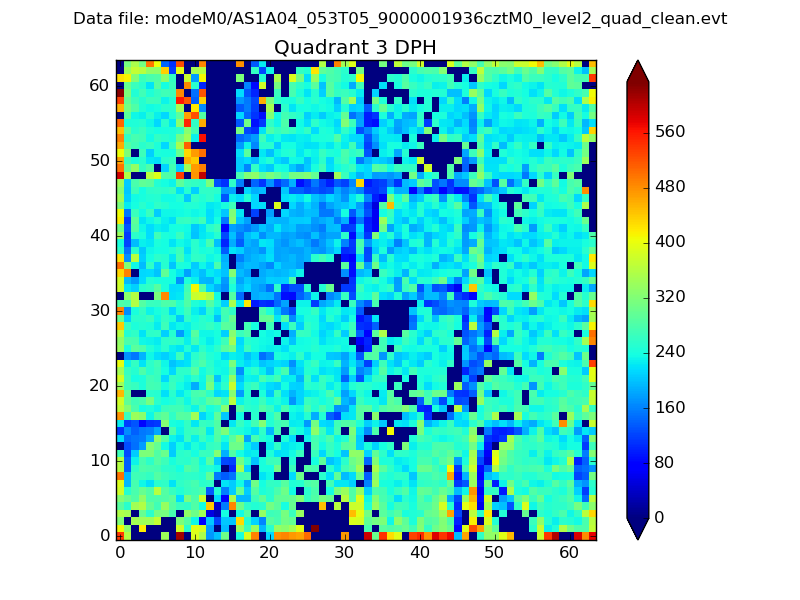 |
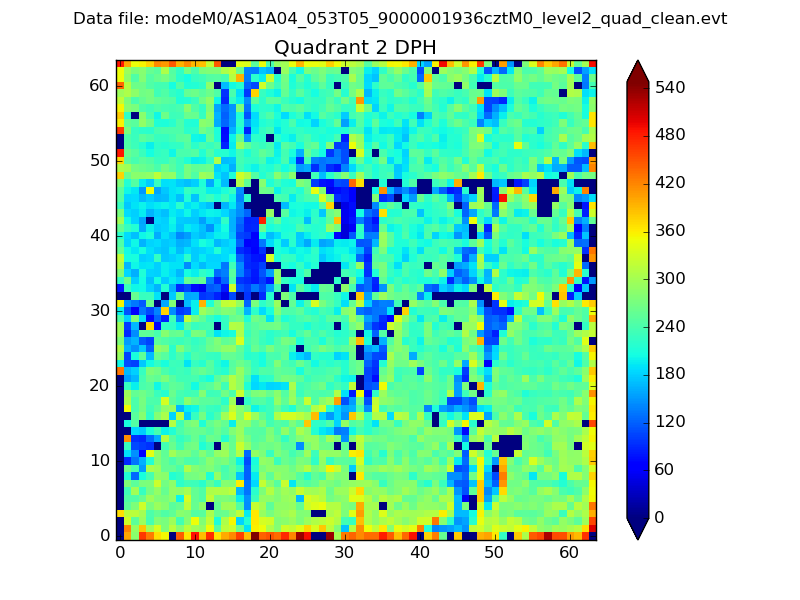 |
Quadrant C |
| Plot type | Count rate plots | Images |
|---|---|---|
| Comparison with Poisson distribution Blue bars denote a histogram of data divided into 1 sec bins. Red curve is a Poisson curve with rate = median count rate of data. |
 |
 |
| Quadrant-wise count rates Data is divided into 100 sec bins |
 |
|
| Module-wise count rates for Quadrant A Data is divided into 100 sec bins |
 |
 |
| Module-wise count rates for Quadrant B Data is divided into 100 sec bins |
 |
 |
| Module-wise count rates for Quadrant C Data is divided into 100 sec bins |
 |
 |
| Module-wise count rates for Quadrant D Data is divided into 100 sec bins |
 |
 |
| Parameter | Plot |
|---|---|
| CZT HV Monitor |  |
| D_VDD |  |
| Temperature 1 |  |
| Veto HV Monitor | 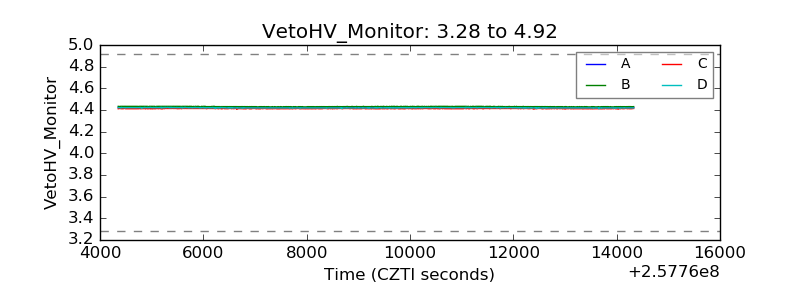 |
| Veto LLD |  |
| Alpha Counter |  |
| _CPM_Rate |  |
| CZT Counter |  |
| +2.5 Volts monitor |  |
| +5 Volts monitor |  |
| _ROLL_ROT |  |
| _Roll_DEC | 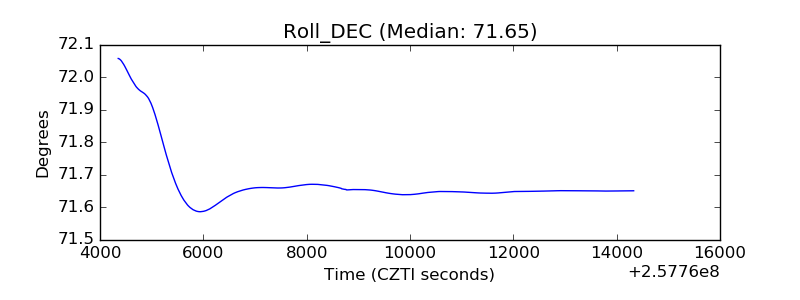 |
| _Roll_RA |  |
| Veto Counter |  |