| Param | Original file | Final file |
|---|---|---|
| Filename | modeM0/AS1A04_053T05_9000001936_13132cztM0_level2.evt | modeM0/AS1A04_053T05_9000001936_13132cztM0_level2_quad_clean.evt |
| Size (bytes) | 126,000,000 | 31,962,240 |
| Size | 120.2 MB | 30.5 MB |
| Events in quadrant A | 851,771 | 208,103 |
| Events in quadrant B | 1,234,859 | 206,294 |
| Events in quadrant C | 808,313 | 218,271 |
| Events in quadrant D | 798,500 | 205,706 |
| Mode SS | |||
|---|---|---|---|
| Quadrant | BADHDUFLAG | Total packets | Discarded packets |
| A | 0 | 38 | 0 |
| B | 0 | 38 | 0 |
| C | 0 | 38 | 0 |
| D | 0 | 38 | 0 |
| Mode M0 | |||
|---|---|---|---|
| Quadrant | BADHDUFLAG | Total packets | Discarded packets |
| A | 0 | 3788 | 2 |
| B | 0 | 4863 | 1 |
| C | 0 | 3736 | 1 |
| D | 0 | 3726 | 1 |
| Mode M9 | |||
|---|---|---|---|
| Quadrant | BADHDUFLAG | Total packets | Discarded packets |
| A | 0 | 2 | 0 |
| B | 0 | 2 | 0 |
| C | 0 | 2 | 0 |
| D | 0 | 2 | 0 |
| Quadrant | Total seconds | Saturated seconds | Saturation percentage |
|---|---|---|---|
| A | 1757 | 118 | 6.715993% |
| B | 1757 | 233 | 13.261241% |
| C | 1757 | 45 | 2.561184% |
| D | 1757 | 67 | 3.813318% |
Noise dominated data is calculated using 1-second bins in cleaned event files. If a bin has >2000 counts, and if more than 50% of those come from <1% of pixels, then it is considered to be noise-dominated and hence unusable.
| Quadrant | # 1 sec bins | Bins with >0 counts | Bins with >2000 counts | High rate bins dominated by noise | Noise dominated (total time) | Noise dominated (detector-on time) | Marked lightcurve |
|---|---|---|---|---|---|---|---|
| A | 1983 | 1759 | 0 | 0 | 0.00% | 0.00% | 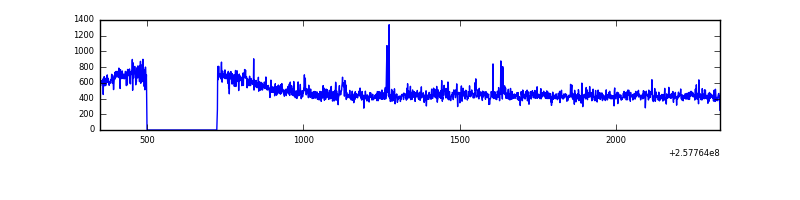 |
| B | 1983 | 1759 | 68 | 68 | 3.43% | 3.87% | 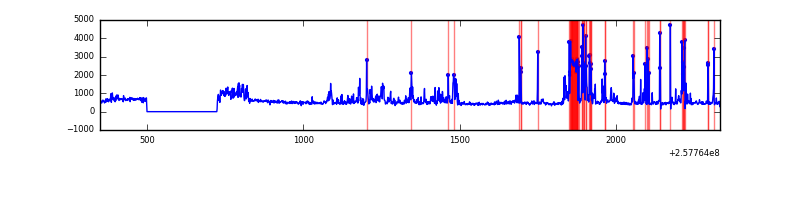 |
| C | 1983 | 1759 | 1 | 1 | 0.05% | 0.06% | 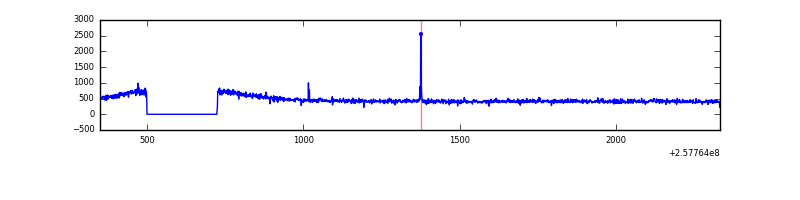 |
| D | 1983 | 1759 | 0 | 0 | 0.00% | 0.00% | 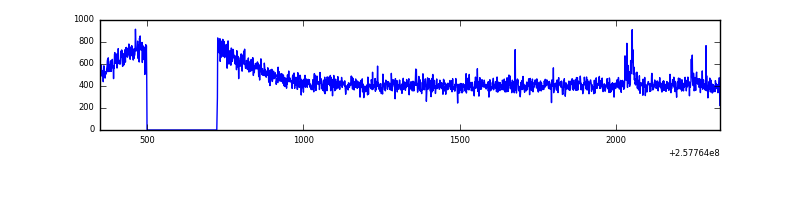 |
Top three noisy pixels from each quadrant. If the there are fewer than three noisy pixels in the level2.evt file, extra rows are filled as -1
| Pixel properties | Quadrant properties | ||||||
|---|---|---|---|---|---|---|---|
| Quadrant | DetID | PixID | Counts | Sigma | Mean | Median | Sigma |
| A | 4 | 2 | 14980 | 325.53 | 213 | 207 | 45.4 |
| A | 12 | 189 | 14295 | 310.44 | 213 | 207 | 45.4 |
| A | 0 | 226 | 2008 | 39.69 | 213 | 207 | 45.4 |
| B | 4 | 239 | 352990 | 8436.56 | 204 | 198 | 41.8 |
| B | 0 | 85 | 39875 | 948.82 | 204 | 198 | 41.8 |
| B | 3 | 64 | 28330 | 672.74 | 204 | 198 | 41.8 |
| C | 12 | 4 | 6722 | 135.19 | 204 | 203 | 48.2 |
| C | 8 | 128 | 3724 | 73.02 | 204 | 203 | 48.2 |
| C | 8 | 112 | 1751 | 32.1 | 204 | 203 | 48.2 |
| D | 1 | 52 | 19284 | 374.96 | 203 | 195 | 50.9 |
| D | 2 | 234 | 6452 | 122.9 | 203 | 195 | 50.9 |
| D | 2 | 69 | 4289 | 80.42 | 203 | 195 | 50.9 |
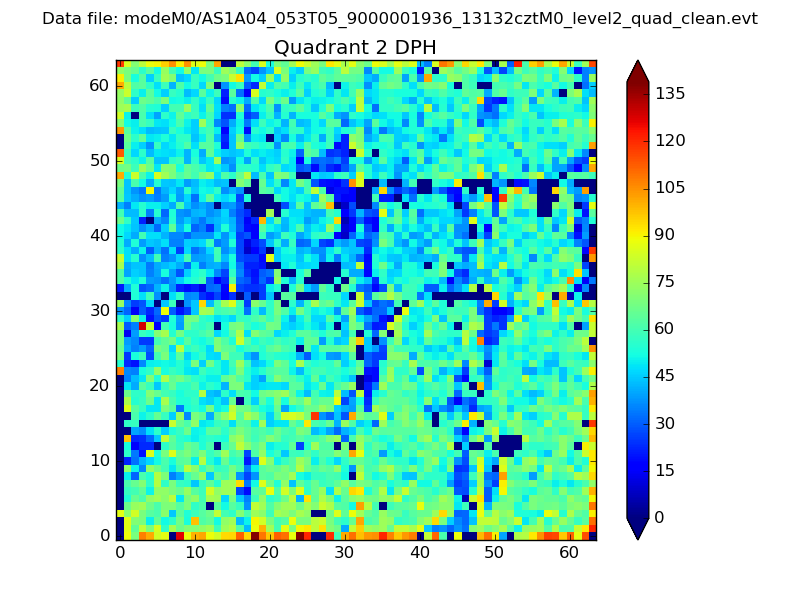
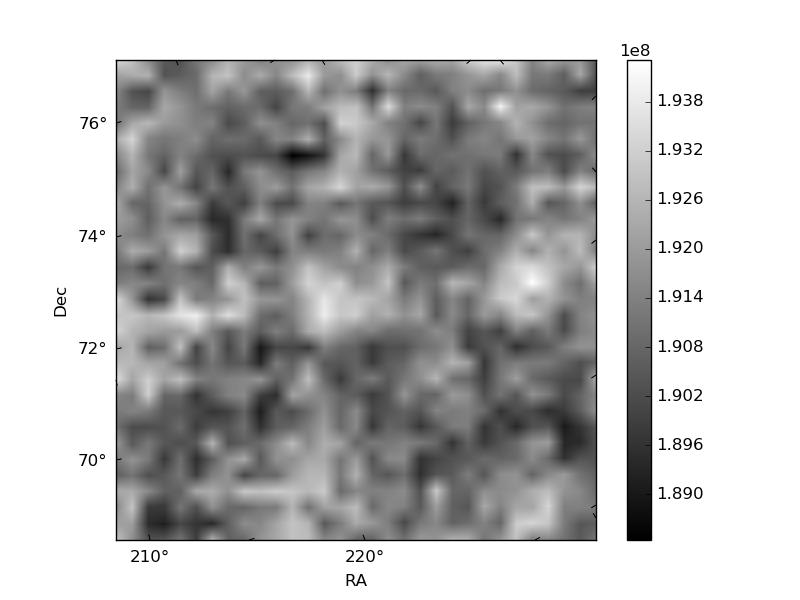
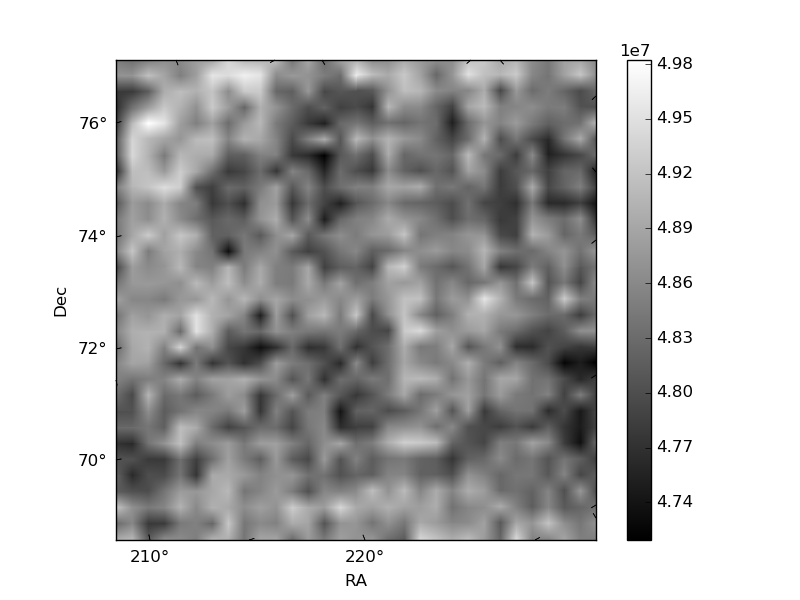
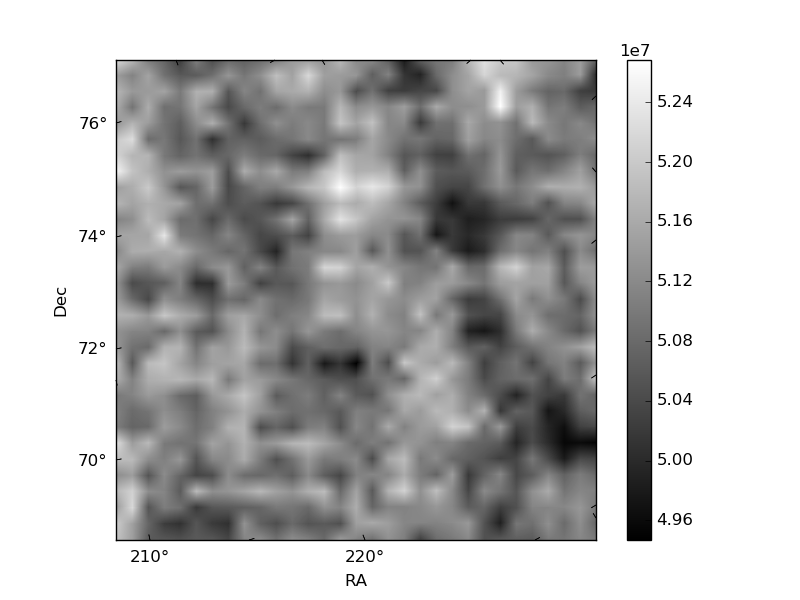
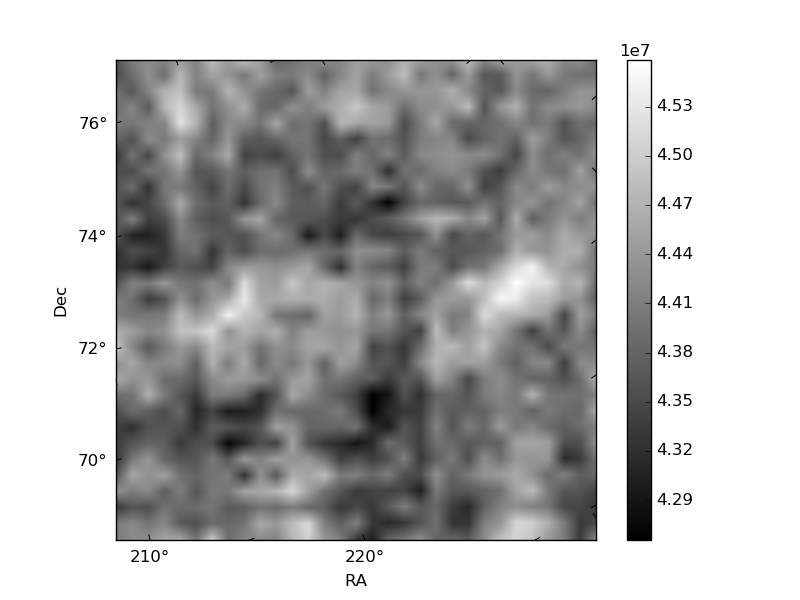
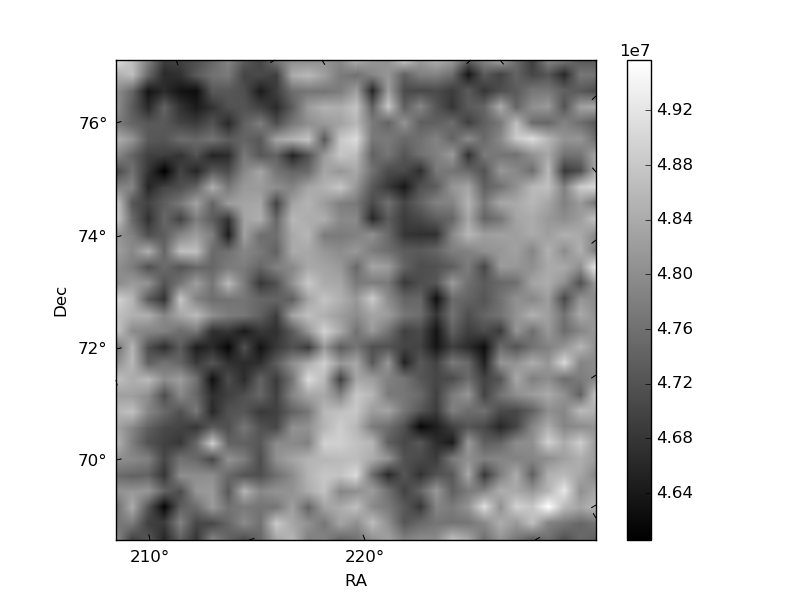
Histogram calculated using DETX and DETY for each event in the final _common_clean file
| Quadrant A | 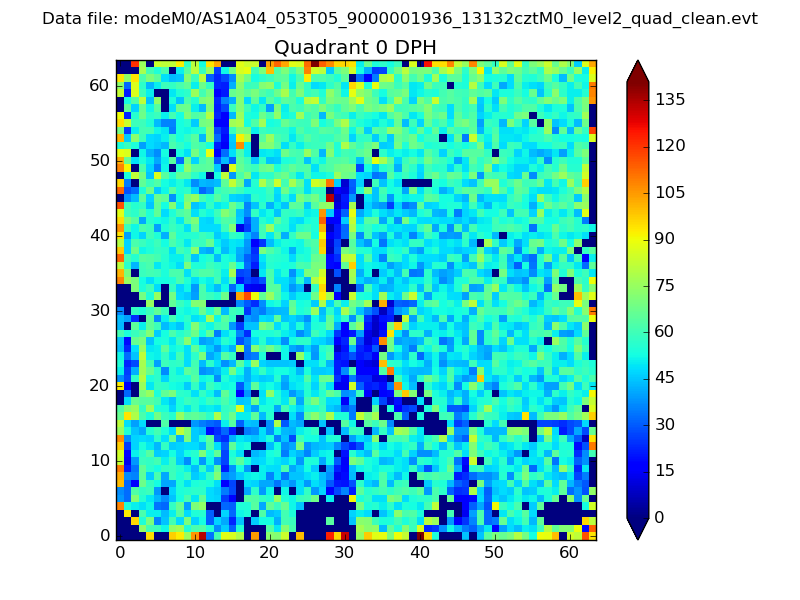 |
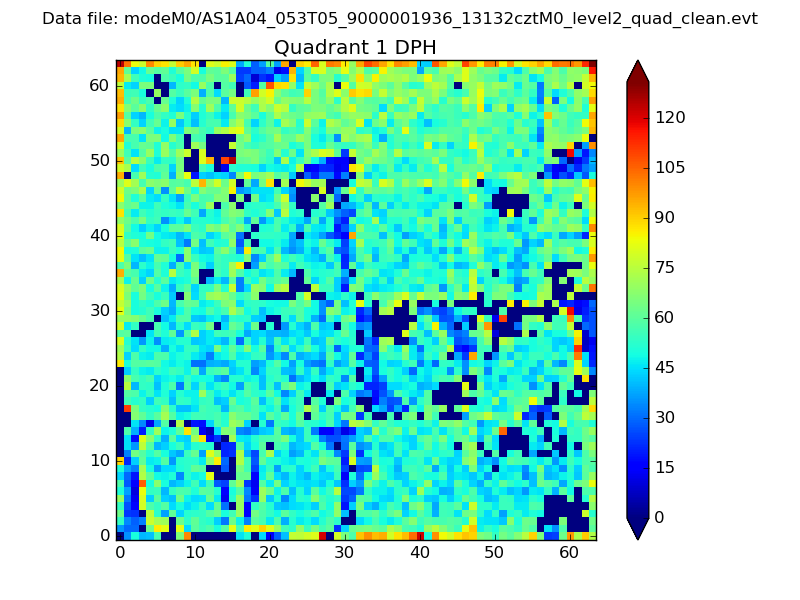 |
Quadrant B |
|---|---|---|---|
| Quadrant D | 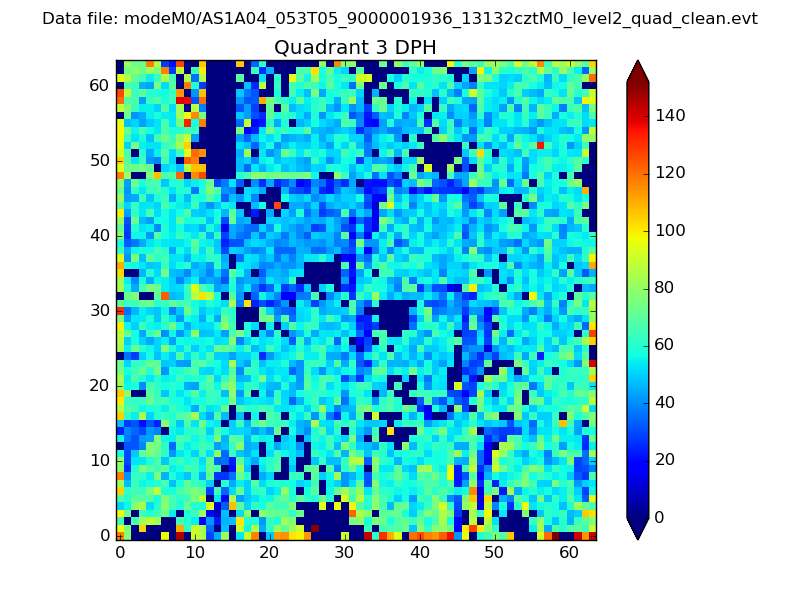 |
 |
Quadrant C |
| Plot type | Count rate plots | Images |
|---|---|---|
| Comparison with Poisson distribution Blue bars denote a histogram of data divided into 1 sec bins. Red curve is a Poisson curve with rate = median count rate of data. |
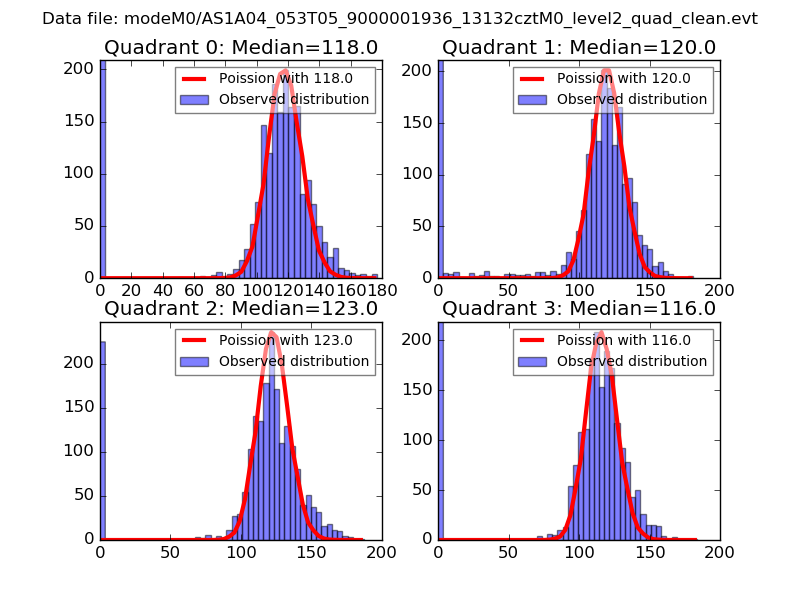 |
 |
| Quadrant-wise count rates Data is divided into 100 sec bins |
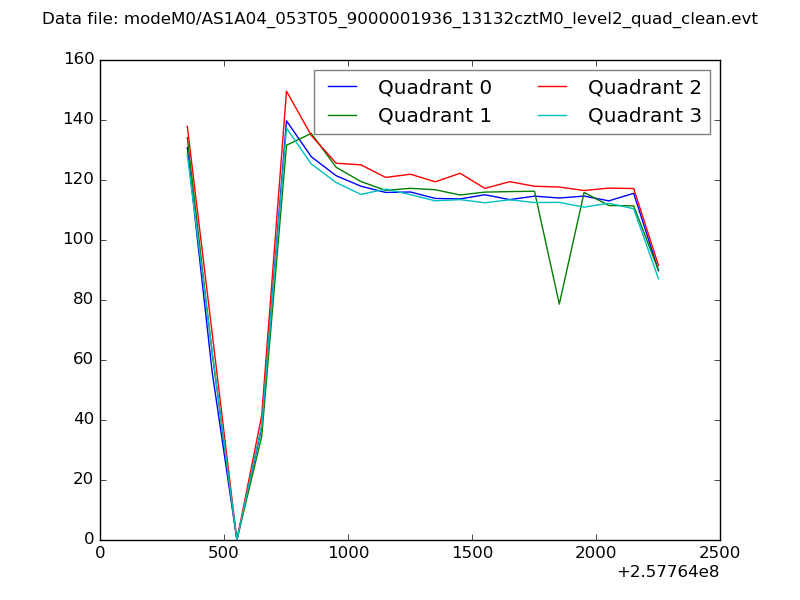 |
|
| Module-wise count rates for Quadrant A Data is divided into 100 sec bins |
 |
 |
| Module-wise count rates for Quadrant B Data is divided into 100 sec bins |
 |
 |
| Module-wise count rates for Quadrant C Data is divided into 100 sec bins |
 |
 |
| Module-wise count rates for Quadrant D Data is divided into 100 sec bins |
 |
 |
| Parameter | Plot |
|---|---|
| CZT HV Monitor |  |
| D_VDD | 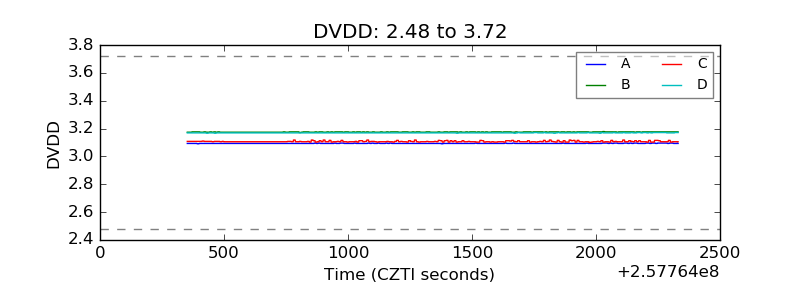 |
| Temperature 1 | 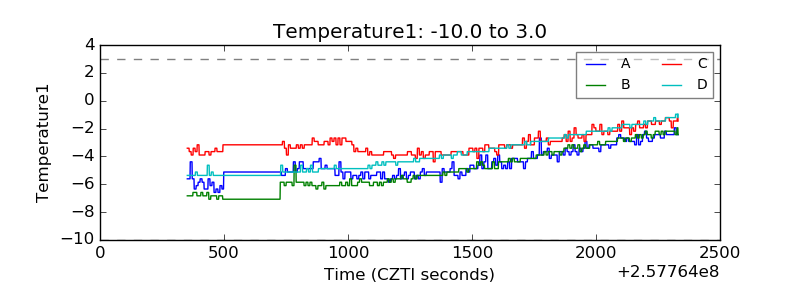 |
| Veto HV Monitor | 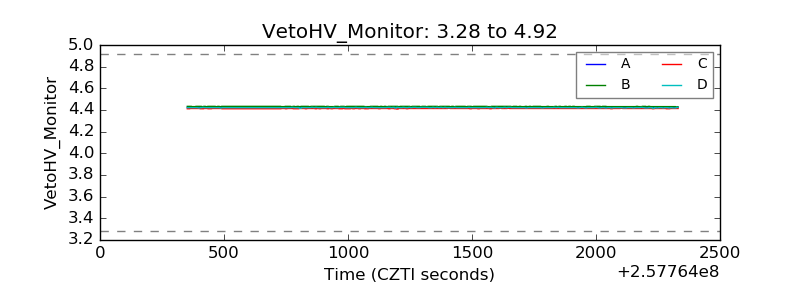 |
| Veto LLD |  |
| Alpha Counter | 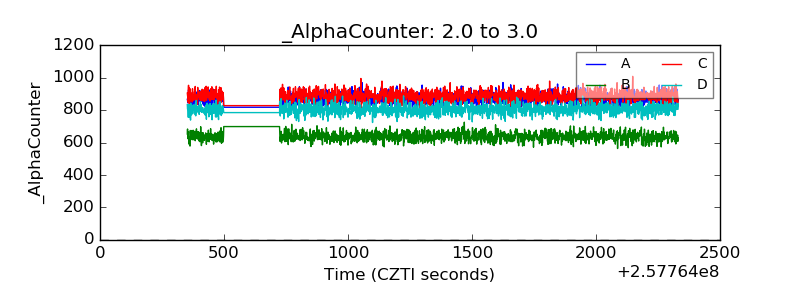 |
| _CPM_Rate | 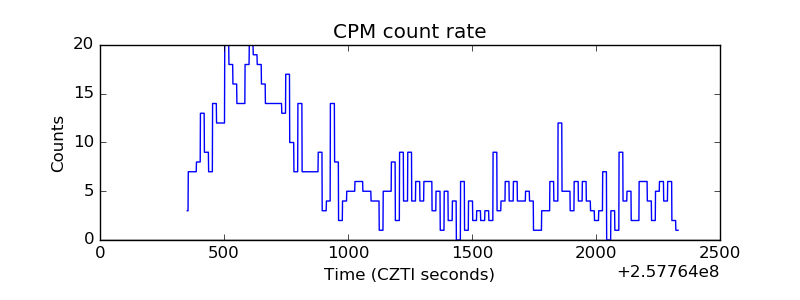 |
| CZT Counter | 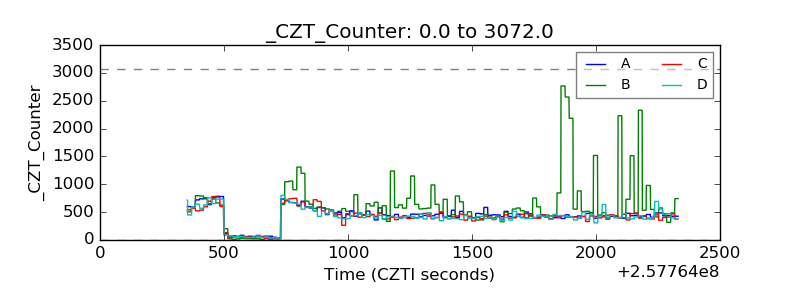 |
| +2.5 Volts monitor |  |
| +5 Volts monitor |  |
| _ROLL_ROT |  |
| _Roll_DEC | 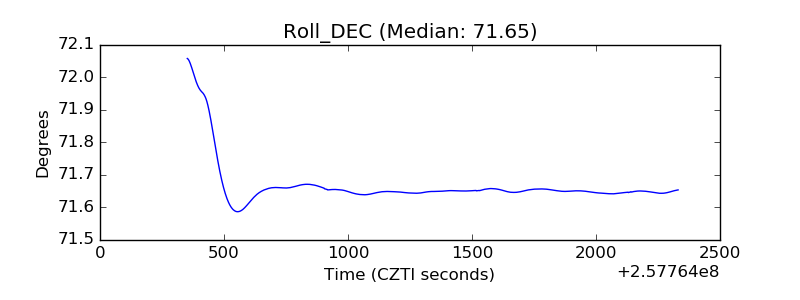 |
| _Roll_RA | 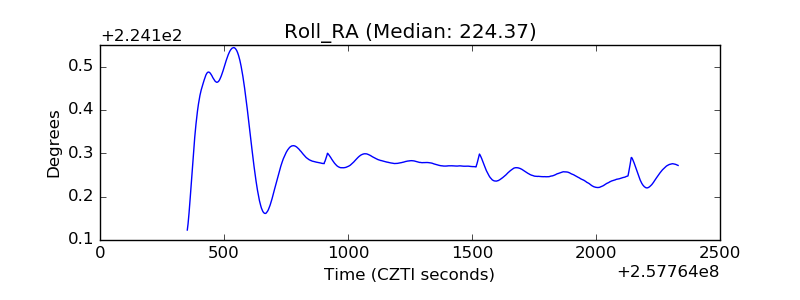 |
| Veto Counter |  |