| Param | Original file | Final file |
|---|---|---|
| Filename | modeM0/AS1A04_053T05_9000001936_13133cztM0_level2.evt | modeM0/AS1A04_053T05_9000001936_13133cztM0_level2_quad_clean.evt |
| Size (bytes) | 557,631,360 | 108,118,080 |
| Size | 531.8 MB | 103.1 MB |
| Events in quadrant A | 3,439,746 | 707,782 |
| Events in quadrant B | 6,388,040 | 658,435 |
| Events in quadrant C | 3,118,818 | 721,688 |
| Events in quadrant D | 3,457,215 | 689,689 |
| Mode SS | |||
|---|---|---|---|
| Quadrant | BADHDUFLAG | Total packets | Discarded packets |
| A | 0 | 144 | 0 |
| B | 0 | 144 | 0 |
| C | 0 | 144 | 0 |
| D | 0 | 144 | 0 |
| Mode M0 | |||
|---|---|---|---|
| Quadrant | BADHDUFLAG | Total packets | Discarded packets |
| A | 0 | 14993 | 2 |
| B | 0 | 23763 | 1 |
| C | 0 | 14527 | 1 |
| D | 0 | 15456 | 1 |
| Mode M9 | |||
|---|---|---|---|
| Quadrant | BADHDUFLAG | Total packets | Discarded packets |
| A | 0 | 2 | 0 |
| B | 0 | 2 | 0 |
| C | 0 | 2 | 0 |
| D | 0 | 2 | 0 |
| Quadrant | Total seconds | Saturated seconds | Saturation percentage |
|---|---|---|---|
| A | 7127 | 207 | 2.904448% |
| B | 7127 | 1333 | 18.703522% |
| C | 7127 | 132 | 1.852112% |
| D | 7127 | 160 | 2.244984% |
Noise dominated data is calculated using 1-second bins in cleaned event files. If a bin has >2000 counts, and if more than 50% of those come from <1% of pixels, then it is considered to be noise-dominated and hence unusable.
| Quadrant | # 1 sec bins | Bins with >0 counts | Bins with >2000 counts | High rate bins dominated by noise | Noise dominated (total time) | Noise dominated (detector-on time) | Marked lightcurve |
|---|---|---|---|---|---|---|---|
| A | 7288 | 7129 | 8 | 8 | 0.11% | 0.11% | 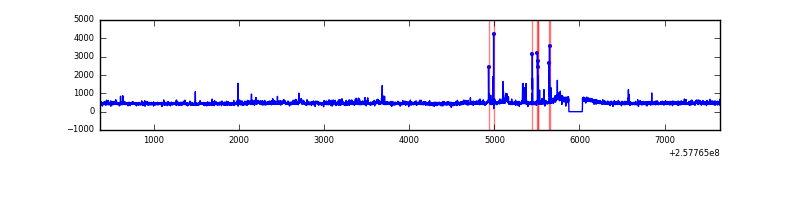 |
| B | 7288 | 7129 | 790 | 790 | 10.84% | 11.08% | 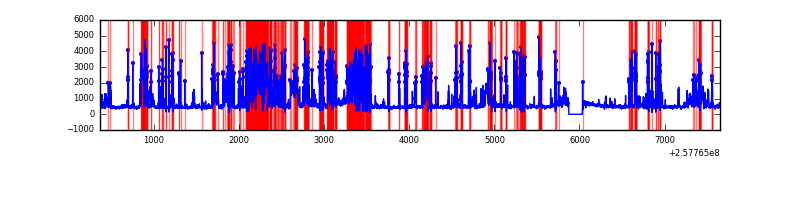 |
| C | 7288 | 7129 | 1 | 1 | 0.01% | 0.01% | 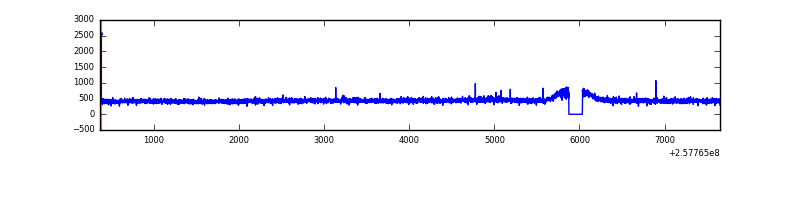 |
| D | 7288 | 7129 | 14 | 14 | 0.19% | 0.20% | 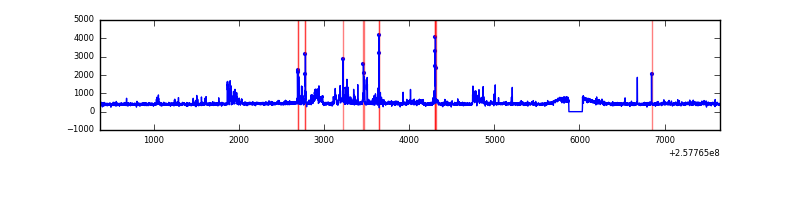 |
Top three noisy pixels from each quadrant. If the there are fewer than three noisy pixels in the level2.evt file, extra rows are filled as -1
| Pixel properties | Quadrant properties | ||||||
|---|---|---|---|---|---|---|---|
| Quadrant | DetID | PixID | Counts | Sigma | Mean | Median | Sigma |
| A | 12 | 189 | 139358 | 836.39 | 817 | 797 | 165.7 |
| A | 15 | 223 | 80312 | 479.97 | 817 | 797 | 165.7 |
| A | 15 | 239 | 31368 | 184.54 | 817 | 797 | 165.7 |
| B | 4 | 239 | 2684205 | 18835.34 | 744 | 725 | 142.5 |
| B | 0 | 85 | 357033 | 2500.93 | 744 | 725 | 142.5 |
| B | 3 | 64 | 233539 | 1634.12 | 744 | 725 | 142.5 |
| C | 8 | 128 | 9236 | 46.04 | 792 | 794 | 183.4 |
| C | 12 | 4 | 8398 | 41.47 | 792 | 794 | 183.4 |
| C | 13 | 61 | 5926 | 27.99 | 792 | 794 | 183.4 |
| D | 1 | 52 | 228748 | 1204.99 | 789 | 765 | 189.2 |
| D | 5 | 222 | 53708 | 279.83 | 789 | 765 | 189.2 |
| D | 10 | 157 | 51874 | 270.13 | 789 | 765 | 189.2 |
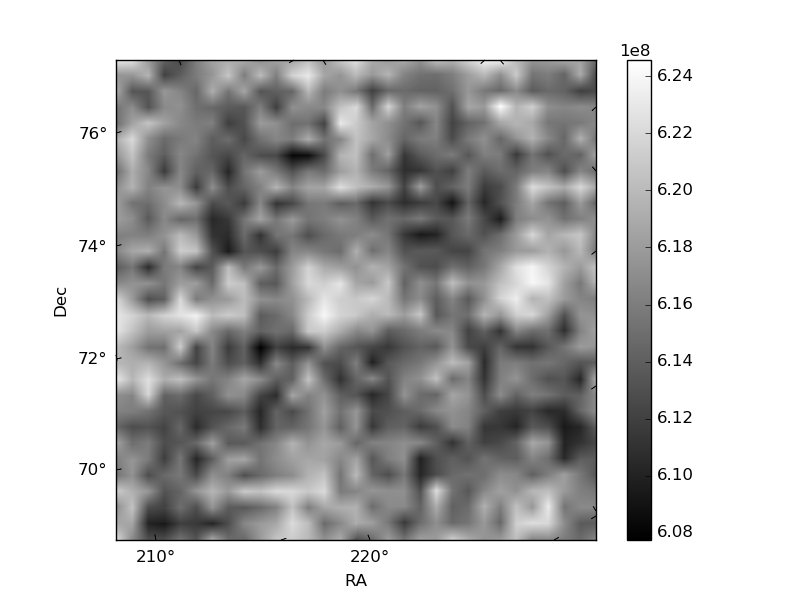
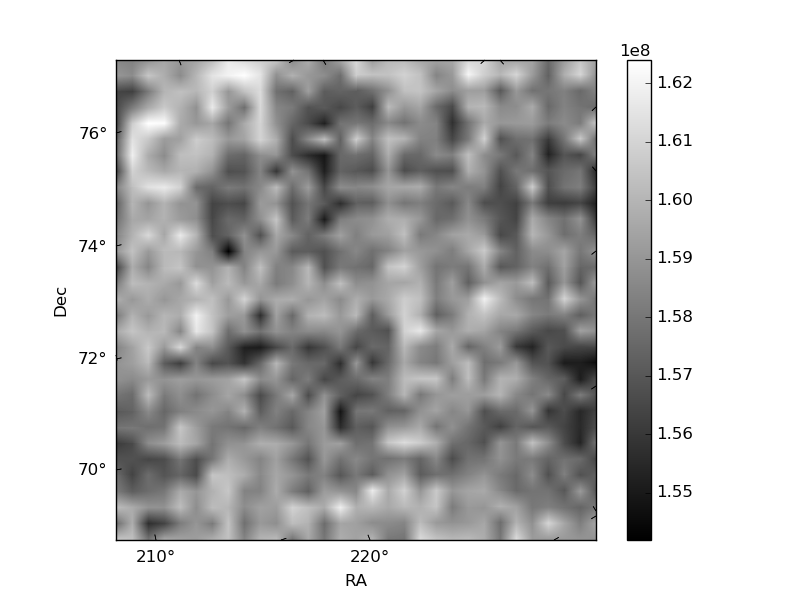
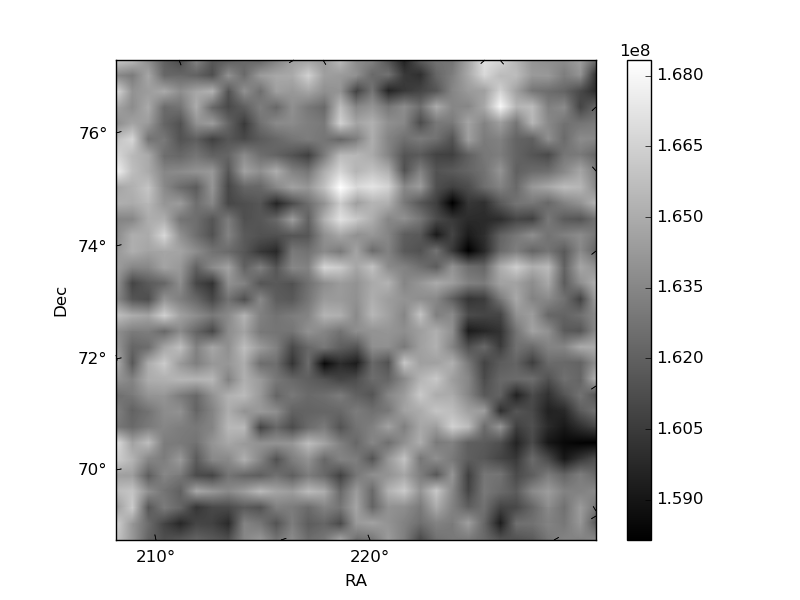
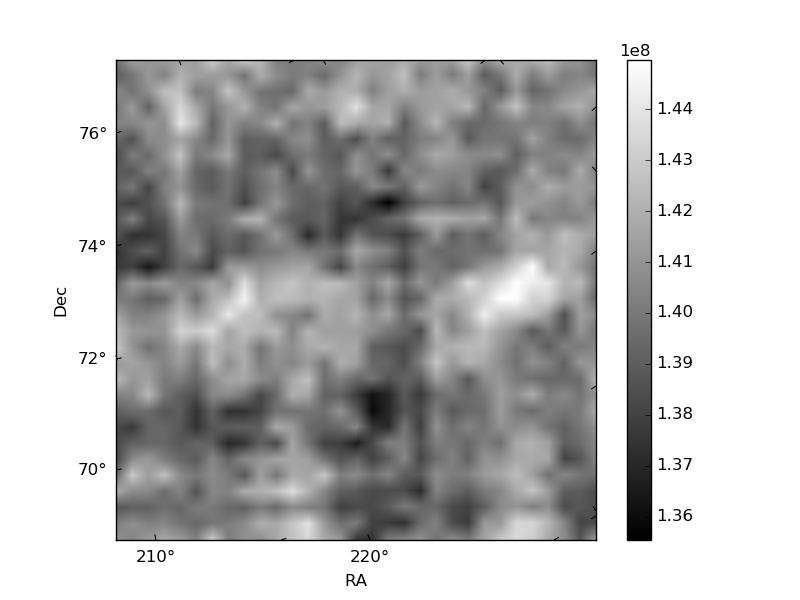
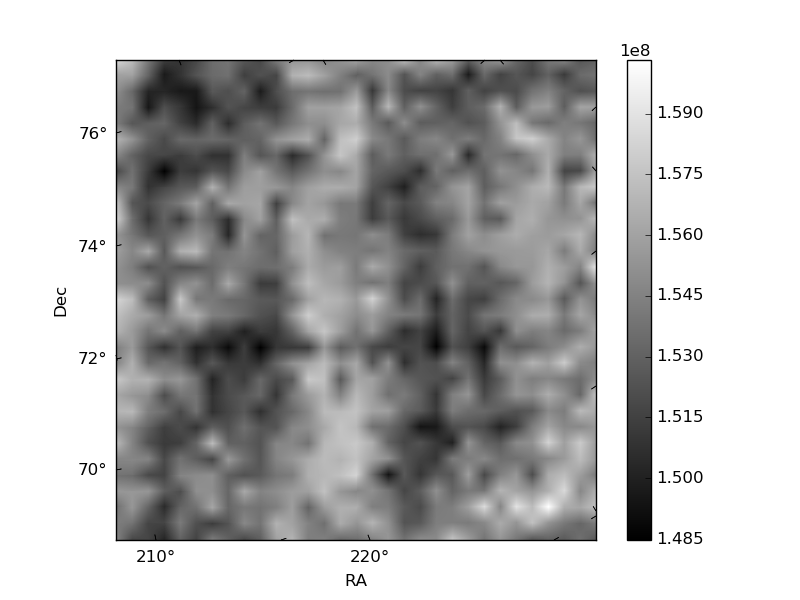
Histogram calculated using DETX and DETY for each event in the final _common_clean file
| Quadrant A | 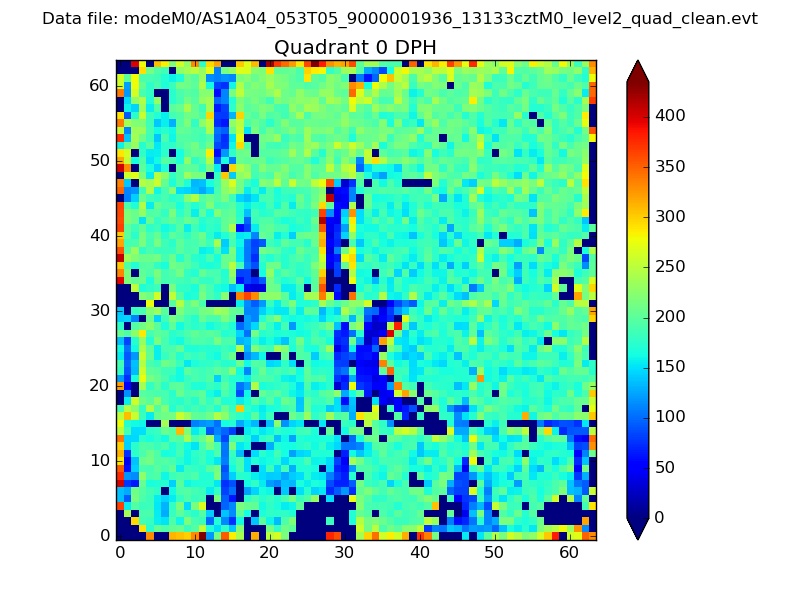 |
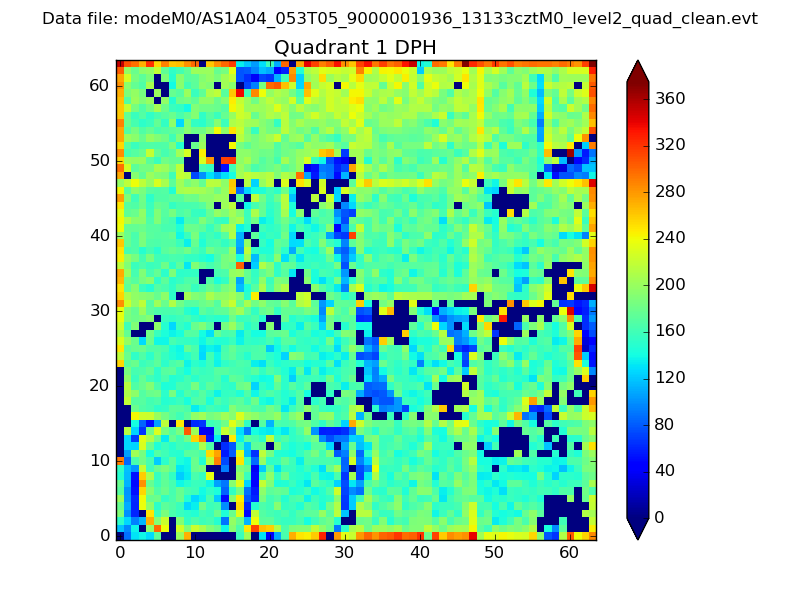 |
Quadrant B |
|---|---|---|---|
| Quadrant D | 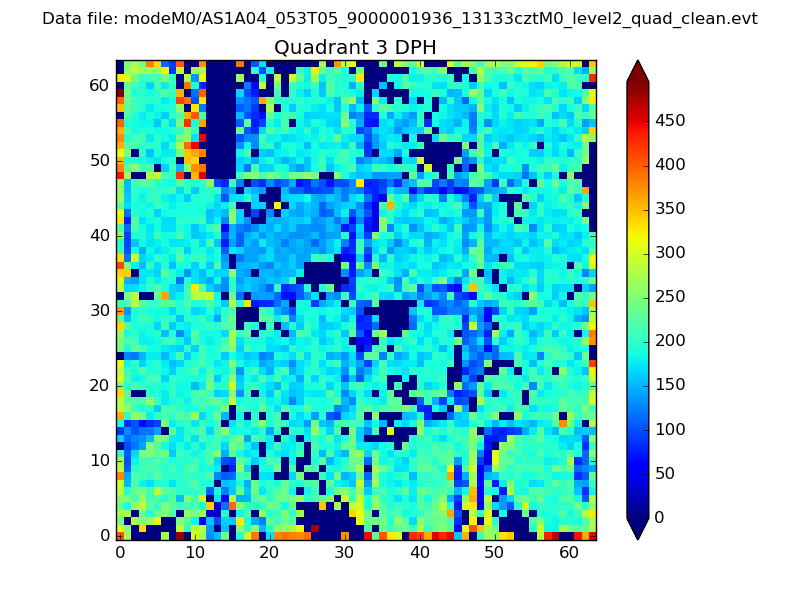 |
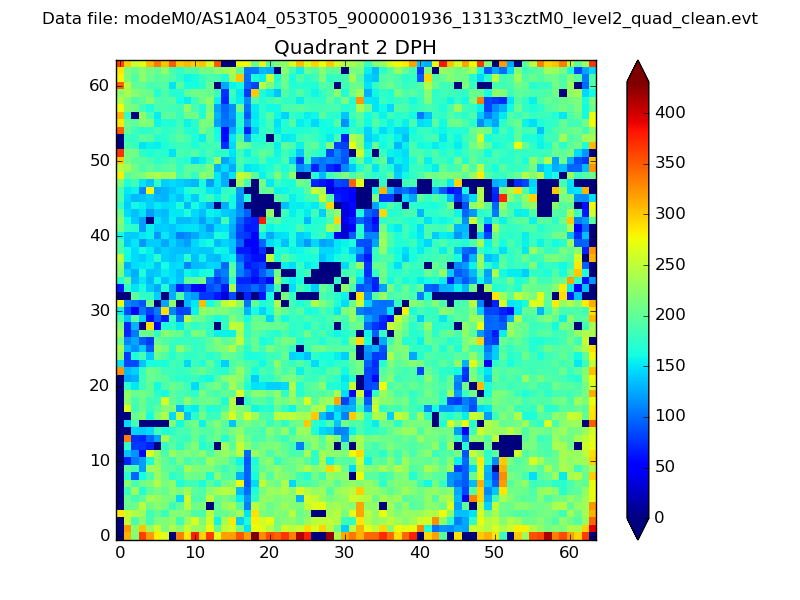 |
Quadrant C |
| Plot type | Count rate plots | Images |
|---|---|---|
| Comparison with Poisson distribution Blue bars denote a histogram of data divided into 1 sec bins. Red curve is a Poisson curve with rate = median count rate of data. |
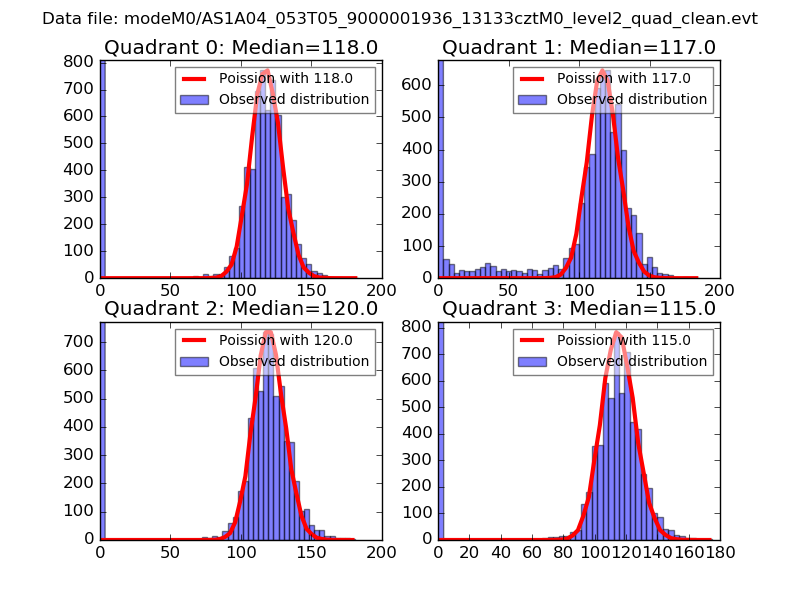 |
 |
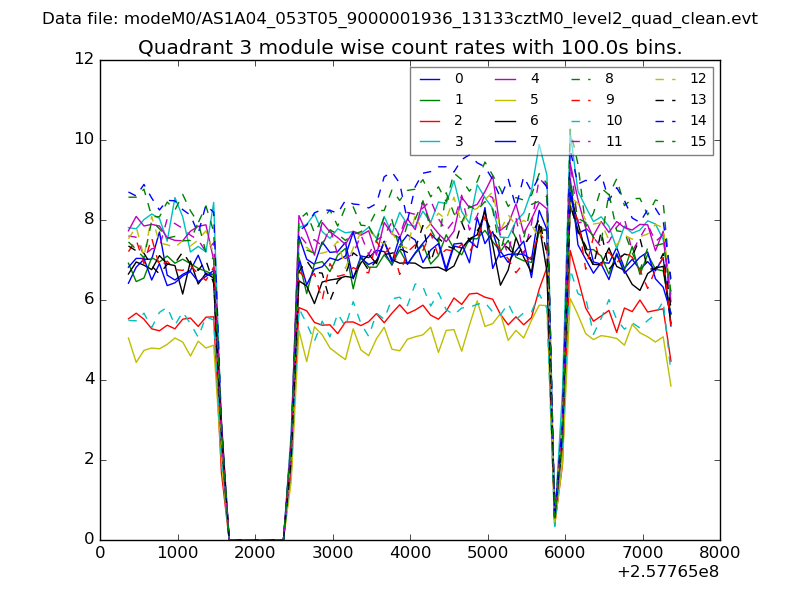
| Quadrant-wise count rates Data is divided into 100 sec bins |
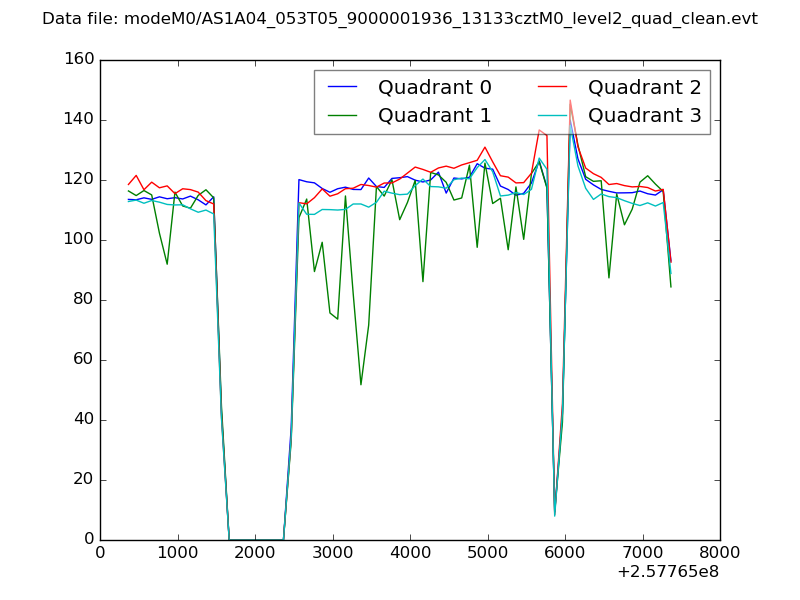 |
|
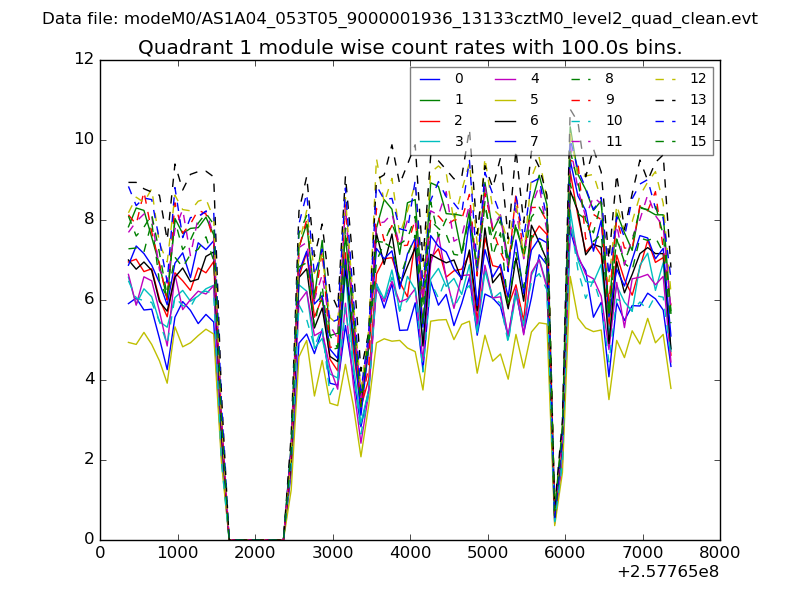
| Module-wise count rates for Quadrant A Data is divided into 100 sec bins |
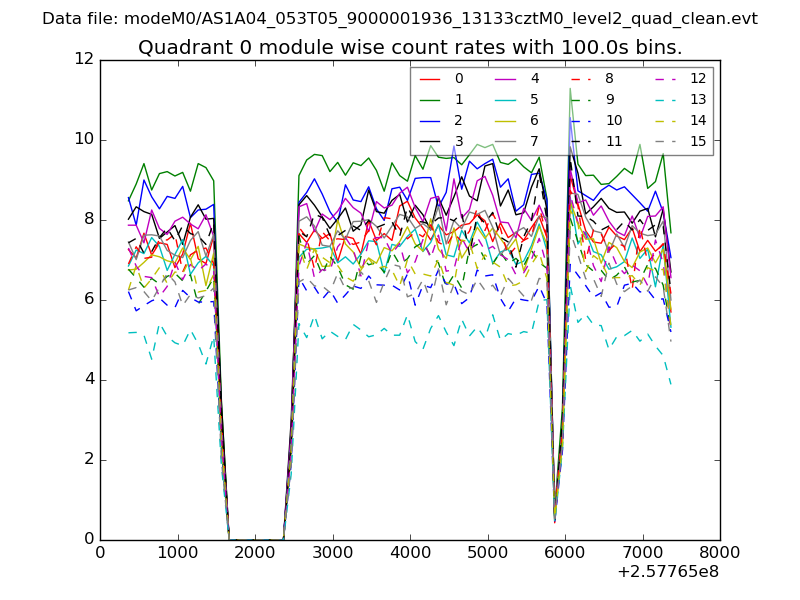 |
 |
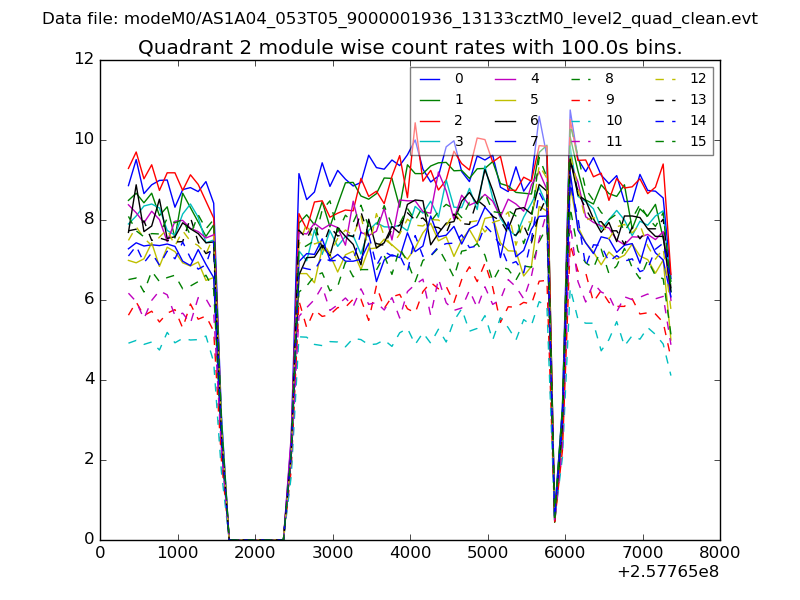
| Module-wise count rates for Quadrant B Data is divided into 100 sec bins |
 |
 |
| Module-wise count rates for Quadrant C Data is divided into 100 sec bins |
 |
 |
| Module-wise count rates for Quadrant D Data is divided into 100 sec bins |
 |
 |
| Parameter | Plot |
|---|---|
| CZT HV Monitor | 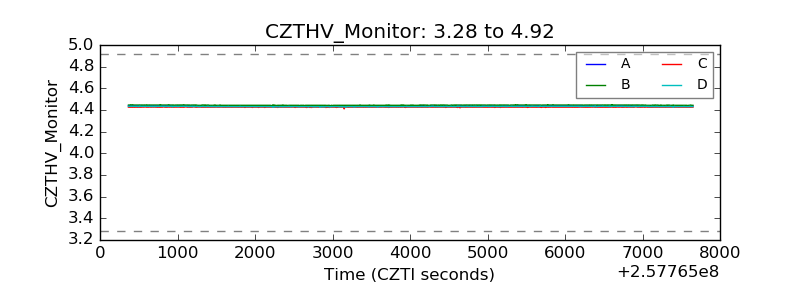 |
| D_VDD | 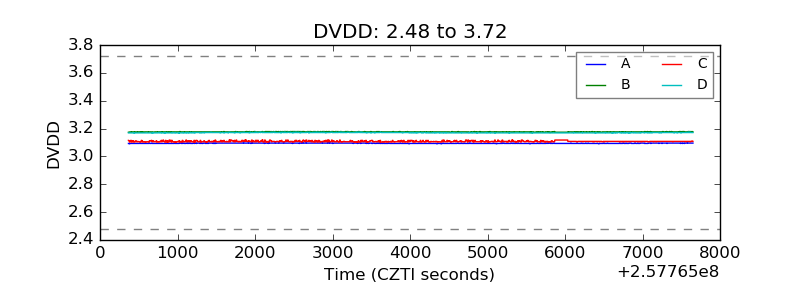 |
| Temperature 1 | 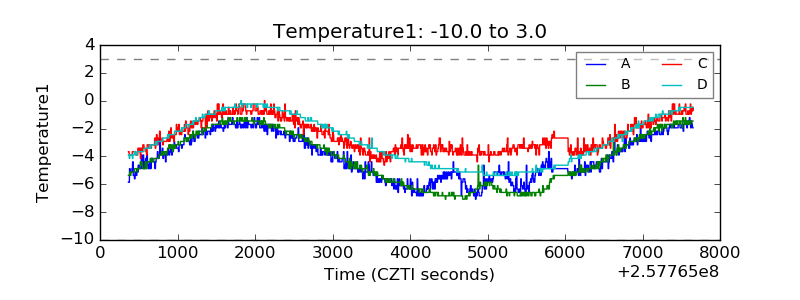 |
| Veto HV Monitor | 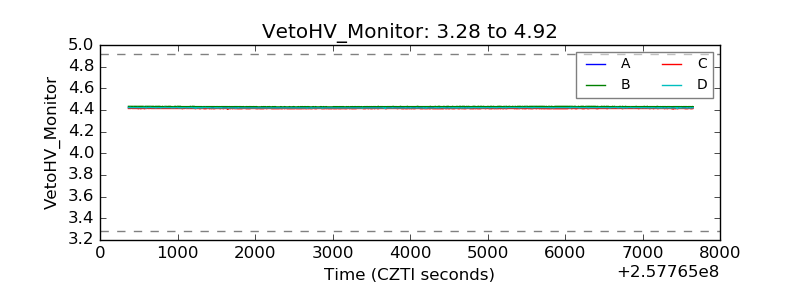 |
| Veto LLD | 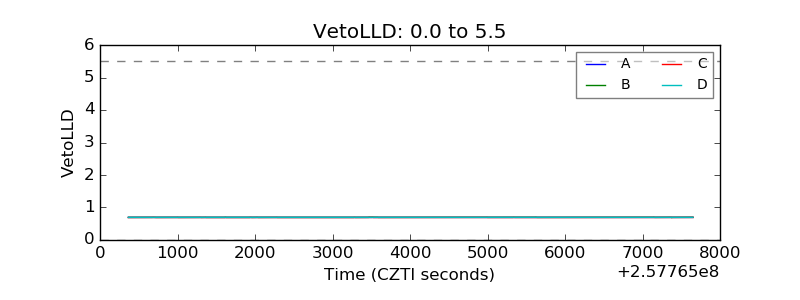 |
| Alpha Counter | 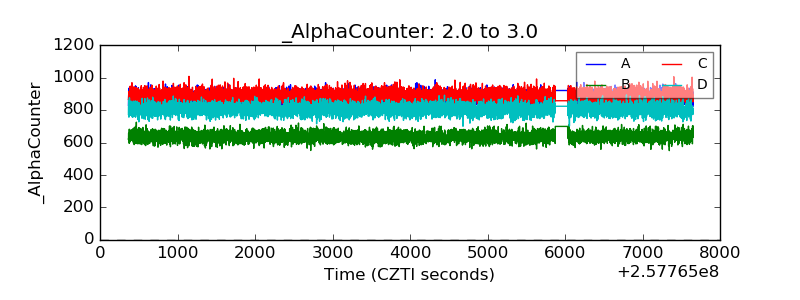 |
| _CPM_Rate | 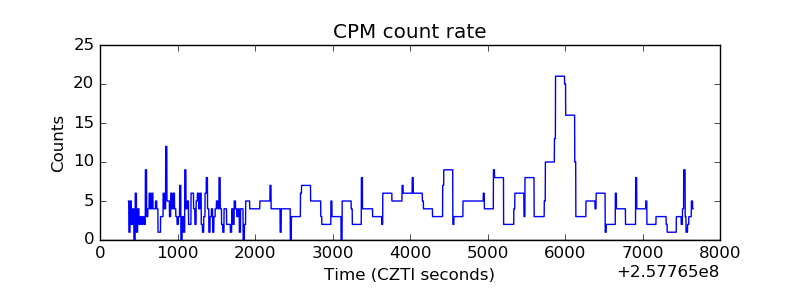 |
| CZT Counter | 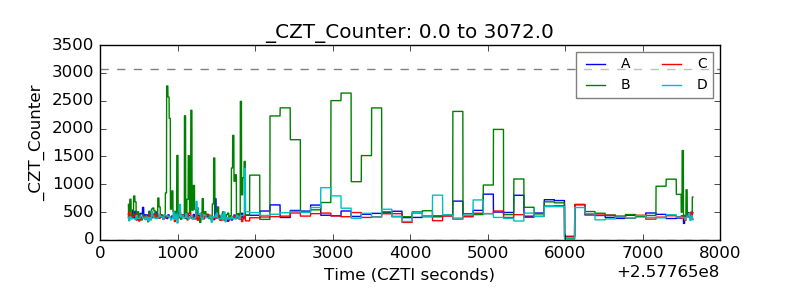 |
| +2.5 Volts monitor | 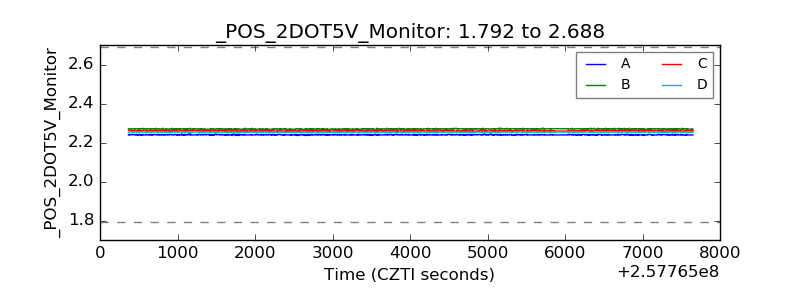 |
| +5 Volts monitor | 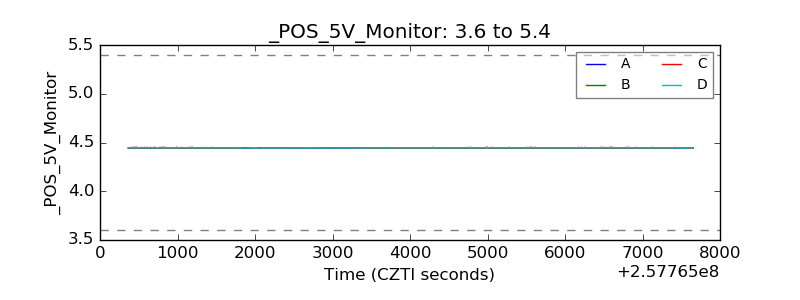 |
| _ROLL_ROT | 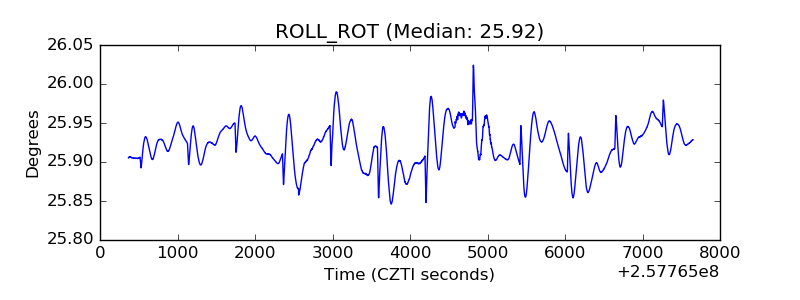 |
| _Roll_DEC | 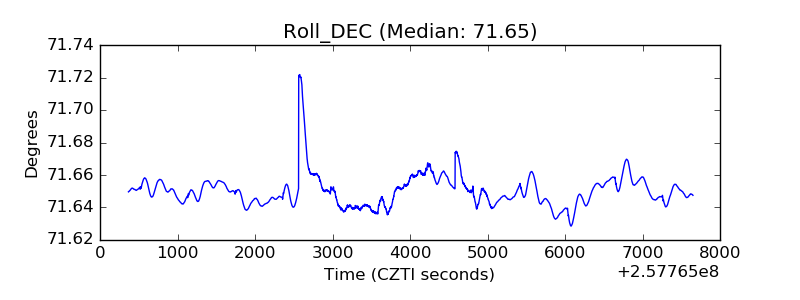 |
| _Roll_RA | 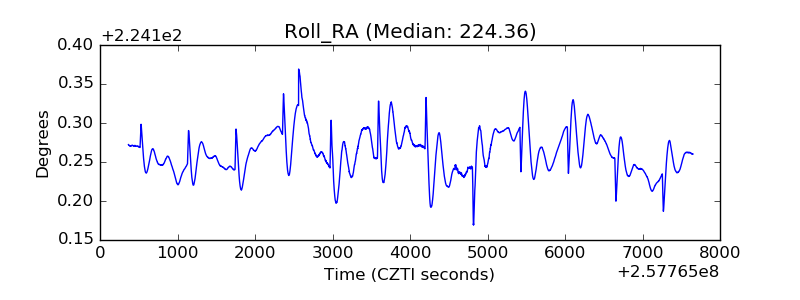 |
| Veto Counter | 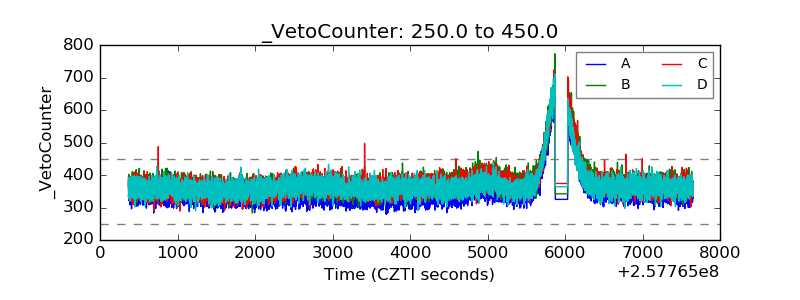 |