| Param | Original file | Final file |
|---|---|---|
| Filename | modeM0/AS1A04_053T05_9000001936_13136cztM0_level2.evt | modeM0/AS1A04_053T05_9000001936_13136cztM0_level2_quad_clean.evt |
| Size (bytes) | 223,220,160 | 38,661,120 |
| Size | 212.9 MB | 36.9 MB |
| Events in quadrant A | 1,399,495 | 245,123 |
| Events in quadrant B | 2,523,375 | 228,119 |
| Events in quadrant C | 1,288,158 | 244,163 |
| Events in quadrant D | 1,340,227 | 236,065 |
| Mode SS | |||
|---|---|---|---|
| Quadrant | BADHDUFLAG | Total packets | Discarded packets |
| A | 0 | 62 | 0 |
| B | 0 | 62 | 0 |
| C | 0 | 62 | 0 |
| D | 0 | 62 | 0 |
| Mode M0 | |||
|---|---|---|---|
| Quadrant | BADHDUFLAG | Total packets | Discarded packets |
| A | 0 | 6143 | 0 |
| B | 0 | 9520 | 0 |
| C | 0 | 6083 | 0 |
| D | 0 | 6182 | 0 |
| Quadrant | Total seconds | Saturated seconds | Saturation percentage |
|---|---|---|---|
| A | 3040 | 4 | 0.131579% |
| B | 3040 | 420 | 13.815789% |
| C | 3040 | 3 | 0.098684% |
| D | 3040 | 1 | 0.032895% |
Noise dominated data is calculated using 1-second bins in cleaned event files. If a bin has >2000 counts, and if more than 50% of those come from <1% of pixels, then it is considered to be noise-dominated and hence unusable.
| Quadrant | # 1 sec bins | Bins with >0 counts | Bins with >2000 counts | High rate bins dominated by noise | Noise dominated (total time) | Noise dominated (detector-on time) | Marked lightcurve |
|---|---|---|---|---|---|---|---|
| A | 3041 | 3041 | 0 | 0 | 0.00% | 0.00% | 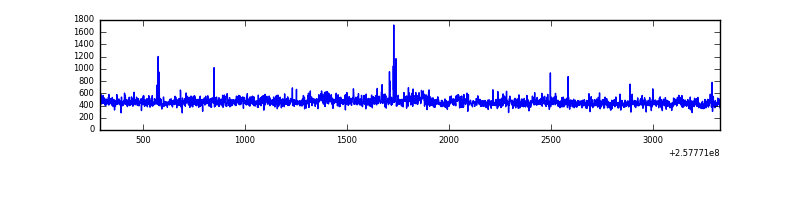 |
| B | 3041 | 3041 | 299 | 299 | 9.83% | 9.83% | 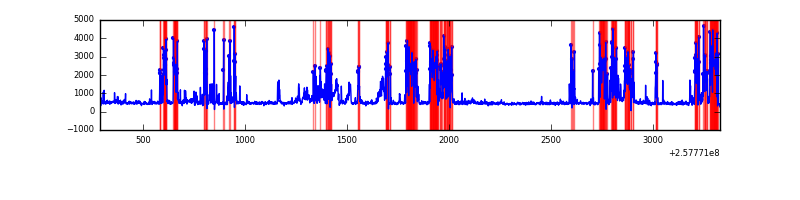 |
| C | 3041 | 3041 | 0 | 0 | 0.00% | 0.00% | 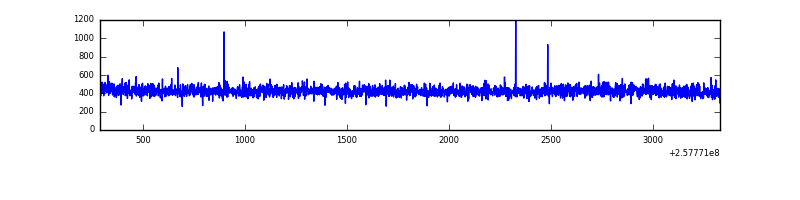 |
| D | 3041 | 3041 | 1 | 1 | 0.03% | 0.03% | 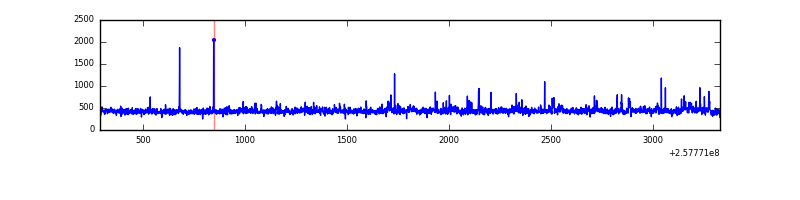 |
Top three noisy pixels from each quadrant. If the there are fewer than three noisy pixels in the level2.evt file, extra rows are filled as -1
| Pixel properties | Quadrant properties | ||||||
|---|---|---|---|---|---|---|---|
| Quadrant | DetID | PixID | Counts | Sigma | Mean | Median | Sigma |
| A | 12 | 189 | 35873 | 500.95 | 344 | 337 | 70.9 |
| A | 1 | 162 | 16893 | 233.39 | 344 | 337 | 70.9 |
| A | 15 | 223 | 8687 | 117.71 | 344 | 337 | 70.9 |
| B | 4 | 239 | 938534 | 15283.4 | 312 | 305 | 61.4 |
| B | 0 | 85 | 233637 | 3800.89 | 312 | 305 | 61.4 |
| B | 0 | 230 | 47614 | 770.65 | 312 | 305 | 61.4 |
| C | 13 | 61 | 2435 | 27.18 | 329 | 330 | 77.4 |
| C | 0 | 207 | 2336 | 25.9 | 329 | 330 | 77.4 |
| C | 14 | 225 | 1687 | 17.52 | 329 | 330 | 77.4 |
| D | 1 | 52 | 48912 | 603.64 | 331 | 321 | 80.5 |
| D | 2 | 234 | 12073 | 145.99 | 331 | 321 | 80.5 |
| D | 5 | 222 | 6666 | 78.82 | 331 | 321 | 80.5 |
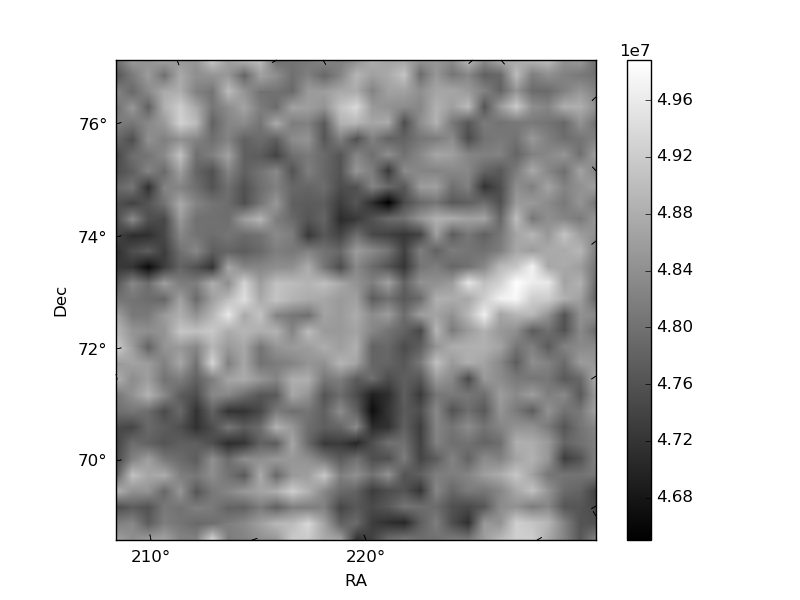
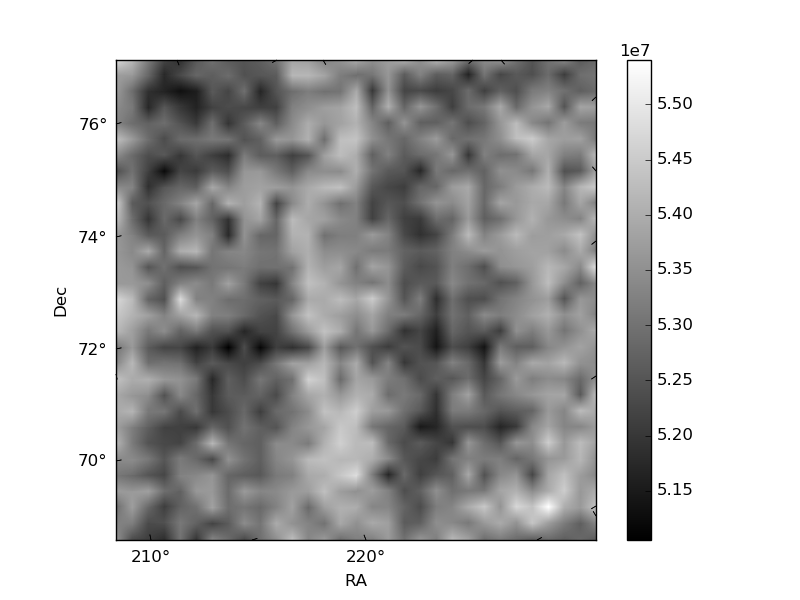
Histogram calculated using DETX and DETY for each event in the final _common_clean file
| Quadrant A | 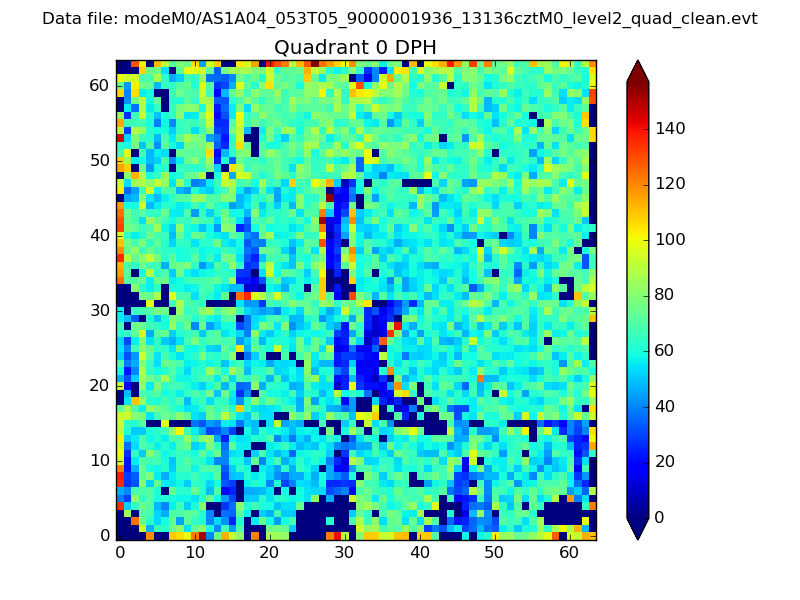 |
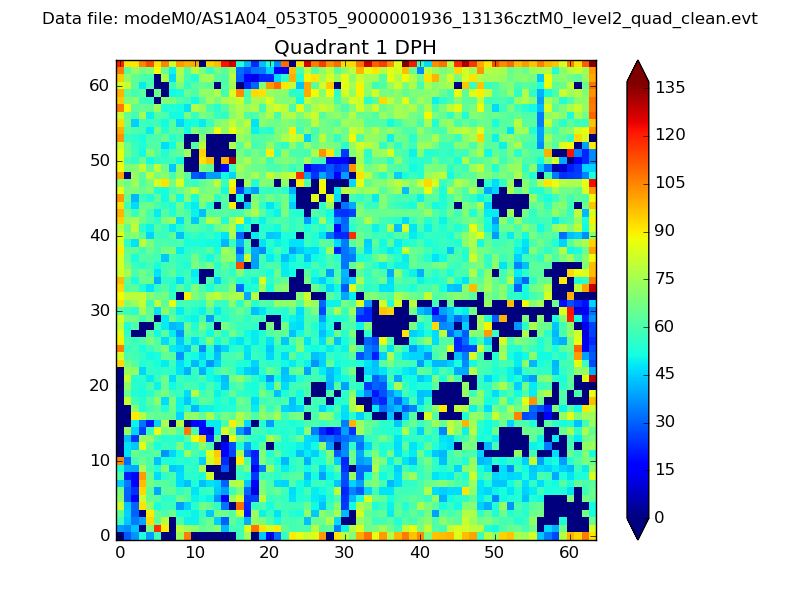 |
Quadrant B |
|---|---|---|---|
| Quadrant D | 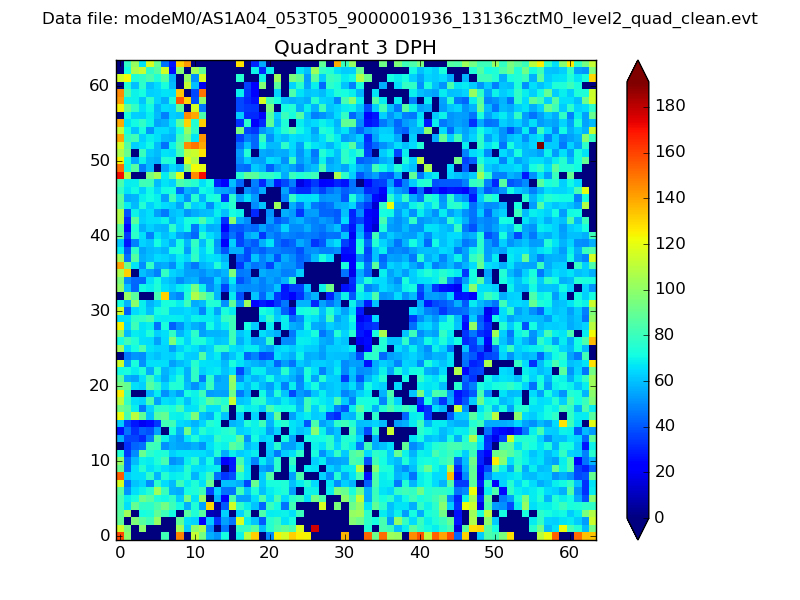 |
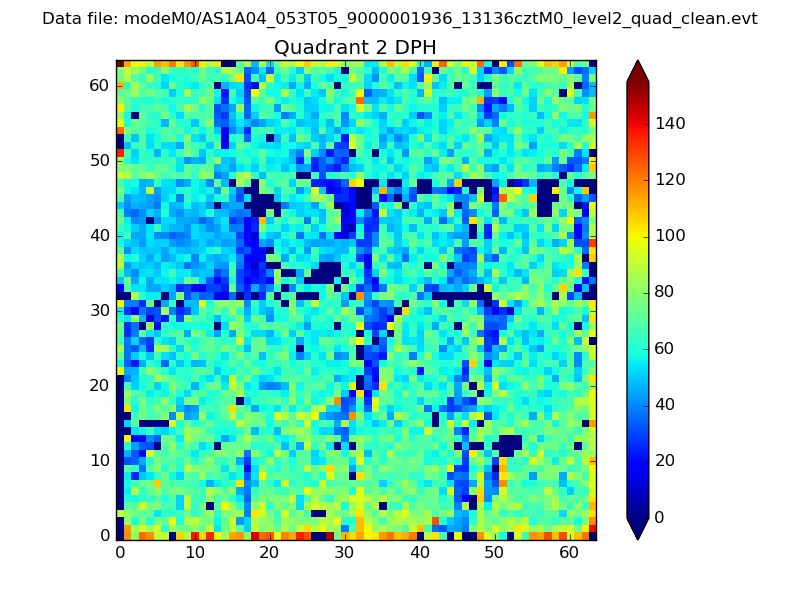 |
Quadrant C |
| Plot type | Count rate plots | Images |
|---|---|---|
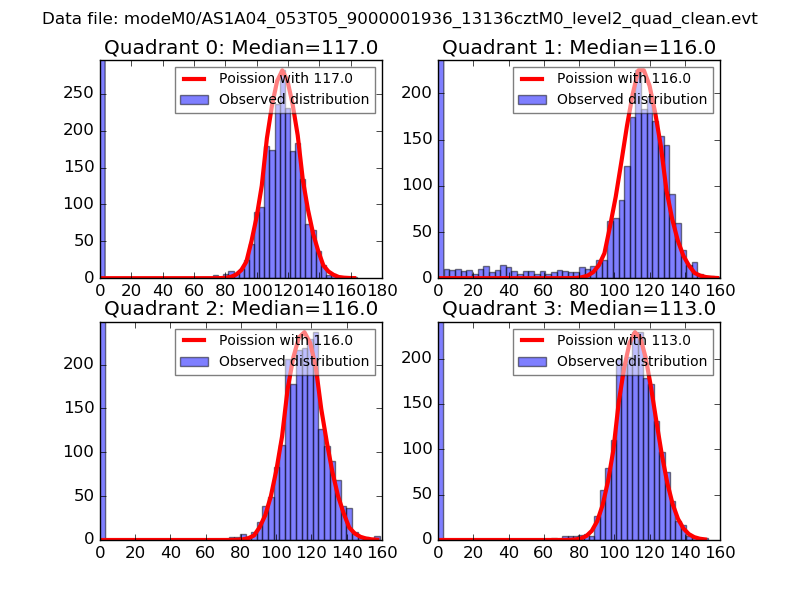
| Comparison with Poisson distribution Blue bars denote a histogram of data divided into 1 sec bins. Red curve is a Poisson curve with rate = median count rate of data. |
 |
 |
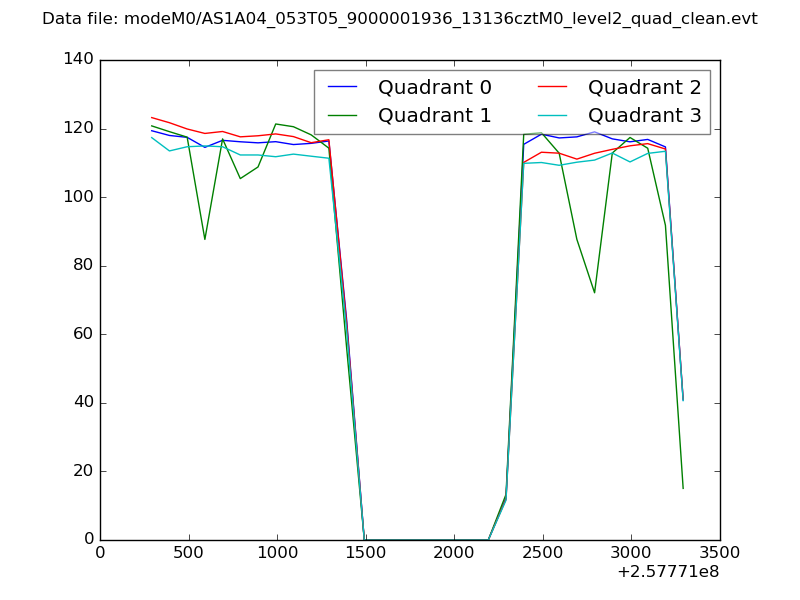
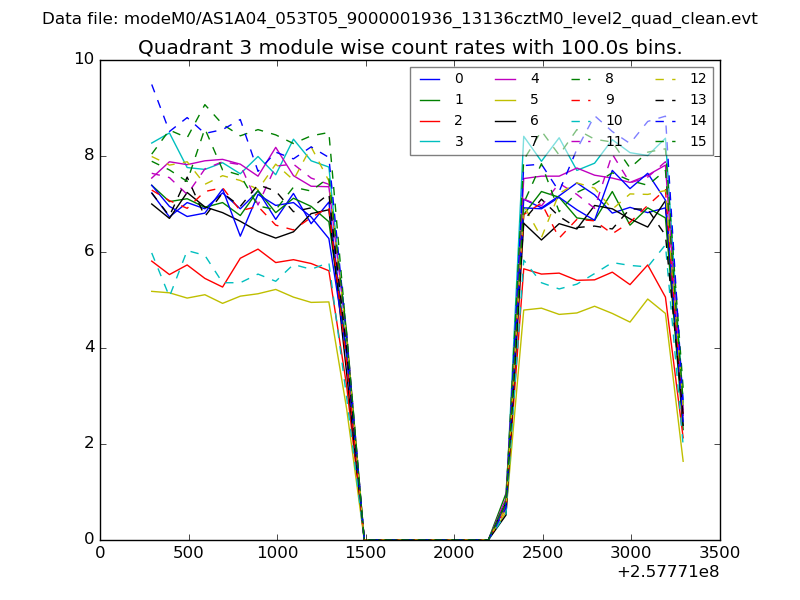
| Quadrant-wise count rates Data is divided into 100 sec bins |
 |
|
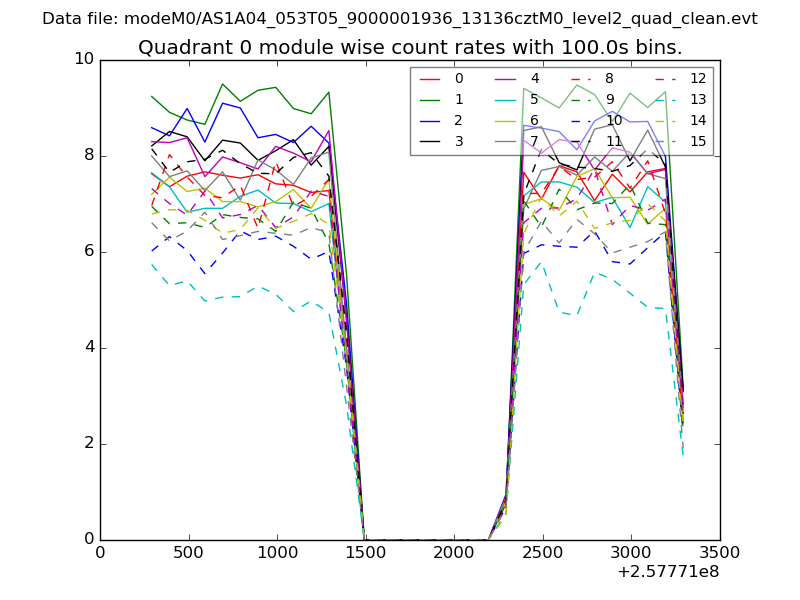
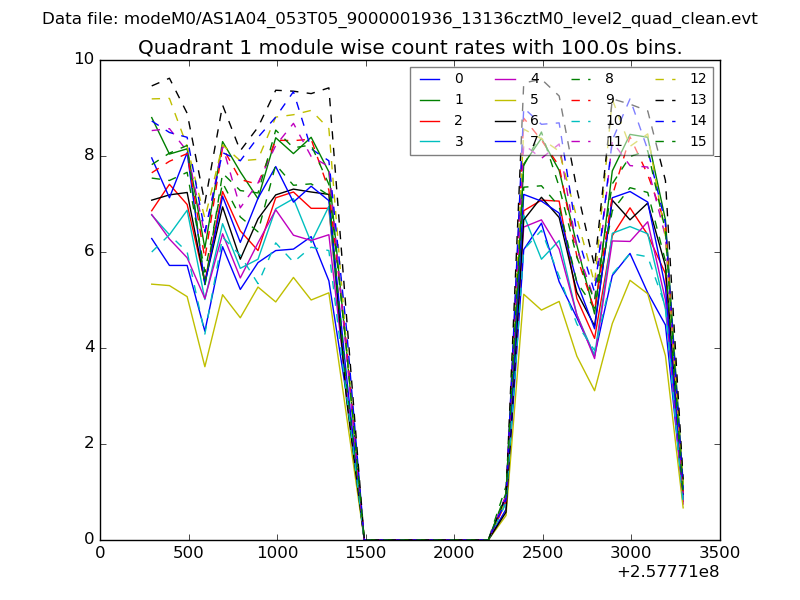
| Module-wise count rates for Quadrant A Data is divided into 100 sec bins |
 |
 |
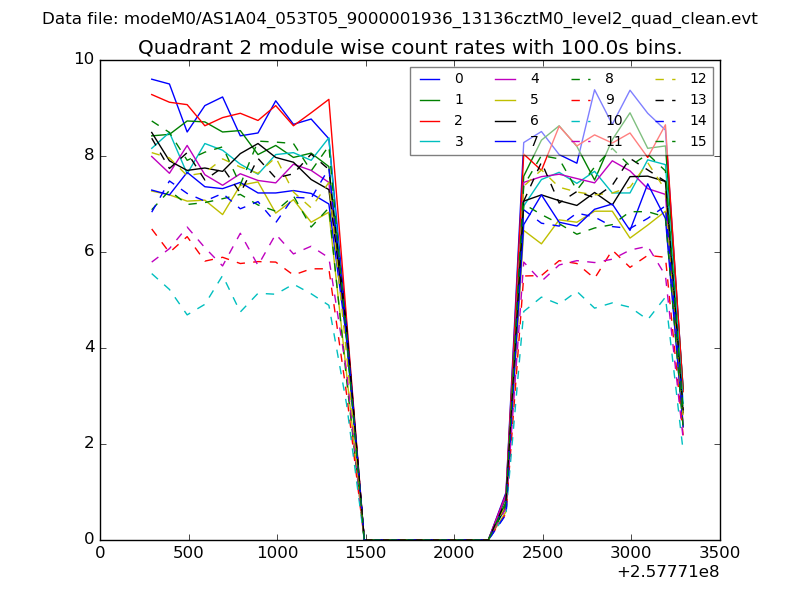
| Module-wise count rates for Quadrant B Data is divided into 100 sec bins |
 |
 |
| Module-wise count rates for Quadrant C Data is divided into 100 sec bins |
 |
 |
| Module-wise count rates for Quadrant D Data is divided into 100 sec bins |
 |
 |
| Parameter | Plot |
|---|---|
| CZT HV Monitor | 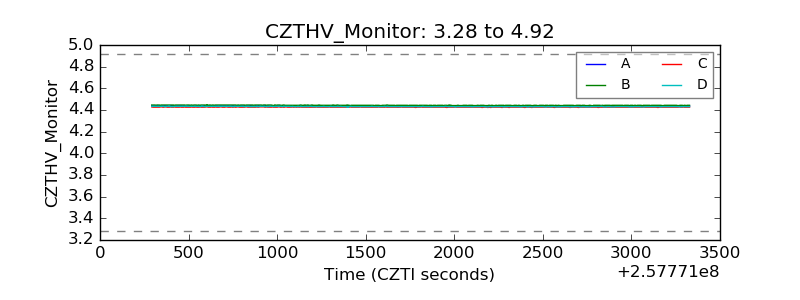 |
| D_VDD | 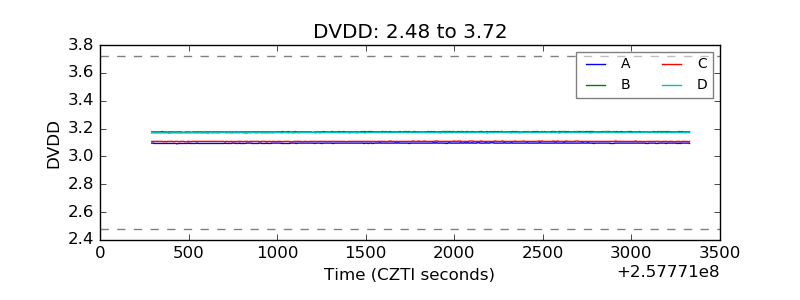 |
| Temperature 1 | 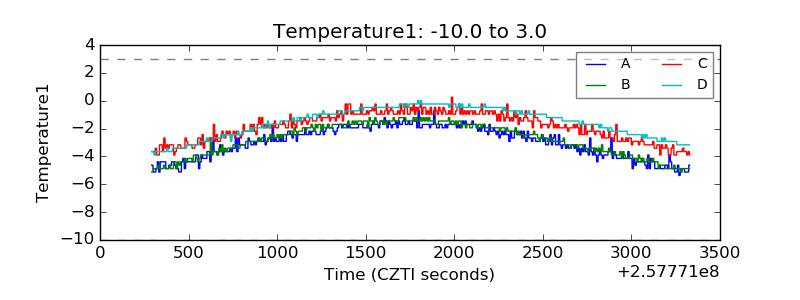 |
| Veto HV Monitor | 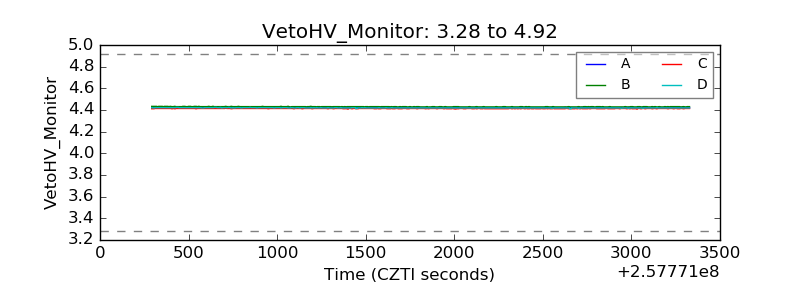 |
| Veto LLD | 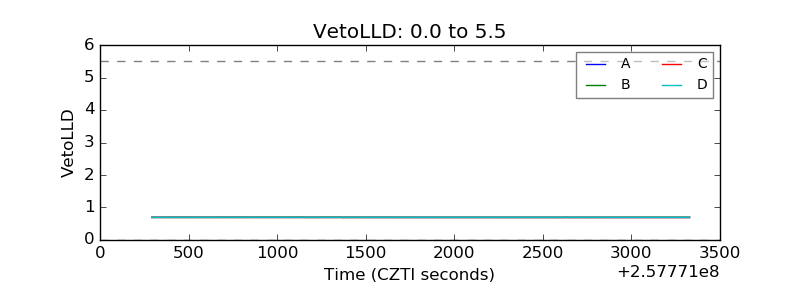 |
| Alpha Counter | 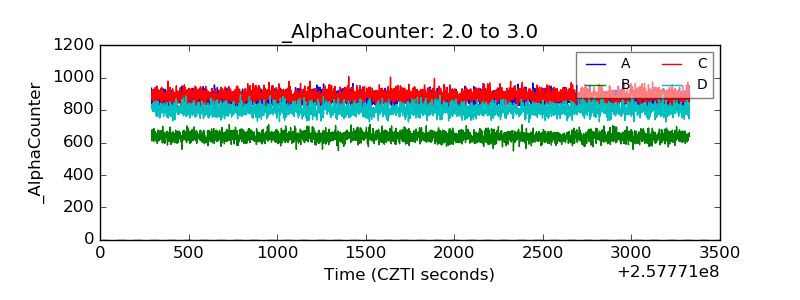 |
| _CPM_Rate | 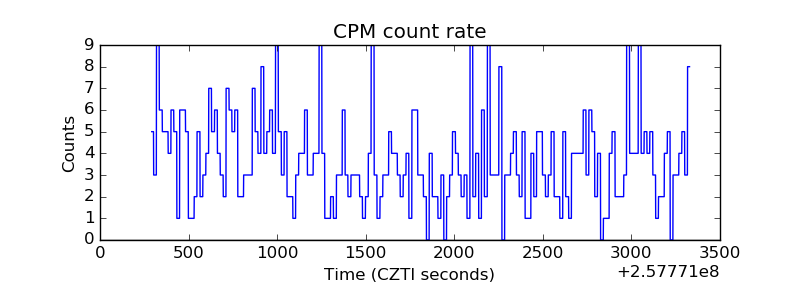 |
| CZT Counter | 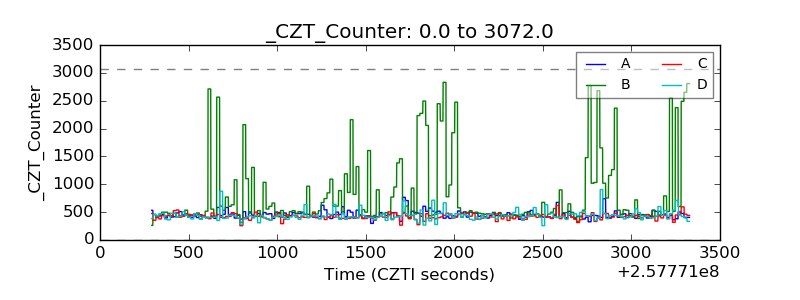 |
| +2.5 Volts monitor |  |
| +5 Volts monitor |  |
| _ROLL_ROT | 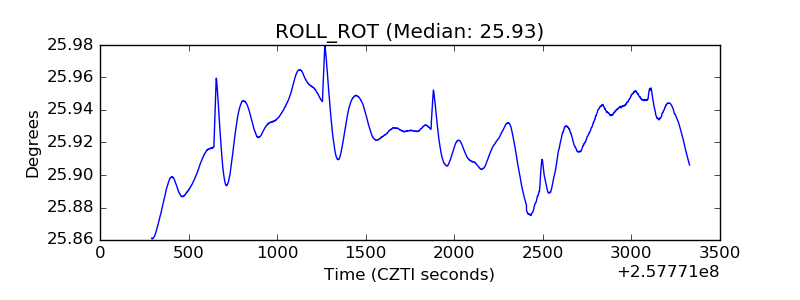 |
| _Roll_DEC | 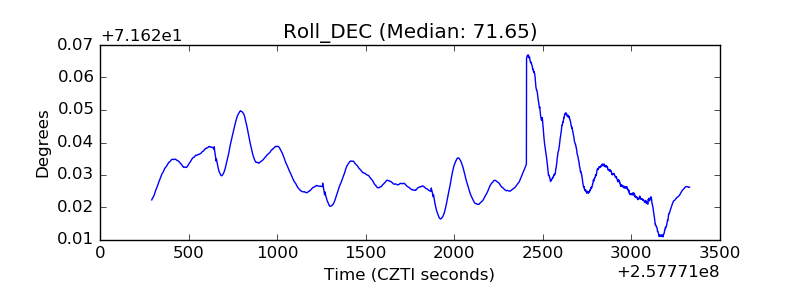 |
| _Roll_RA | 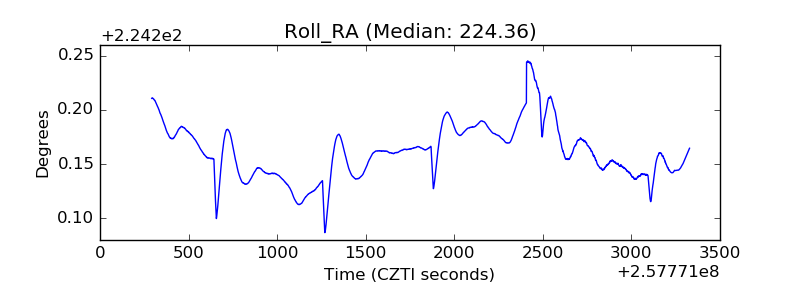 |
| Veto Counter | 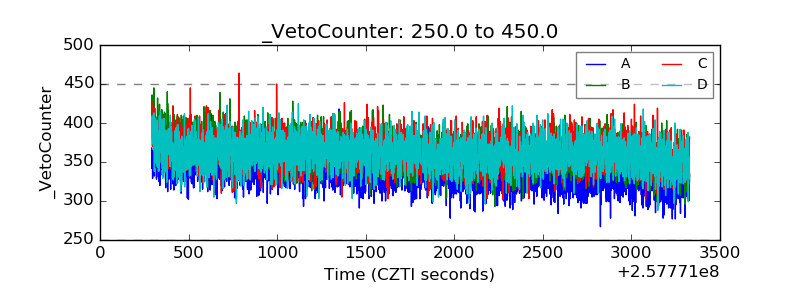 |