| Param | Original file | Final file |
|---|---|---|
| Filename | modeM0/AS1G08_061T01_9000001938cztM0_level2.fits | modeM0/AS1G08_061T01_9000001938cztM0_level2_quad_clean.evt |
| Size (bytes) | 184,348,800 | 188,441,280 |
| Size | 175.8 MB | 179.7 MB |
| Events in quadrant A | 1,127,344 | 1,145,385 |
| Events in quadrant B | 977,044 | 1,072,954 |
| Events in quadrant C | 1,124,536 | 1,117,136 |
| Events in quadrant D | 940,518 | 959,265 |
| Mode M0 | |||
|---|---|---|---|
| Quadrant | BADHDUFLAG | Total packets | Discarded packets |
| A | 0 | 43226 | 0 |
| B | 0 | 65011 | 0 |
| C | 0 | 41825 | 0 |
| D | 0 | 57366 | 0 |
| Mode M9 | |||
|---|---|---|---|
| Quadrant | BADHDUFLAG | Total packets | Discarded packets |
| A | 0 | 28 | 0 |
| B | 0 | 28 | 0 |
| C | 0 | 28 | 0 |
| D | 0 | 28 | 0 |
| Mode SS | |||
|---|---|---|---|
| Quadrant | BADHDUFLAG | Total packets | Discarded packets |
| A | 0 | 416 | 0 |
| B | 0 | 416 | 0 |
| C | 0 | 416 | 0 |
| D | 0 | 416 | 0 |
| Quadrant | Total seconds | Saturated seconds | Saturation percentage |
|---|---|---|---|
| A | 20495 | 256 | 1.249085% |
| B | 20495 | 3395 | 16.565016% |
| C | 20495 | 202 | 0.985606% |
| D | 20495 | 1456 | 7.104172% |
Noise dominated data is calculated using 1-second bins in cleaned event files. If a bin has >2000 counts, and if more than 50% of those come from <1% of pixels, then it is considered to be noise-dominated and hence unusable.
| Quadrant | # 1 sec bins | Bins with >0 counts | Bins with >2000 counts | High rate bins dominated by noise | Noise dominated (total time) | Noise dominated (detector-on time) | Marked lightcurve |
|---|---|---|---|---|---|---|---|
| A | 23295 | 20495 | 0 | 0 | 0.00% | 0.00% |  |
| B | 23295 | 20145 | 0 | 0 | 0.00% | 0.00% |  |
| C | 23295 | 20495 | 0 | 0 | 0.00% | 0.00% | 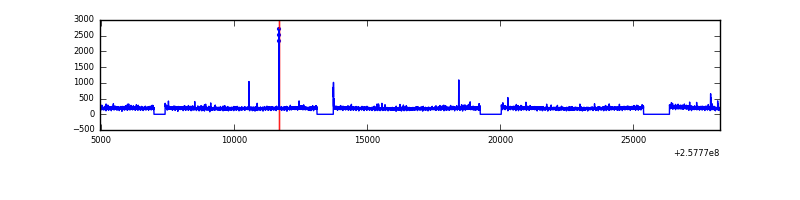 |
| D | 23295 | 20487 | 0 | 0 | 0.00% | 0.00% |  |
Top three noisy pixels from each quadrant. If the there are fewer than three noisy pixels in the level2.evt file, extra rows are filled as -1
| Pixel properties | Quadrant properties | ||||||
|---|---|---|---|---|---|---|---|
| Quadrant | DetID | PixID | Counts | Sigma | Mean | Median | Sigma |
| A | 14 | 188 | 1120 | 11.21 | 292 | 273 | 75.6 |
| A | 0 | 29 | 1057 | 10.38 | 292 | 273 | 75.6 |
| A | 14 | 204 | 968 | 9.2 | 292 | 273 | 75.6 |
| B | 2 | 9 | 836 | 10.64 | 257 | 243 | 55.7 |
| B | 14 | 254 | 701 | 8.22 | 257 | 243 | 55.7 |
| B | 3 | 17 | 698 | 8.16 | 257 | 243 | 55.7 |
| C | 12 | 241 | 773 | 6.28 | 297 | 273 | 79.6 |
| C | 3 | 158 | 773 | 6.28 | 297 | 273 | 79.6 |
| C | 3 | 126 | 771 | 6.26 | 297 | 273 | 79.6 |
| D | 7 | 5 | 681 | 5.96 | 268 | 242 | 73.7 |
| D | 6 | 38 | 677 | 5.9 | 268 | 242 | 73.7 |
| D | 6 | 231 | 674 | 5.86 | 268 | 242 | 73.7 |
Histogram calculated using DETX and DETY for each event in the final _common_clean file
| Quadrant A | 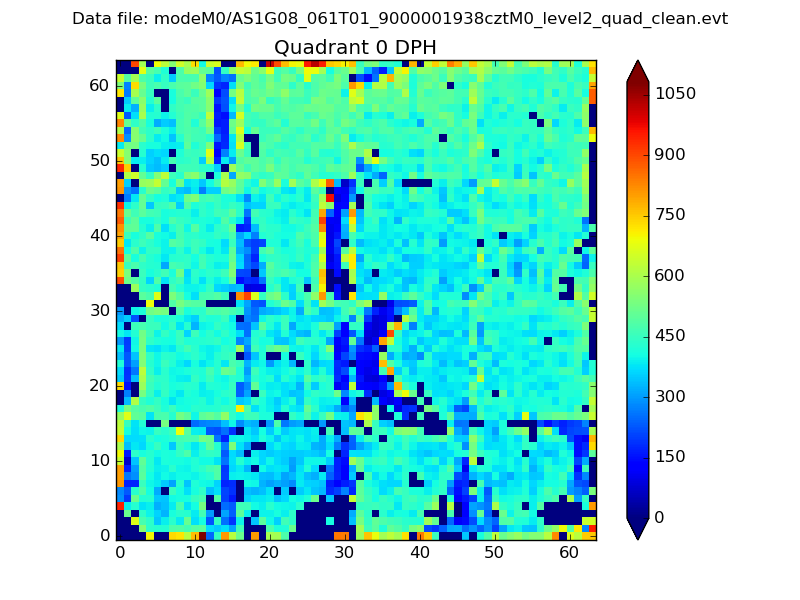 |
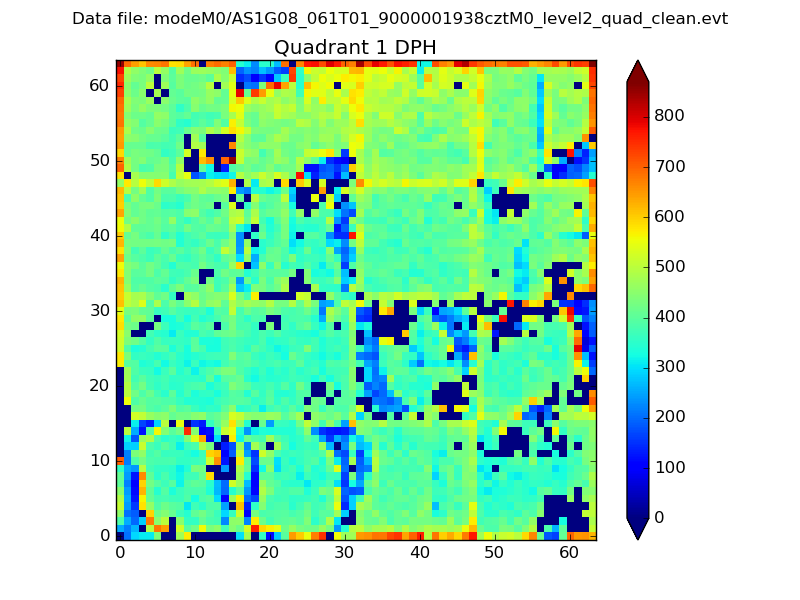 |
Quadrant B |
|---|---|---|---|
| Quadrant D | 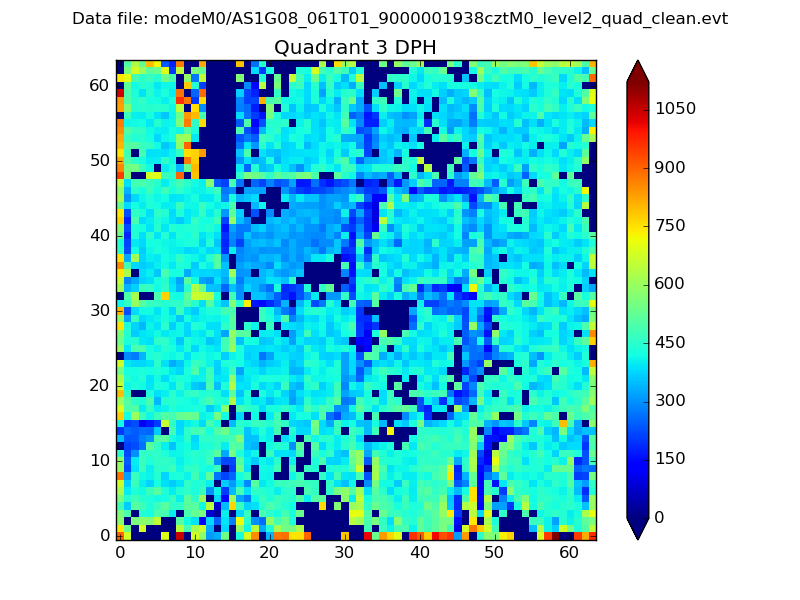 |
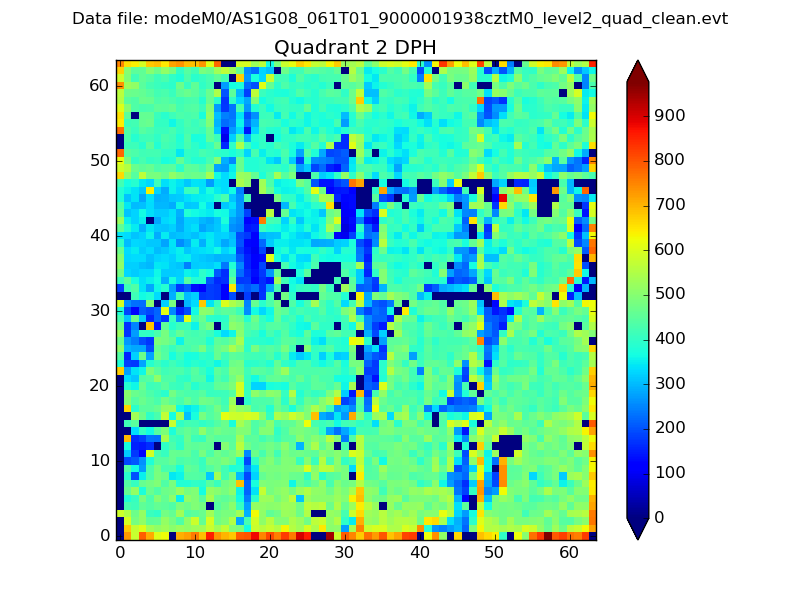 |
Quadrant C |
| Plot type | Count rate plots | Images |
|---|---|---|
| Comparison with Poisson distribution Blue bars denote a histogram of data divided into 1 sec bins. Red curve is a Poisson curve with rate = median count rate of data. |
 |
 |
| Quadrant-wise count rates Data is divided into 100 sec bins |
 |
|
| Module-wise count rates for Quadrant A Data is divided into 100 sec bins |
 |
 |
| Module-wise count rates for Quadrant B Data is divided into 100 sec bins |
 |
 |
| Module-wise count rates for Quadrant C Data is divided into 100 sec bins |
 |
 |
| Module-wise count rates for Quadrant D Data is divided into 100 sec bins |
 |
 |
| Parameter | Plot |
|---|---|
| CZT HV Monitor |  |
| D_VDD | 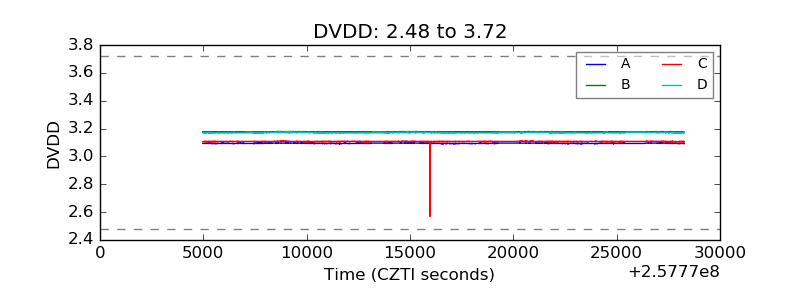 |
| Temperature 1 | 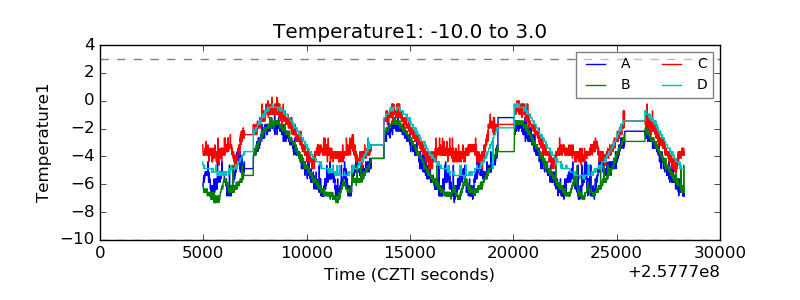 |
| Veto HV Monitor |  |
| Veto LLD |  |
| Alpha Counter | 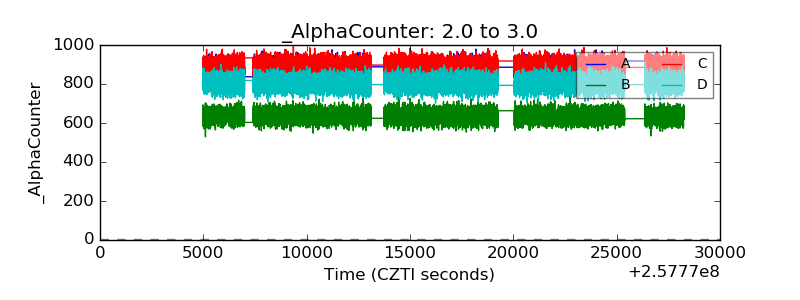 |
| _CPM_Rate |  |
| CZT Counter |  |
| +2.5 Volts monitor | 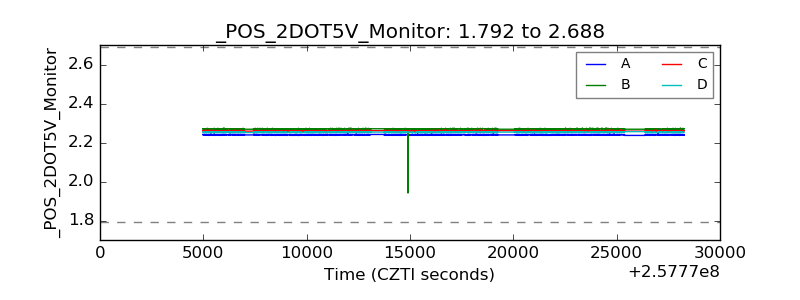 |
| +5 Volts monitor |  |
| _ROLL_ROT |  |
| _Roll_DEC |  |
| _Roll_RA |  |
| Veto Counter | 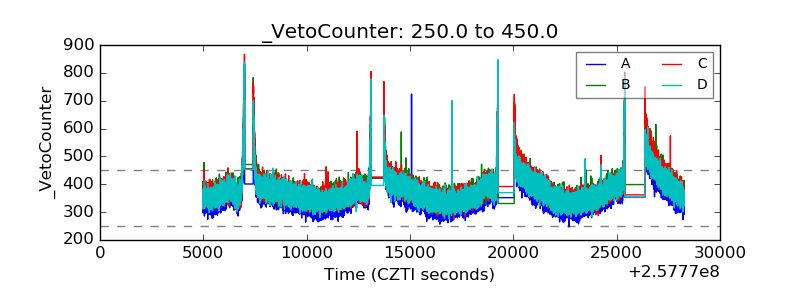 |