| Param | Original file | Final file |
|---|---|---|
| Filename | modeM0/AS1G08_061T01_9000001938_13137cztM0_level2.evt | modeM0/AS1G08_061T01_9000001938_13137cztM0_level2_quad_clean.evt |
| Size (bytes) | 626,541,120 | 75,300,480 |
| Size | 597.5 MB | 71.8 MB |
| Events in quadrant A | 3,366,974 | 463,165 |
| Events in quadrant B | 6,387,920 | 452,024 |
| Events in quadrant C | 3,102,555 | 472,486 |
| Events in quadrant D | 5,662,857 | 424,407 |
| Mode M0 | |||
|---|---|---|---|
| Quadrant | BADHDUFLAG | Total packets | Discarded packets |
| A | 0 | 14210 | 3 |
| B | 0 | 23551 | 2 |
| C | 0 | 13691 | 2 |
| D | 0 | 21411 | 2 |
| Mode M9 | |||
|---|---|---|---|
| Quadrant | BADHDUFLAG | Total packets | Discarded packets |
| A | 0 | 16 | 0 |
| B | 0 | 16 | 0 |
| C | 0 | 16 | 0 |
| D | 0 | 17 | 0 |
| Mode SS | |||
|---|---|---|---|
| Quadrant | BADHDUFLAG | Total packets | Discarded packets |
| A | 0 | 136 | 0 |
| B | 0 | 136 | 0 |
| C | 0 | 136 | 0 |
| D | 0 | 136 | 0 |
| Quadrant | Total seconds | Saturated seconds | Saturation percentage |
|---|---|---|---|
| A | 6710 | 56 | 0.834575% |
| B | 6710 | 1318 | 19.642325% |
| C | 6710 | 33 | 0.491803% |
| D | 6710 | 660 | 9.836066% |
Noise dominated data is calculated using 1-second bins in cleaned event files. If a bin has >2000 counts, and if more than 50% of those come from <1% of pixels, then it is considered to be noise-dominated and hence unusable.
| Quadrant | # 1 sec bins | Bins with >0 counts | Bins with >2000 counts | High rate bins dominated by noise | Noise dominated (total time) | Noise dominated (detector-on time) | Marked lightcurve |
|---|---|---|---|---|---|---|---|
| A | 7686 | 6712 | 11 | 11 | 0.14% | 0.16% | 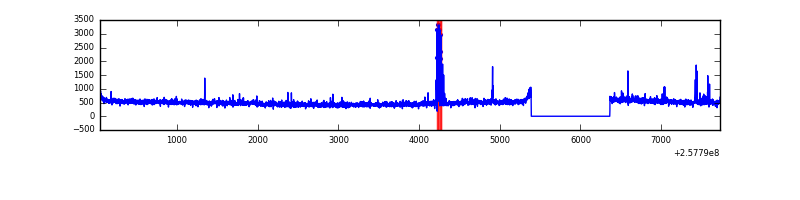 |
| B | 7686 | 6712 | 853 | 853 | 11.10% | 12.71% | 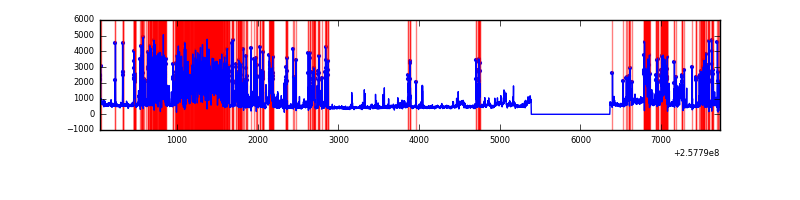 |
| C | 7686 | 6712 | 0 | 0 | 0.00% | 0.00% | 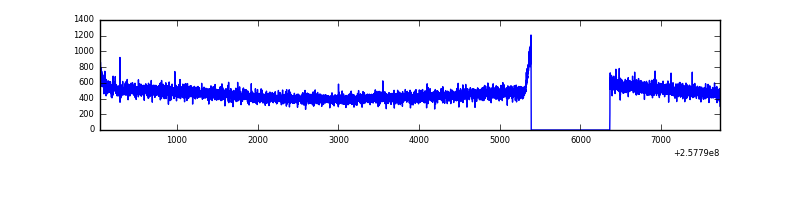 |
| D | 7686 | 6712 | 582 | 582 | 7.57% | 8.67% | 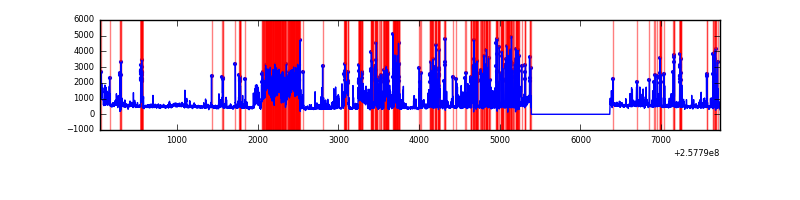 |
Top three noisy pixels from each quadrant. If the there are fewer than three noisy pixels in the level2.evt file, extra rows are filled as -1
| Pixel properties | Quadrant properties | ||||||
|---|---|---|---|---|---|---|---|
| Quadrant | DetID | PixID | Counts | Sigma | Mean | Median | Sigma |
| A | 13 | 248 | 72443 | 435.76 | 810 | 794 | 164.4 |
| A | 12 | 189 | 63183 | 379.45 | 810 | 794 | 164.4 |
| A | 1 | 162 | 33418 | 198.42 | 810 | 794 | 164.4 |
| B | 4 | 239 | 1801772 | 13040.14 | 722 | 704 | 138.1 |
| B | 0 | 85 | 1465855 | 10608.02 | 722 | 704 | 138.1 |
| B | 3 | 64 | 162308 | 1170.05 | 722 | 704 | 138.1 |
| C | 13 | 61 | 5880 | 27.43 | 795 | 796 | 185.4 |
| C | 15 | 208 | 1923 | 6.08 | 795 | 796 | 185.4 |
| C | 3 | 202 | 1895 | 5.93 | 795 | 796 | 185.4 |
| D | 1 | 52 | 2594458 | 14104.4 | 767 | 745 | 183.9 |
| D | 13 | 172 | 80456 | 433.46 | 767 | 745 | 183.9 |
| D | 2 | 234 | 34671 | 184.49 | 767 | 745 | 183.9 |
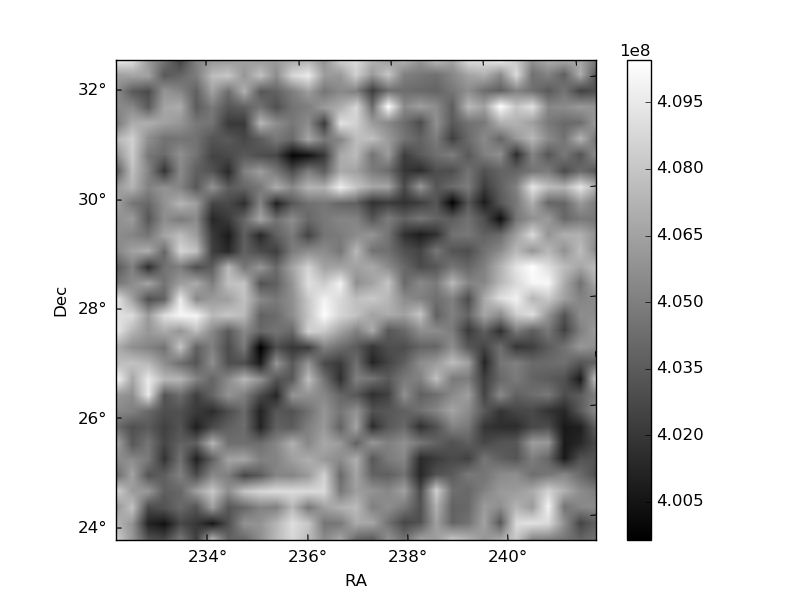
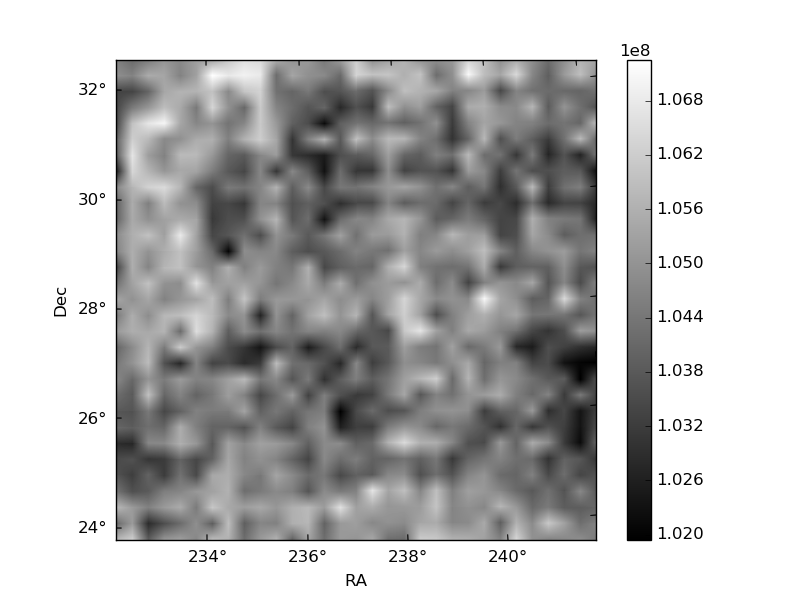
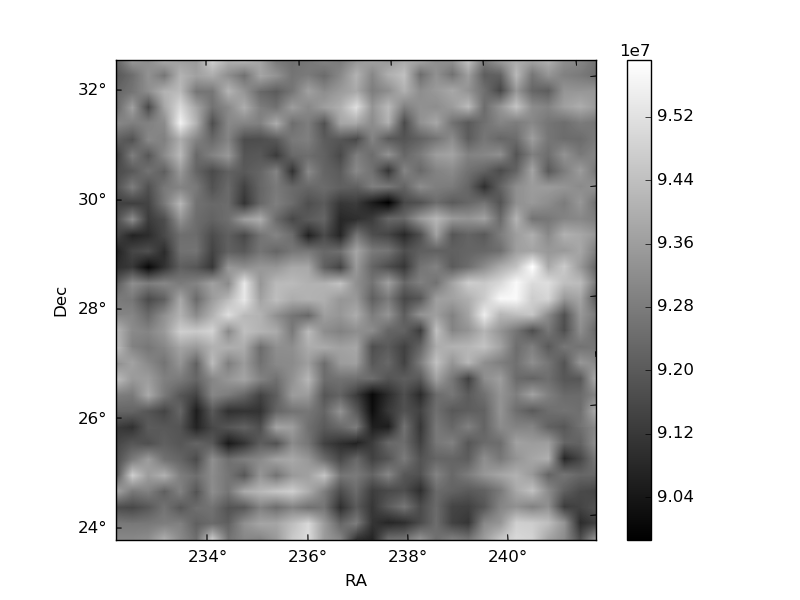
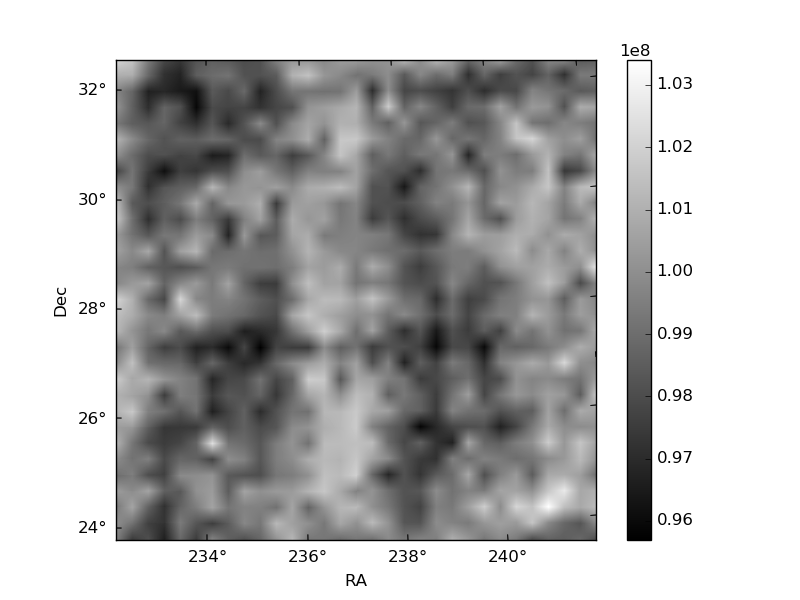
Histogram calculated using DETX and DETY for each event in the final _common_clean file
| Quadrant A | 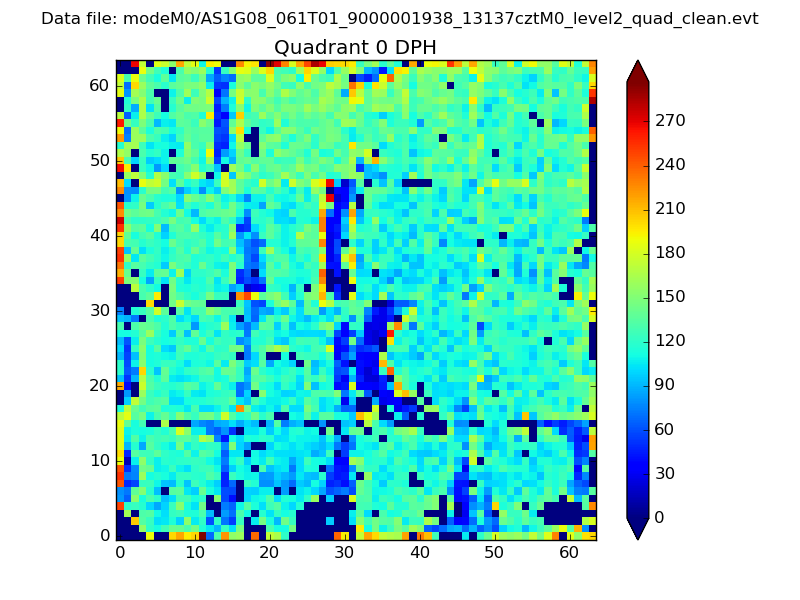 |
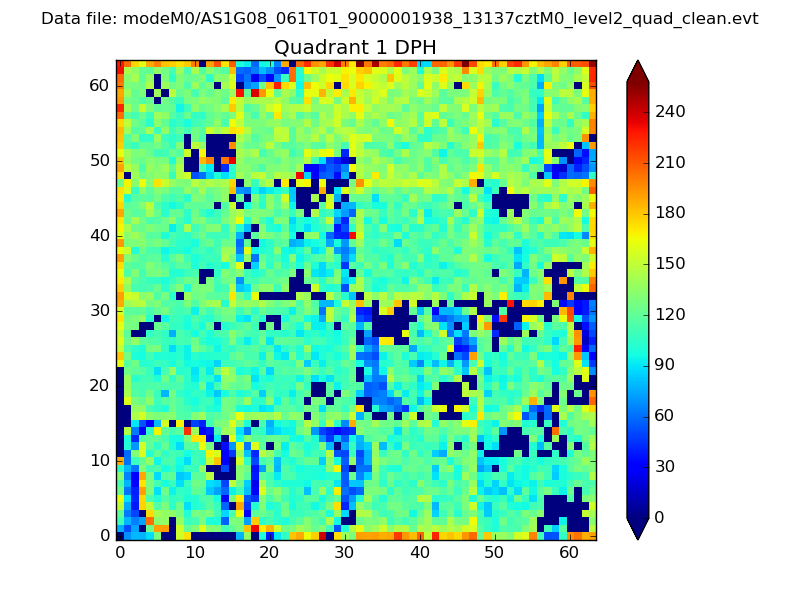 |
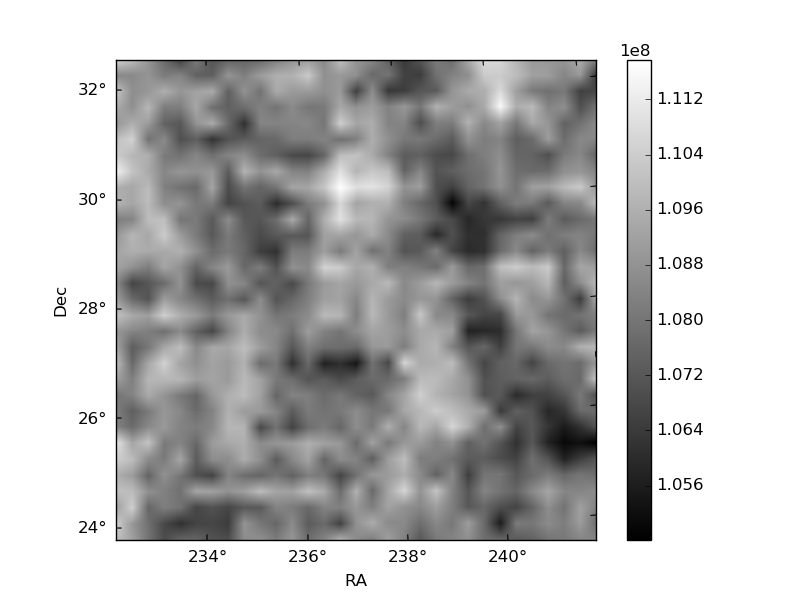
Quadrant B |
|---|---|---|---|
| Quadrant D | 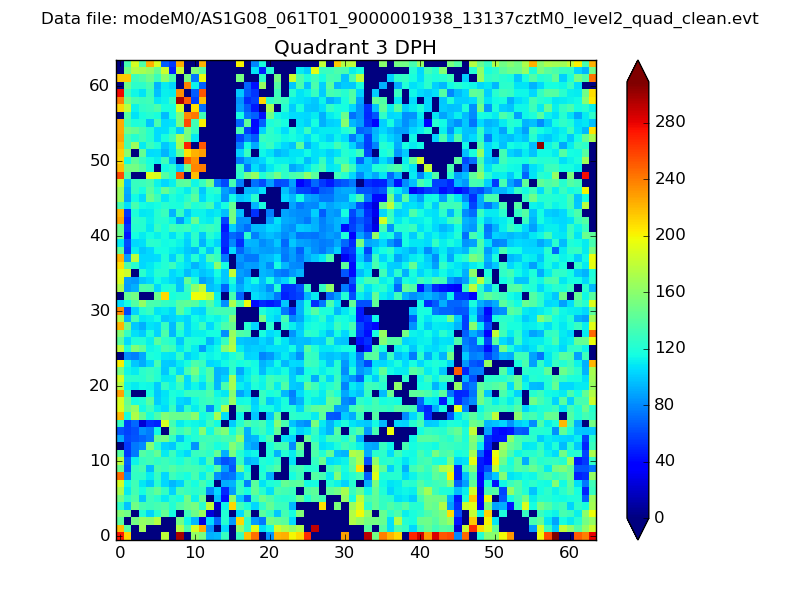 |
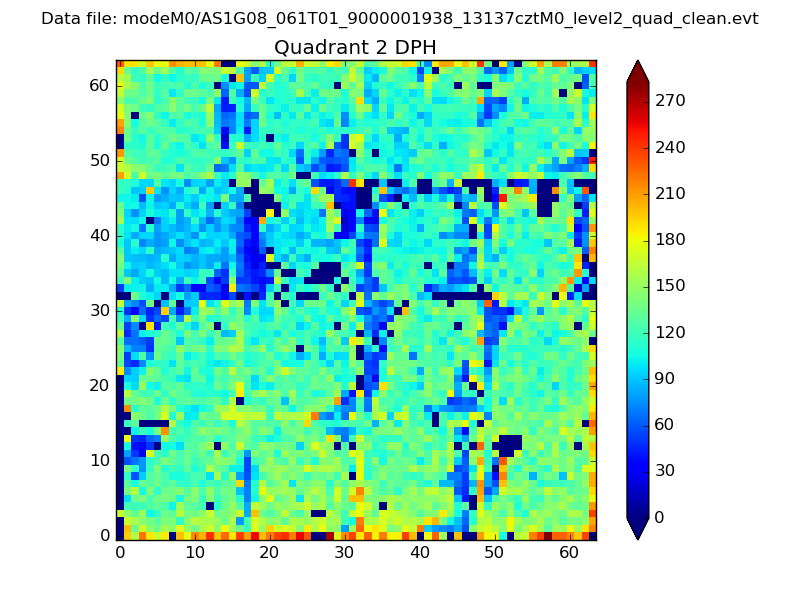 |
Quadrant C |
| Plot type | Count rate plots | Images |
|---|---|---|
| Comparison with Poisson distribution Blue bars denote a histogram of data divided into 1 sec bins. Red curve is a Poisson curve with rate = median count rate of data. |
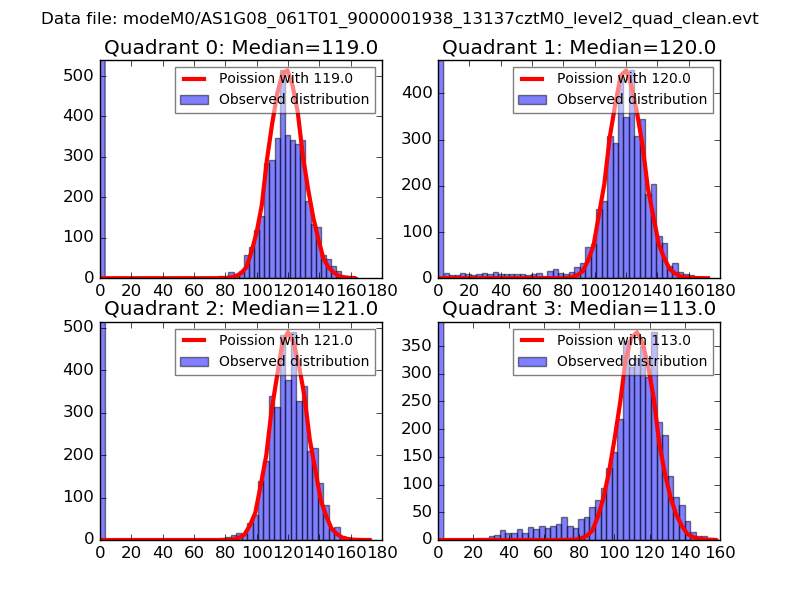 |
 |
| Quadrant-wise count rates Data is divided into 100 sec bins |
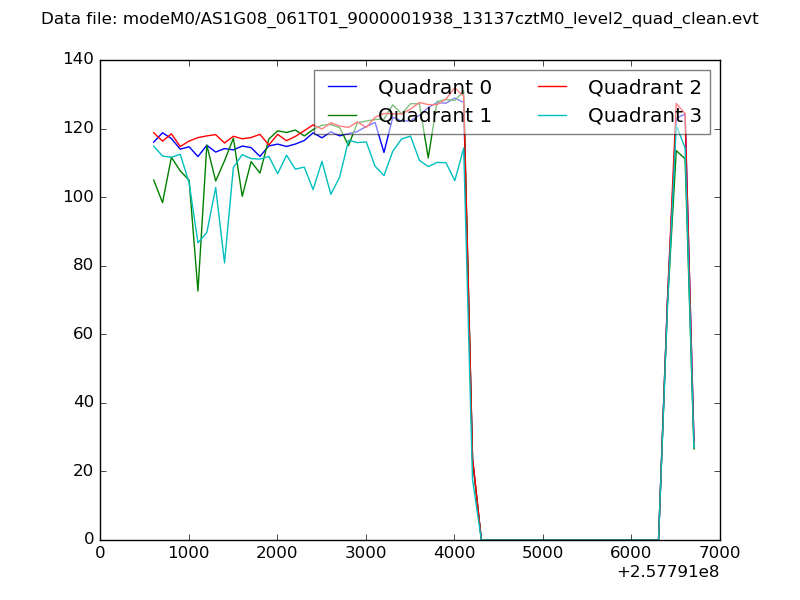 |
|
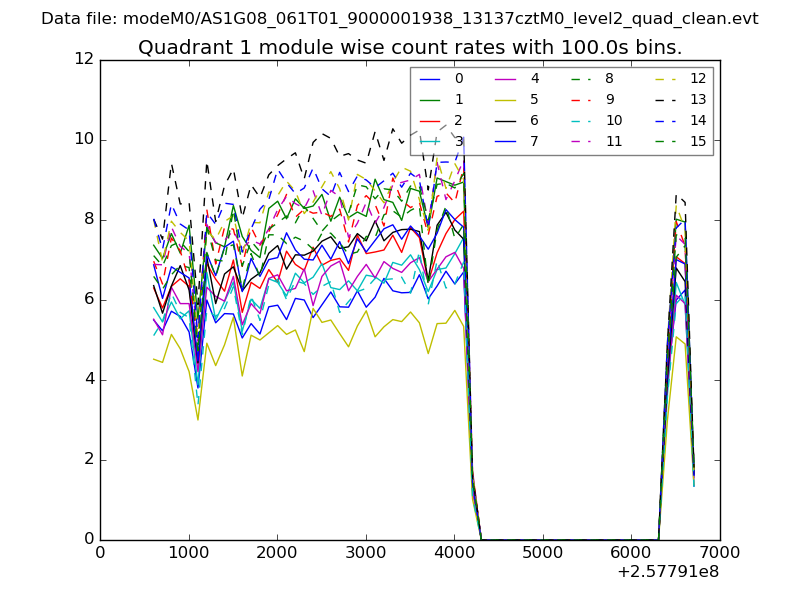
| Module-wise count rates for Quadrant A Data is divided into 100 sec bins |
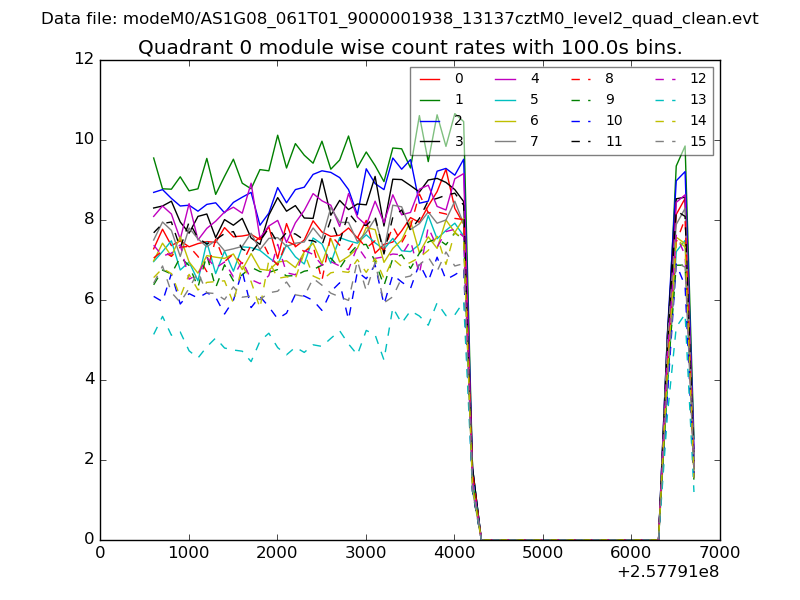 |
 |
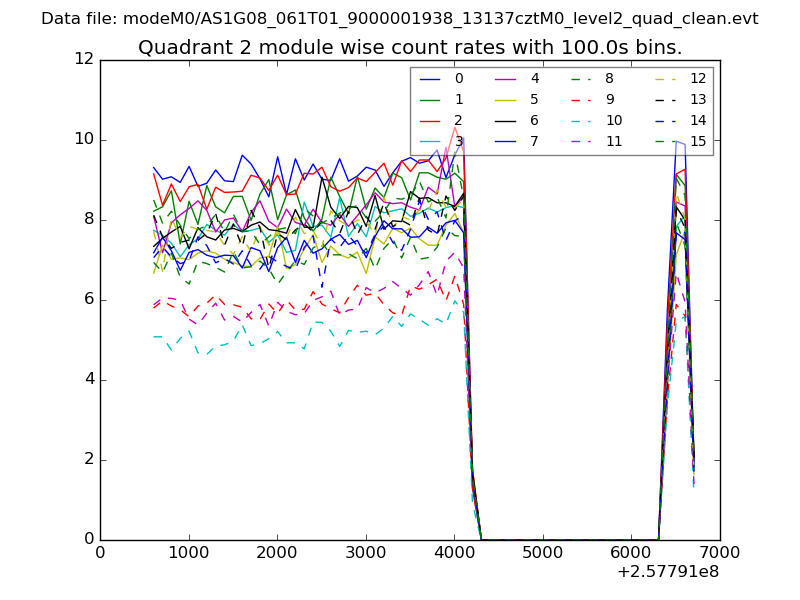
| Module-wise count rates for Quadrant B Data is divided into 100 sec bins |
 |
 |
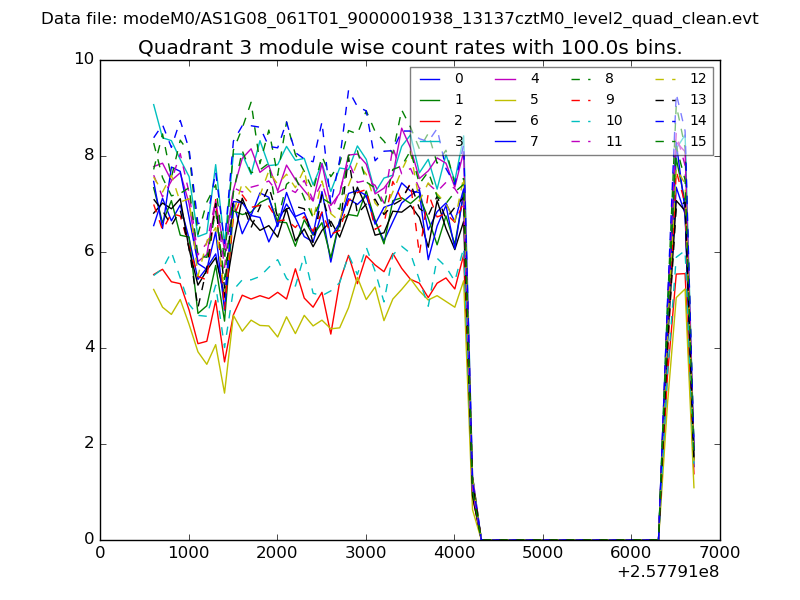
| Module-wise count rates for Quadrant C Data is divided into 100 sec bins |
 |
 |
| Module-wise count rates for Quadrant D Data is divided into 100 sec bins |
 |
 |
| Parameter | Plot |
|---|---|
| CZT HV Monitor | 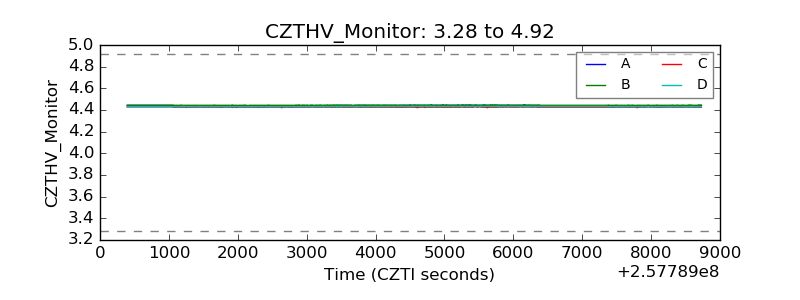 |
| D_VDD | 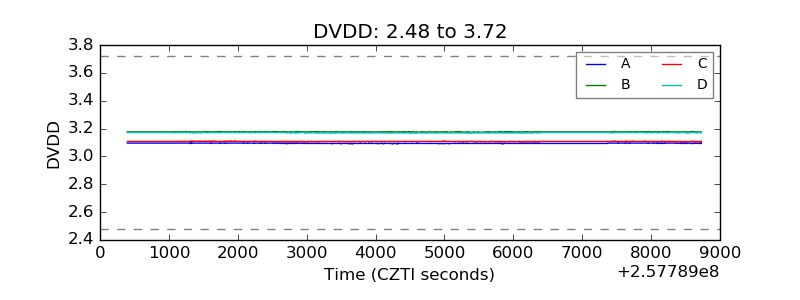 |
| Temperature 1 |  |
| Veto HV Monitor | 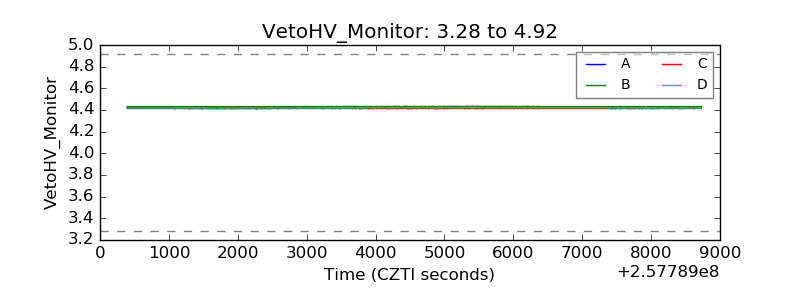 |
| Veto LLD | 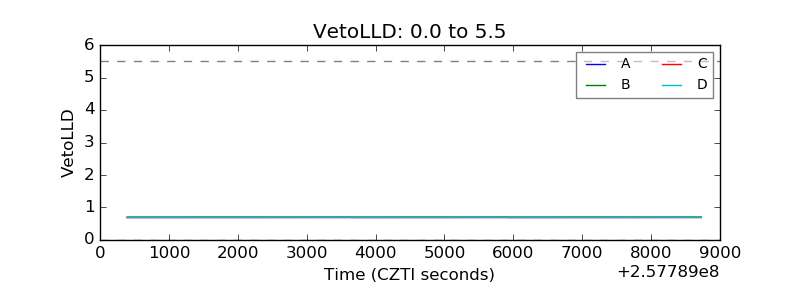 |
| Alpha Counter | 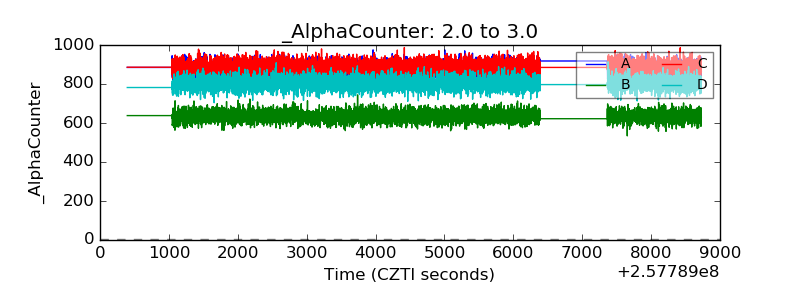 |
| _CPM_Rate | 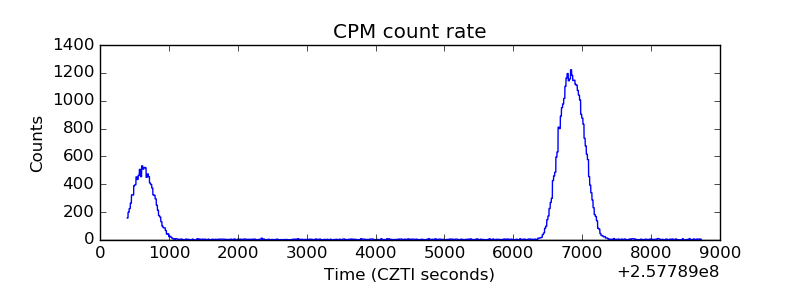 |
| CZT Counter | 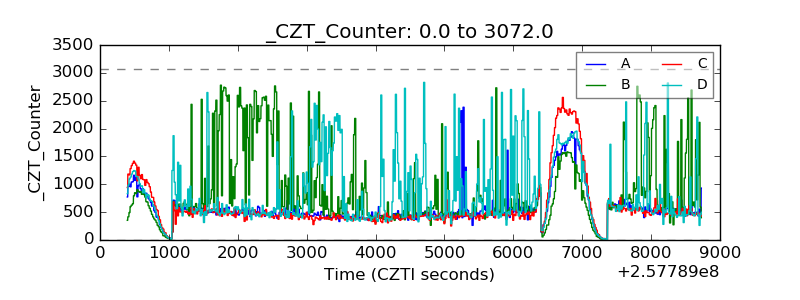 |
| +2.5 Volts monitor |  |
| +5 Volts monitor | 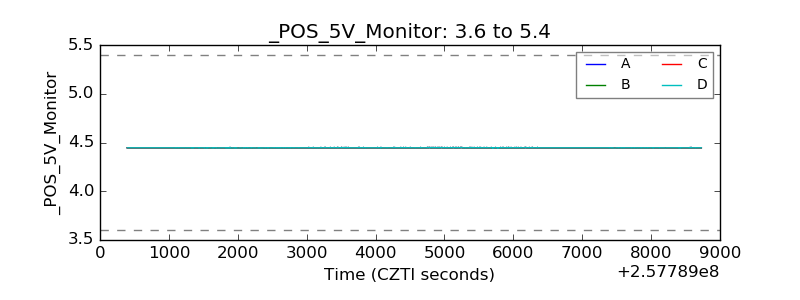 |
| _ROLL_ROT | 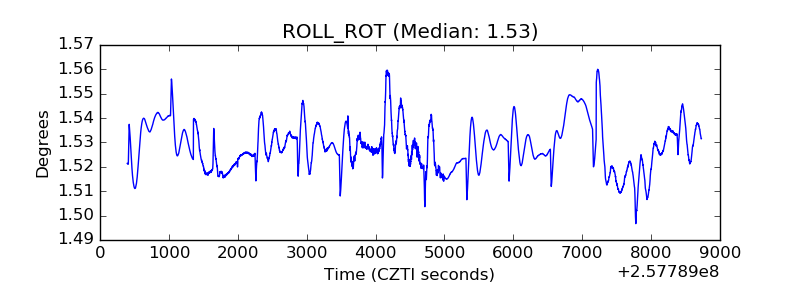 |
| _Roll_DEC | 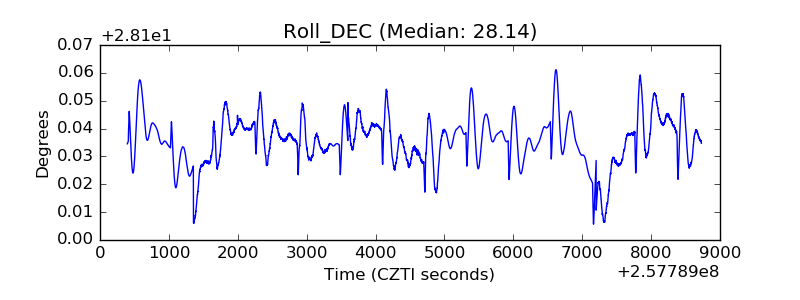 |
| _Roll_RA | 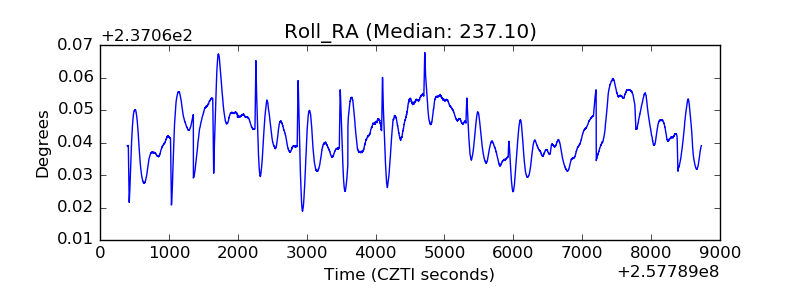 |
| Veto Counter | 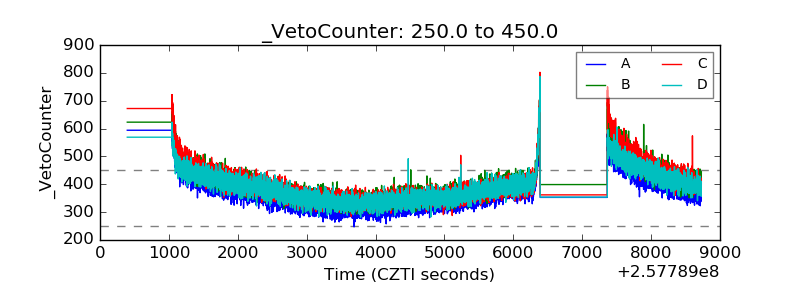 |