| Param | Original file | Final file |
|---|---|---|
| Filename | modeM0/AS1G08_061T01_9000001938_13138cztM0_level2.evt | modeM0/AS1G08_061T01_9000001938_13138cztM0_level2_quad_clean.evt |
| Size (bytes) | 207,011,520 | 17,475,840 |
| Size | 197.4 MB | 16.7 MB |
| Events in quadrant A | 1,112,390 | 101,222 |
| Events in quadrant B | 1,995,093 | 92,184 |
| Events in quadrant C | 1,050,249 | 103,419 |
| Events in quadrant D | 1,968,085 | 80,642 |
| Mode M0 | |||
|---|---|---|---|
| Quadrant | BADHDUFLAG | Total packets | Discarded packets |
| A | 0 | 4582 | 1 |
| B | 0 | 7342 | 1 |
| C | 0 | 4374 | 1 |
| D | 0 | 7229 | 1 |
| Mode M9 | |||
|---|---|---|---|
| Quadrant | BADHDUFLAG | Total packets | Discarded packets |
| A | 0 | 10 | 0 |
| B | 0 | 10 | 0 |
| C | 0 | 10 | 0 |
| D | 0 | 10 | 0 |
| Mode SS | |||
|---|---|---|---|
| Quadrant | BADHDUFLAG | Total packets | Discarded packets |
| A | 0 | 42 | 0 |
| B | 0 | 42 | 0 |
| C | 0 | 42 | 0 |
| D | 0 | 42 | 0 |
| Quadrant | Total seconds | Saturated seconds | Saturation percentage |
|---|---|---|---|
| A | 2085 | 35 | 1.678657% |
| B | 2085 | 413 | 19.808153% |
| C | 2085 | 31 | 1.486811% |
| D | 2085 | 360 | 17.266187% |
Noise dominated data is calculated using 1-second bins in cleaned event files. If a bin has >2000 counts, and if more than 50% of those come from <1% of pixels, then it is considered to be noise-dominated and hence unusable.
| Quadrant | # 1 sec bins | Bins with >0 counts | Bins with >2000 counts | High rate bins dominated by noise | Noise dominated (total time) | Noise dominated (detector-on time) | Marked lightcurve |
|---|---|---|---|---|---|---|---|
| A | 3061 | 2087 | 0 | 0 | 0.00% | 0.00% | 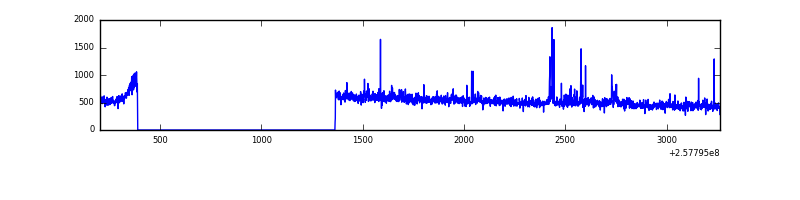 |
| B | 3061 | 2087 | 235 | 235 | 7.68% | 11.26% | 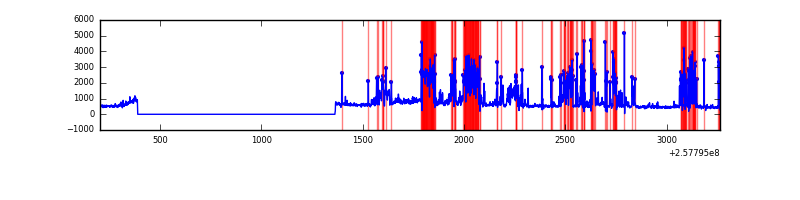 |
| C | 3061 | 2087 | 0 | 0 | 0.00% | 0.00% | 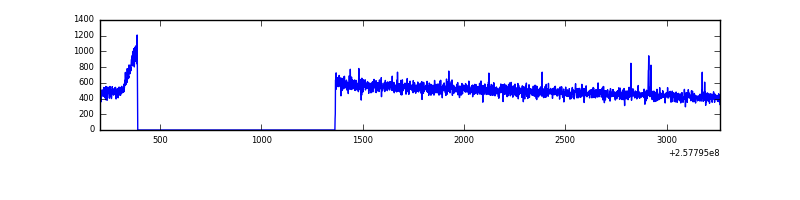 |
| D | 3061 | 2087 | 294 | 294 | 9.60% | 14.09% | 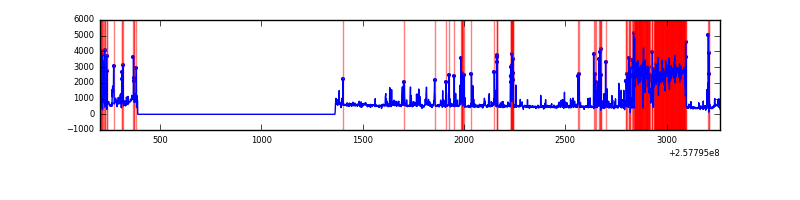 |
Top three noisy pixels from each quadrant. If the there are fewer than three noisy pixels in the level2.evt file, extra rows are filled as -1
| Pixel properties | Quadrant properties | ||||||
|---|---|---|---|---|---|---|---|
| Quadrant | DetID | PixID | Counts | Sigma | Mean | Median | Sigma |
| A | 12 | 189 | 16601 | 291.49 | 269 | 264 | 56.0 |
| A | 1 | 162 | 15927 | 279.46 | 269 | 264 | 56.0 |
| A | 4 | 2 | 15808 | 277.34 | 269 | 264 | 56.0 |
| B | 4 | 239 | 603909 | 12366.09 | 245 | 239 | 48.8 |
| B | 0 | 85 | 363775 | 7446.98 | 245 | 239 | 48.8 |
| B | 3 | 64 | 30366 | 617.15 | 245 | 239 | 48.8 |
| C | 15 | 208 | 4949 | 73.86 | 268 | 269 | 63.4 |
| C | 13 | 61 | 1965 | 26.77 | 268 | 269 | 63.4 |
| C | 8 | 222 | 692 | 6.68 | 268 | 269 | 63.4 |
| D | 1 | 52 | 1006837 | 16452.52 | 249 | 241 | 61.2 |
| D | 2 | 234 | 8908 | 141.66 | 249 | 241 | 61.2 |
| D | 14 | 35 | 8155 | 129.35 | 249 | 241 | 61.2 |
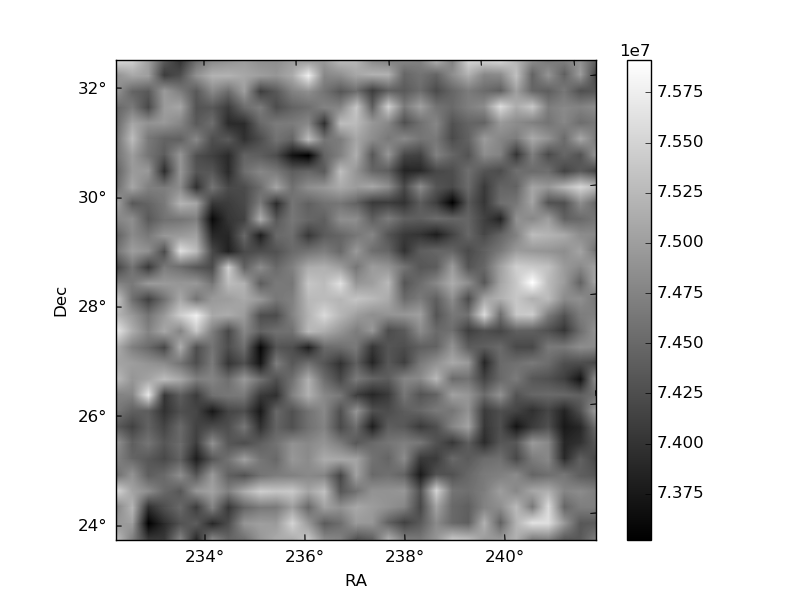
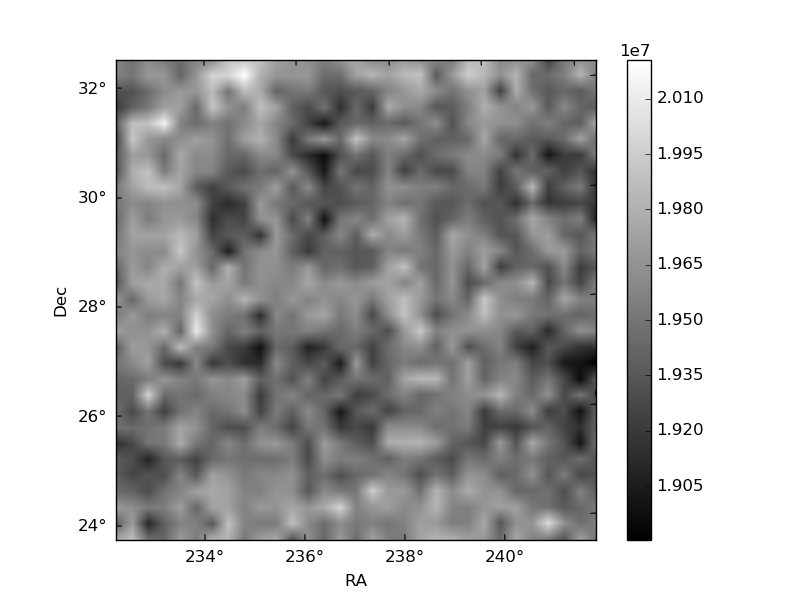
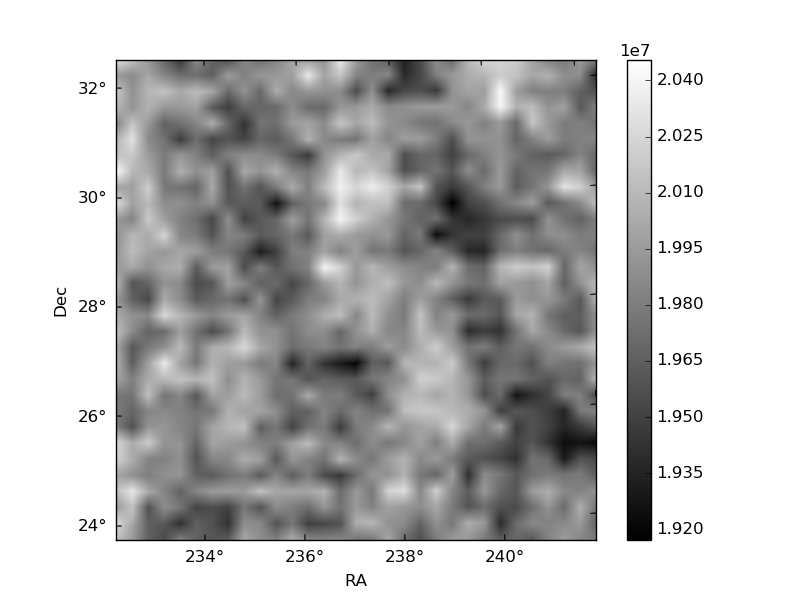
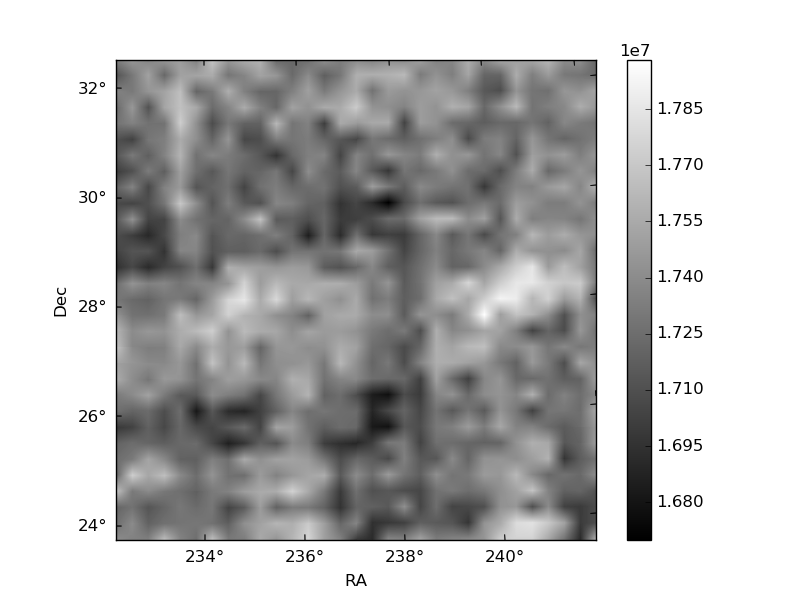
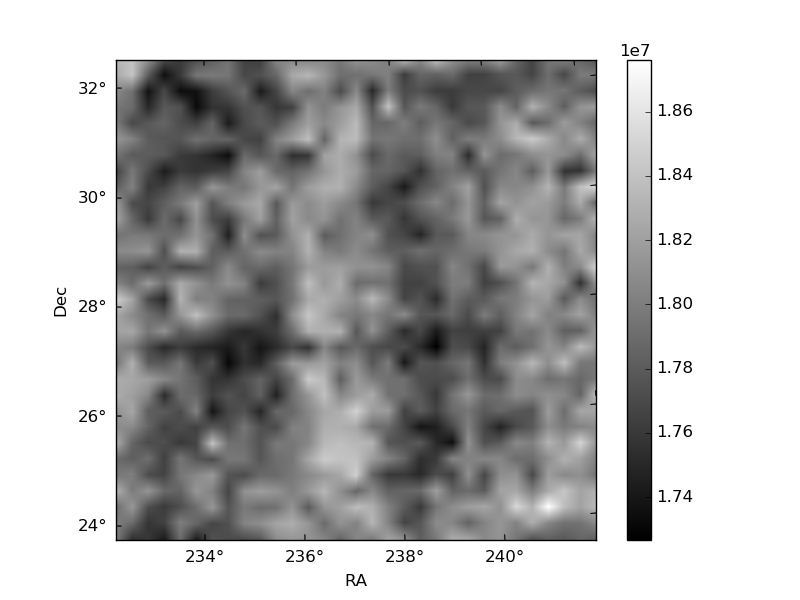
Histogram calculated using DETX and DETY for each event in the final _common_clean file
| Quadrant A | 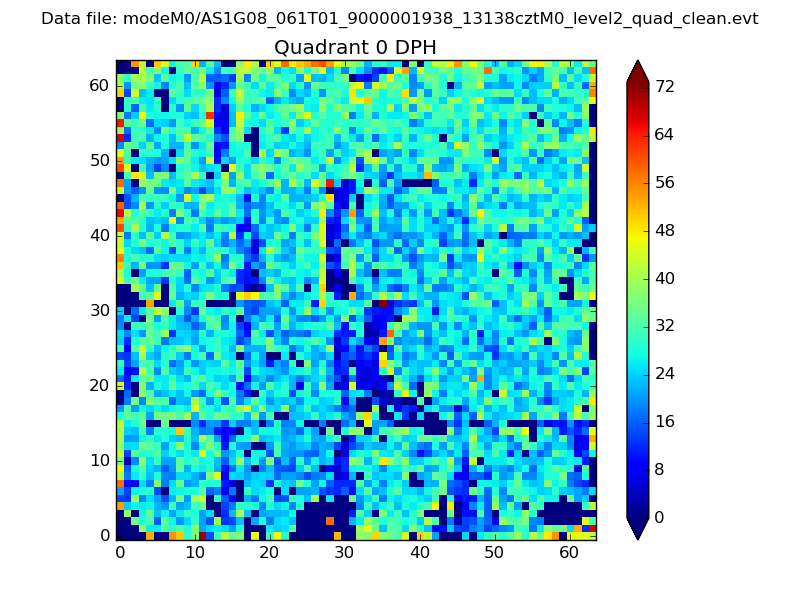 |
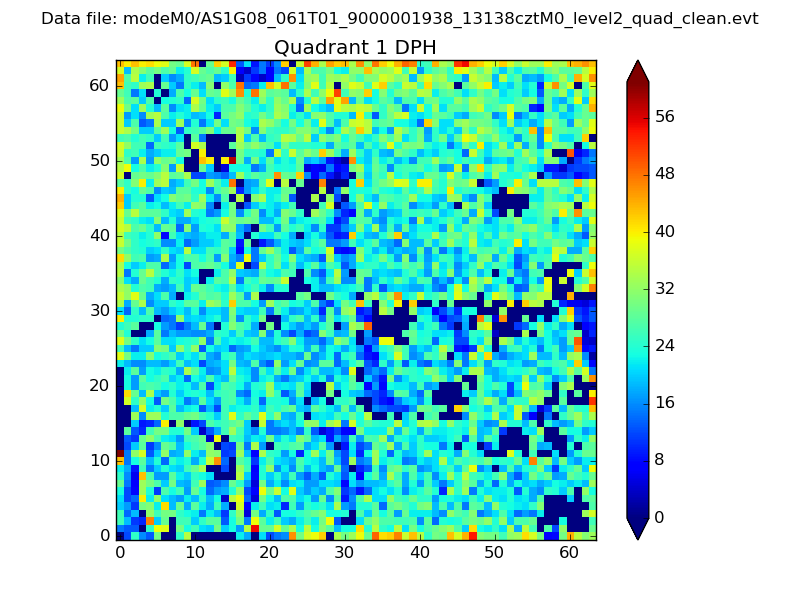 |
Quadrant B |
|---|---|---|---|
| Quadrant D | 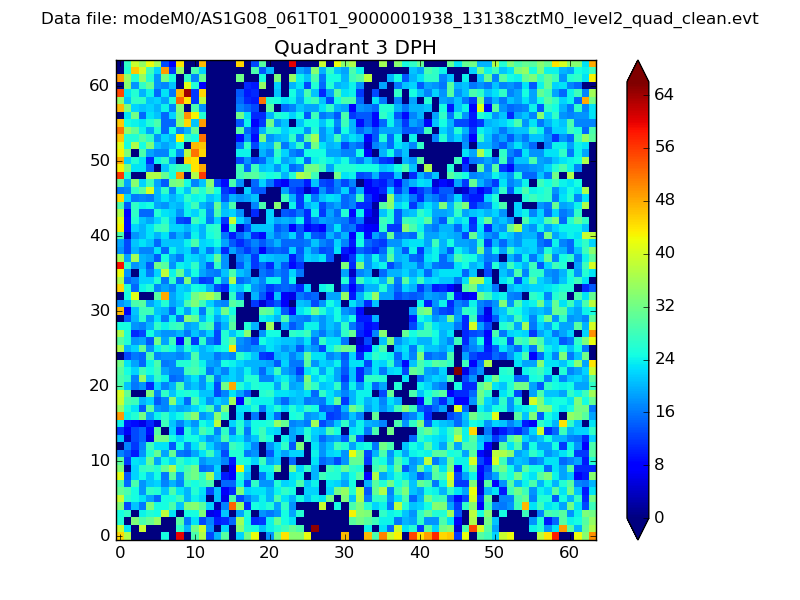 |
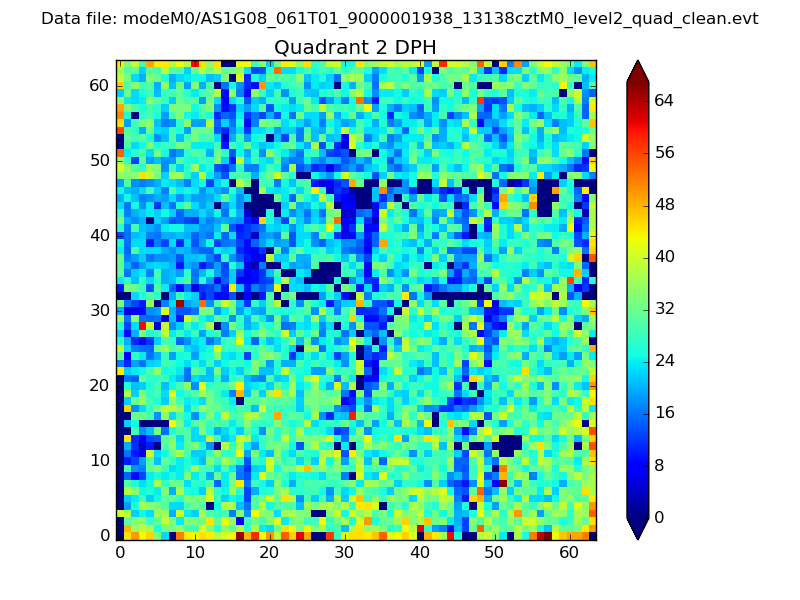 |
Quadrant C |
| Plot type | Count rate plots | Images |
|---|---|---|
| Comparison with Poisson distribution Blue bars denote a histogram of data divided into 1 sec bins. Red curve is a Poisson curve with rate = median count rate of data. |
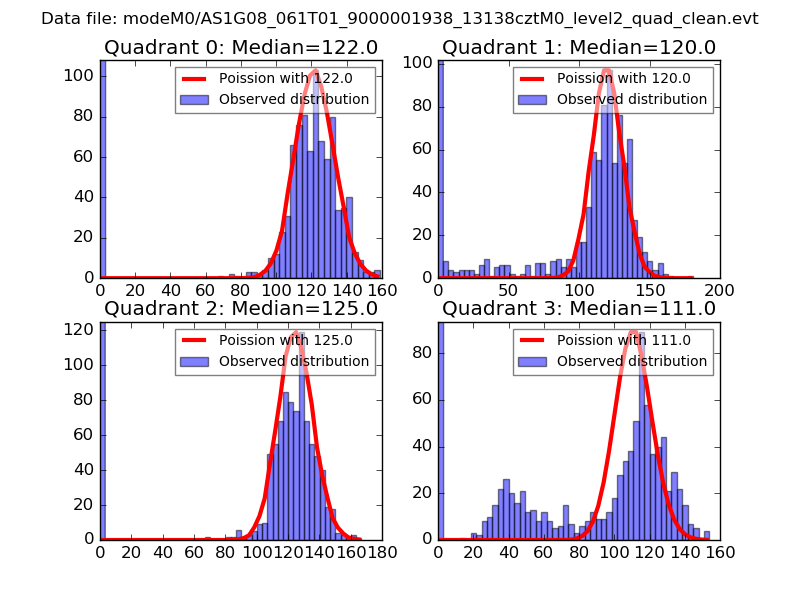 |
 |
| Quadrant-wise count rates Data is divided into 100 sec bins |
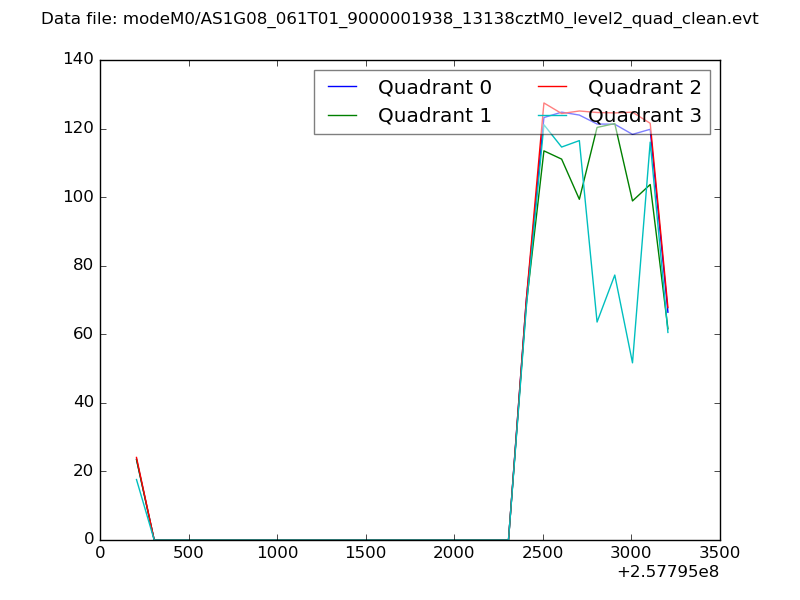 |
|
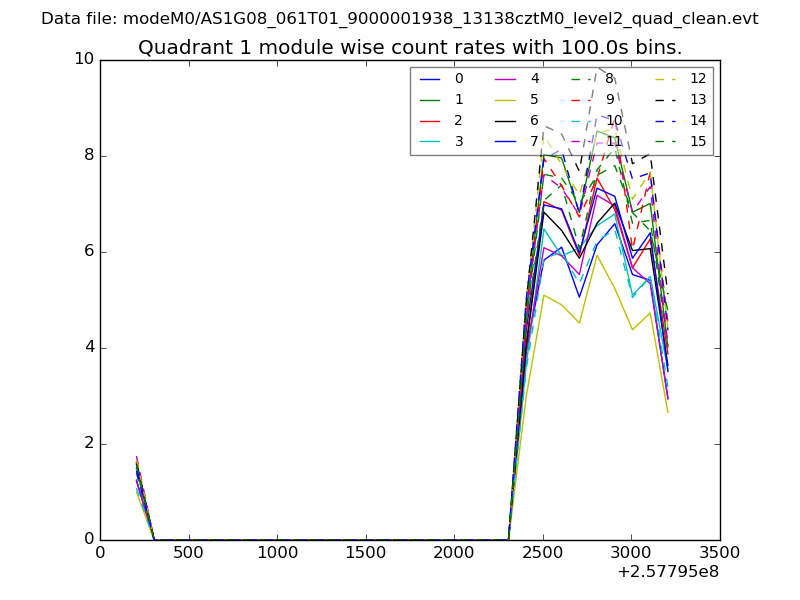
| Module-wise count rates for Quadrant A Data is divided into 100 sec bins |
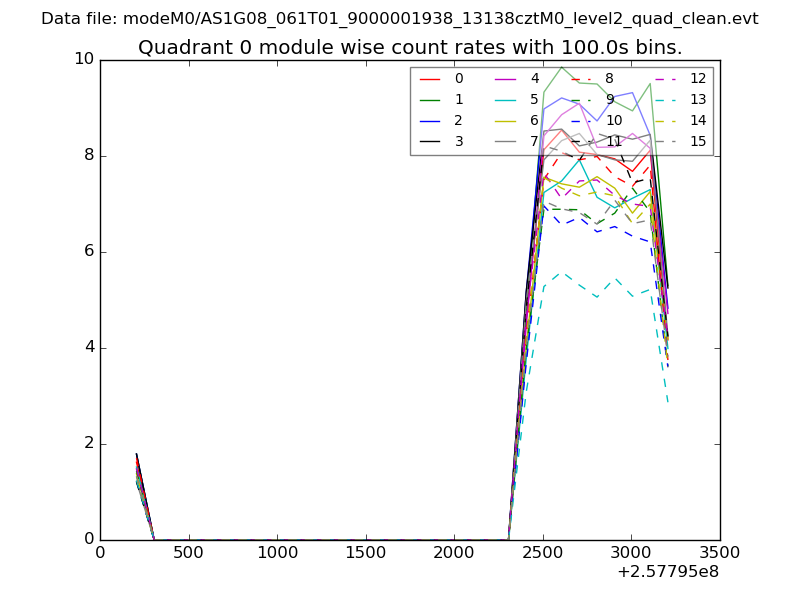 |
 |
| Module-wise count rates for Quadrant B Data is divided into 100 sec bins |
 |
 |
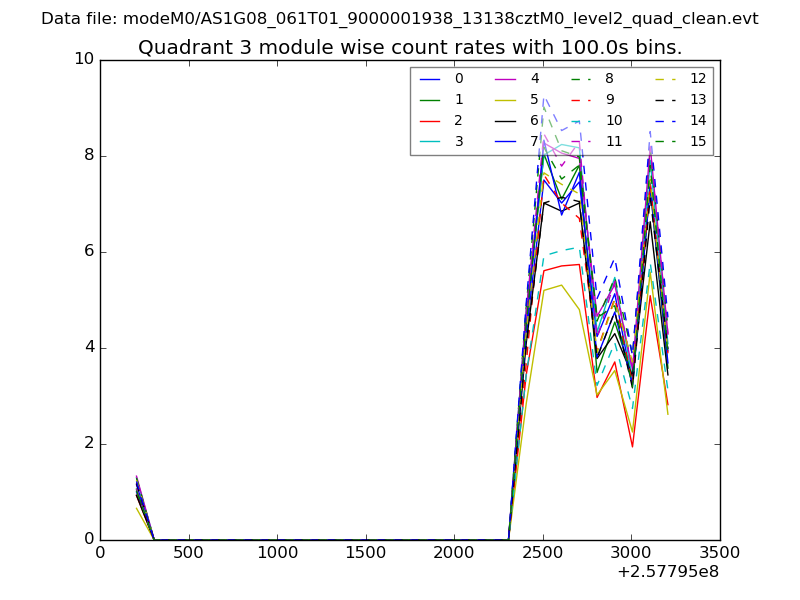
| Module-wise count rates for Quadrant C Data is divided into 100 sec bins |
 |
 |
| Module-wise count rates for Quadrant D Data is divided into 100 sec bins |
 |
 |
| Parameter | Plot |
|---|---|
| CZT HV Monitor |  |
| D_VDD | 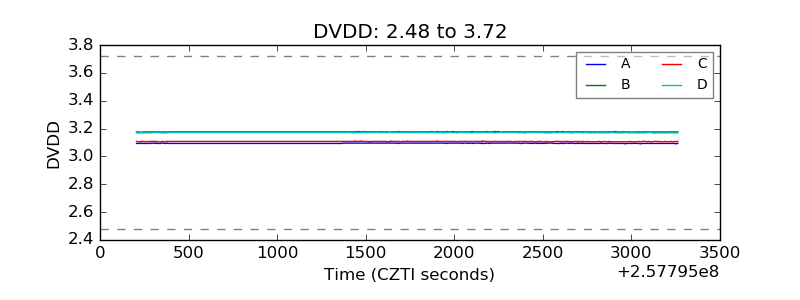 |
| Temperature 1 | 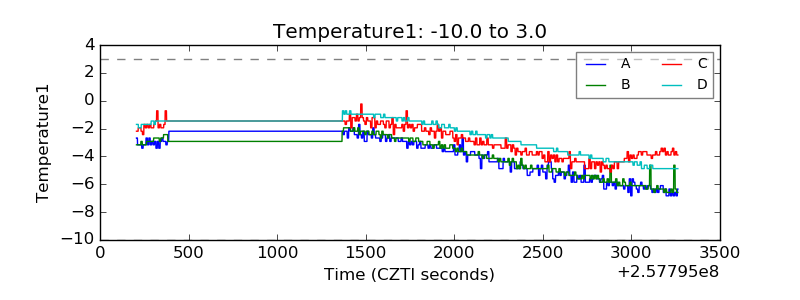 |
| Veto HV Monitor | 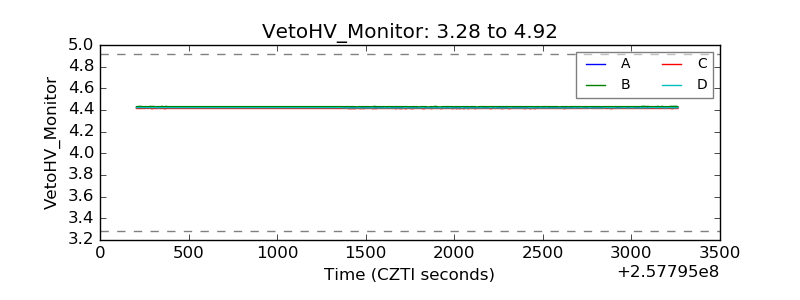 |
| Veto LLD | 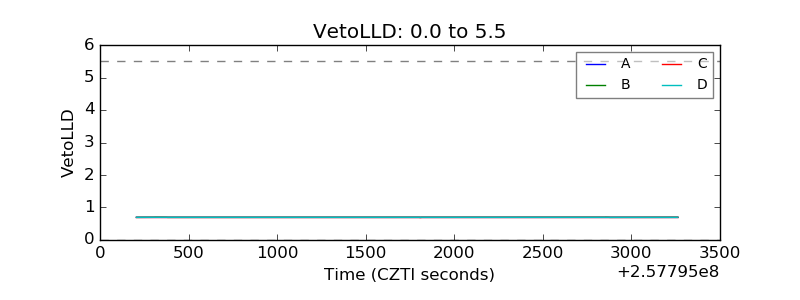 |
| Alpha Counter | 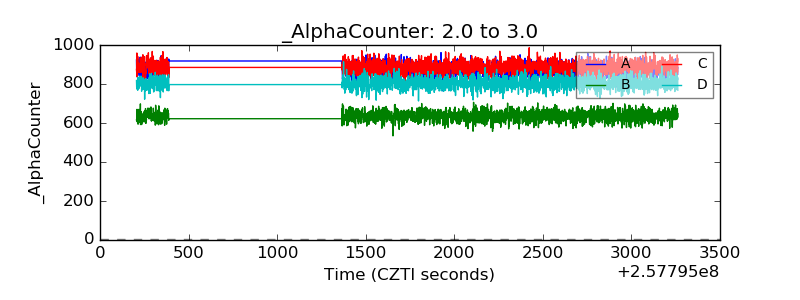 |
| _CPM_Rate | 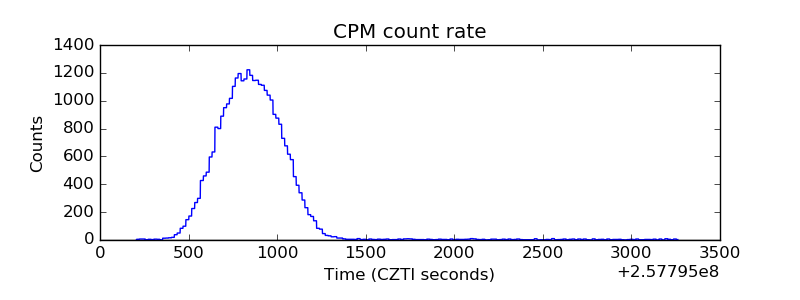 |
| CZT Counter | 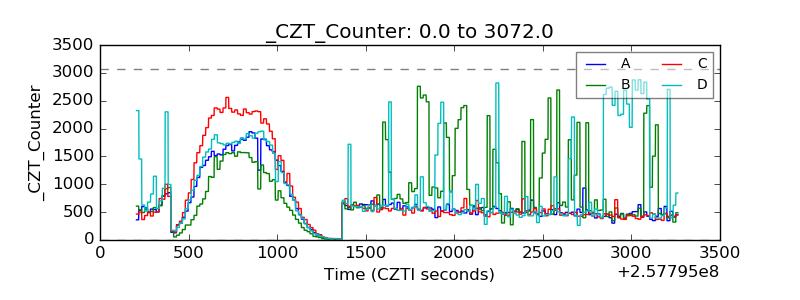 |
| +2.5 Volts monitor | 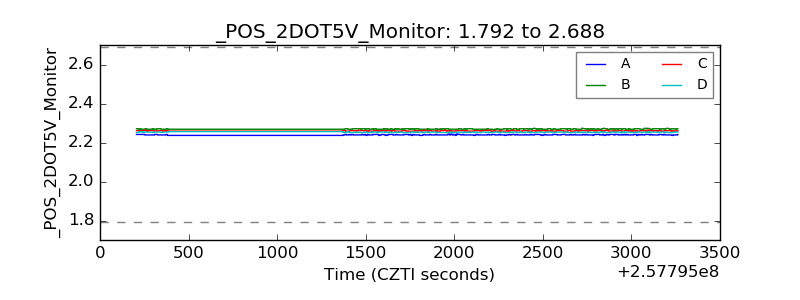 |
| +5 Volts monitor | 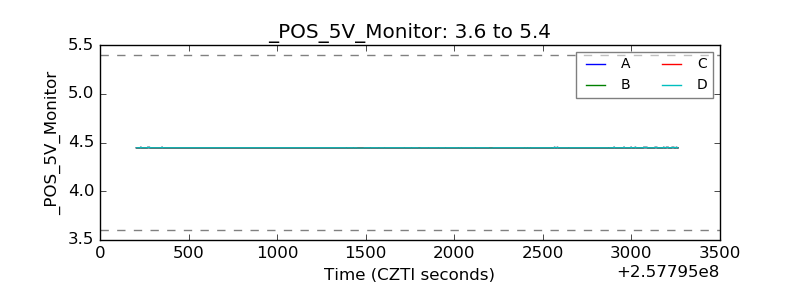 |
| _ROLL_ROT |  |
| _Roll_DEC | 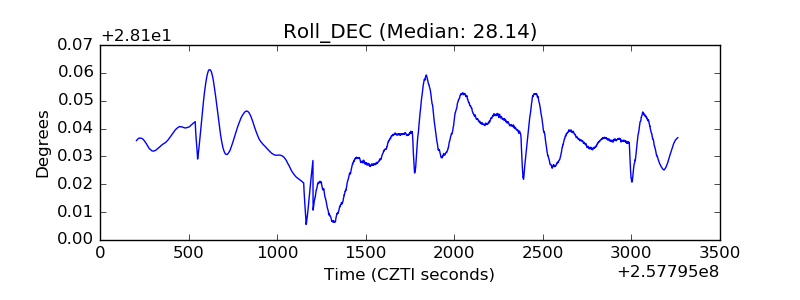 |
| _Roll_RA | 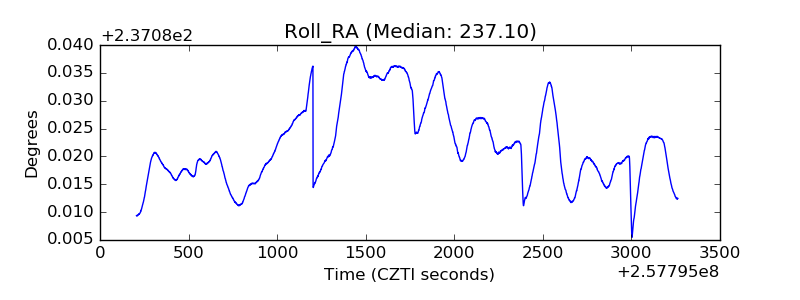 |
| Veto Counter | 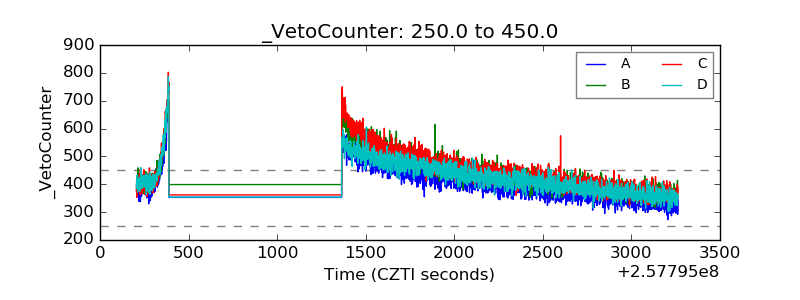 |