| Param | Original file | Final file |
|---|---|---|
| Filename | modeM0/AS1T02_011T01_9000001940cztM0_level2.fits | modeM0/AS1T02_011T01_9000001940cztM0_level2_quad_clean.evt |
| Size (bytes) | 519,359,040 | 527,895,360 |
| Size | 495.3 MB | 503.4 MB |
| Events in quadrant A | 3,151,182 | 3,220,406 |
| Events in quadrant B | 2,898,068 | 3,075,616 |
| Events in quadrant C | 3,171,512 | 3,102,673 |
| Events in quadrant D | 2,717,642 | 2,801,428 |
| Mode M9 | |||
|---|---|---|---|
| Quadrant | BADHDUFLAG | Total packets | Discarded packets |
| A | 0 | 86 | 0 |
| B | 0 | 86 | 0 |
| C | 0 | 86 | 0 |
| D | 0 | 86 | 0 |
| Mode M0 | |||
|---|---|---|---|
| Quadrant | BADHDUFLAG | Total packets | Discarded packets |
| A | 0 | 118472 | 0 |
| B | 0 | 155518 | 0 |
| C | 0 | 113563 | 0 |
| D | 0 | 128971 | 0 |
| Mode SS | |||
|---|---|---|---|
| Quadrant | BADHDUFLAG | Total packets | Discarded packets |
| A | 0 | 1124 | 0 |
| B | 0 | 1124 | 0 |
| C | 0 | 1124 | 0 |
| D | 0 | 1124 | 0 |
| Quadrant | Total seconds | Saturated seconds | Saturation percentage |
|---|---|---|---|
| A | 55199 | 913 | 1.654015% |
| B | 55199 | 5891 | 10.672295% |
| C | 55199 | 646 | 1.170311% |
| D | 55199 | 1409 | 2.552582% |
Noise dominated data is calculated using 1-second bins in cleaned event files. If a bin has >2000 counts, and if more than 50% of those come from <1% of pixels, then it is considered to be noise-dominated and hence unusable.
| Quadrant | # 1 sec bins | Bins with >0 counts | Bins with >2000 counts | High rate bins dominated by noise | Noise dominated (total time) | Noise dominated (detector-on time) | Marked lightcurve |
|---|---|---|---|---|---|---|---|
| A | 63924 | 55200 | 0 | 0 | 0.00% | 0.00% |  |
| B | 63924 | 54576 | 0 | 0 | 0.00% | 0.00% | 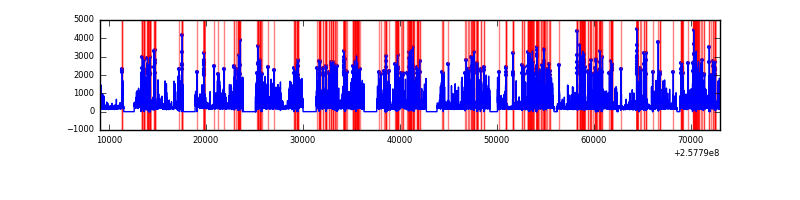 |
| C | 63924 | 55200 | 0 | 0 | 0.00% | 0.00% |  |
| D | 63924 | 55201 | 0 | 0 | 0.00% | 0.00% | 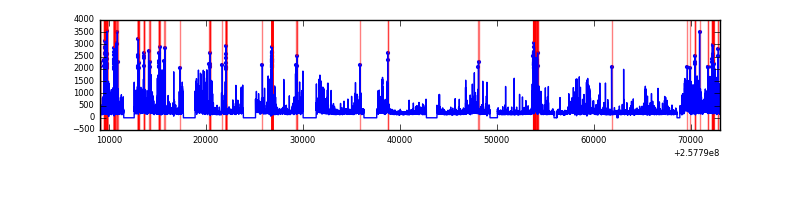 |
Top three noisy pixels from each quadrant. If the there are fewer than three noisy pixels in the level2.evt file, extra rows are filled as -1
| Pixel properties | Quadrant properties | ||||||
|---|---|---|---|---|---|---|---|
| Quadrant | DetID | PixID | Counts | Sigma | Mean | Median | Sigma |
| A | 0 | 29 | 2978 | 10.86 | 821 | 770 | 203.4 |
| A | 7 | 110 | 2549 | 8.75 | 821 | 770 | 203.4 |
| A | 9 | 19 | 2377 | 7.9 | 821 | 770 | 203.4 |
| B | 2 | 9 | 2463 | 11.53 | 764 | 729 | 150.4 |
| B | 3 | 17 | 1951 | 8.13 | 764 | 729 | 150.4 |
| B | 5 | 128 | 1900 | 7.79 | 764 | 729 | 150.4 |
| C | 1 | 80 | 2519 | 7.99 | 837 | 780 | 217.8 |
| C | 1 | 81 | 2435 | 7.6 | 837 | 780 | 217.8 |
| C | 3 | 126 | 2165 | 6.36 | 837 | 780 | 217.8 |
| D | 6 | 231 | 2032 | 6.44 | 774 | 704 | 206.2 |
| D | 7 | 5 | 1921 | 5.9 | 774 | 704 | 206.2 |
| D | 7 | 3 | 1887 | 5.74 | 774 | 704 | 206.2 |
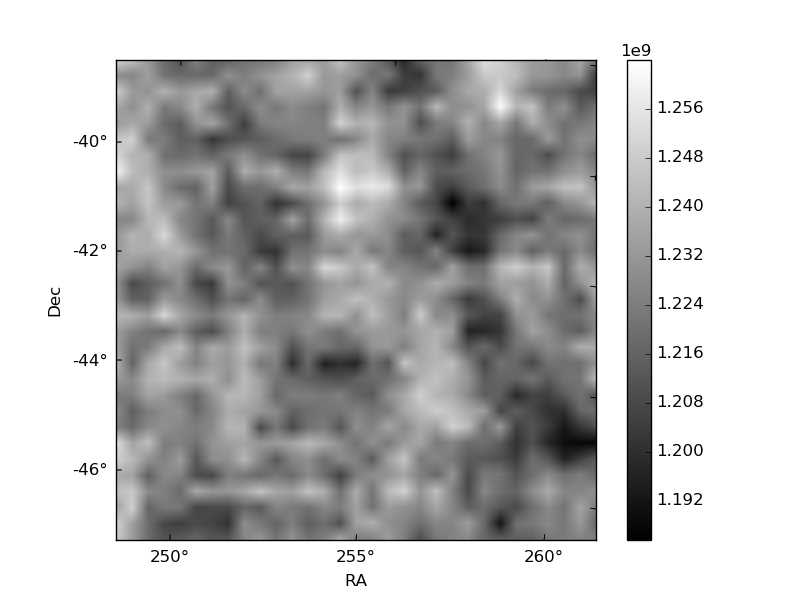
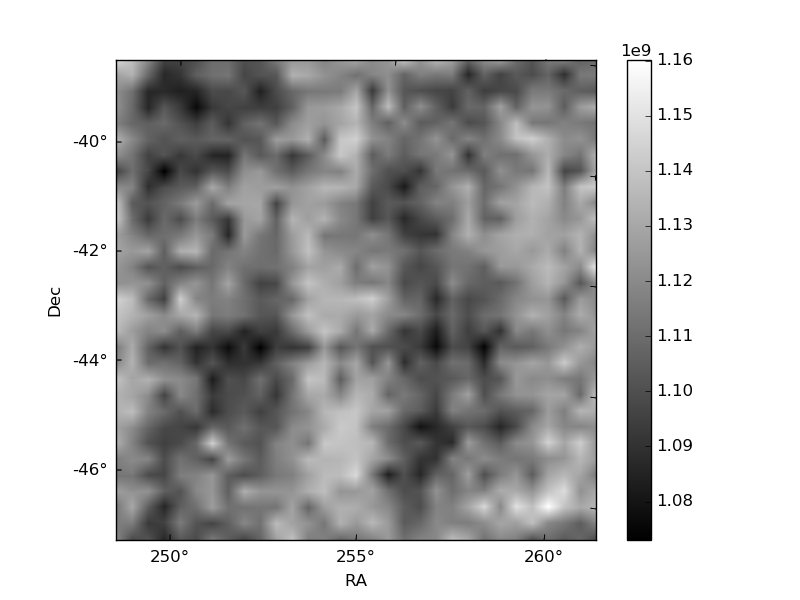
Histogram calculated using DETX and DETY for each event in the final _common_clean file
| Quadrant A | 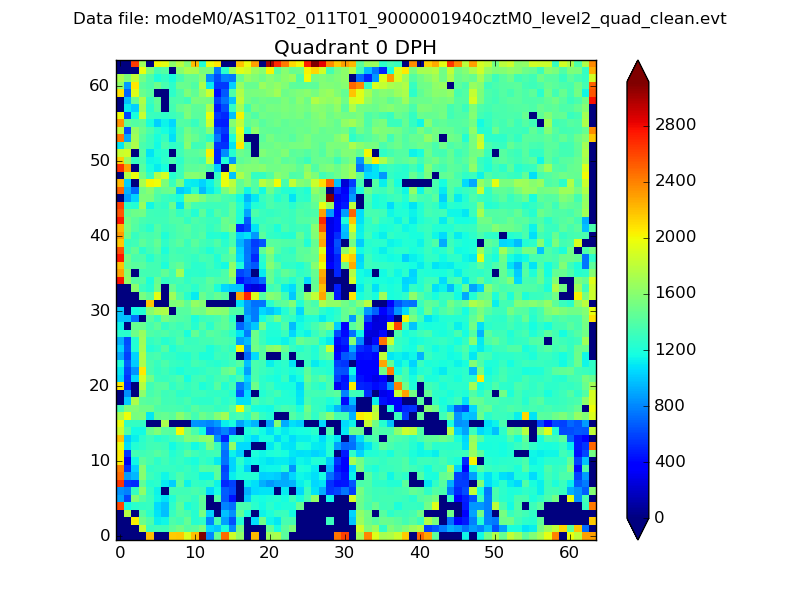 |
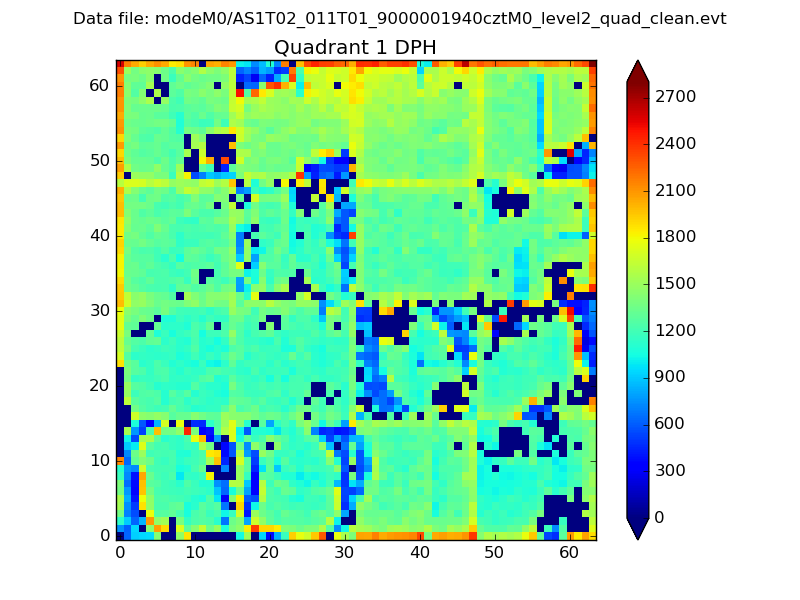 |
Quadrant B |
|---|---|---|---|
| Quadrant D | 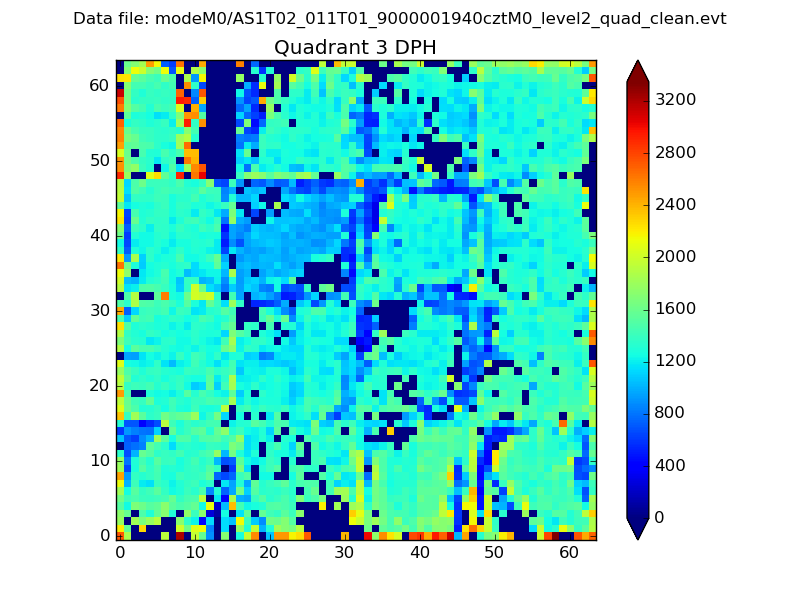 |
 |
Quadrant C |
| Plot type | Count rate plots | Images |
|---|---|---|
| Comparison with Poisson distribution Blue bars denote a histogram of data divided into 1 sec bins. Red curve is a Poisson curve with rate = median count rate of data. |
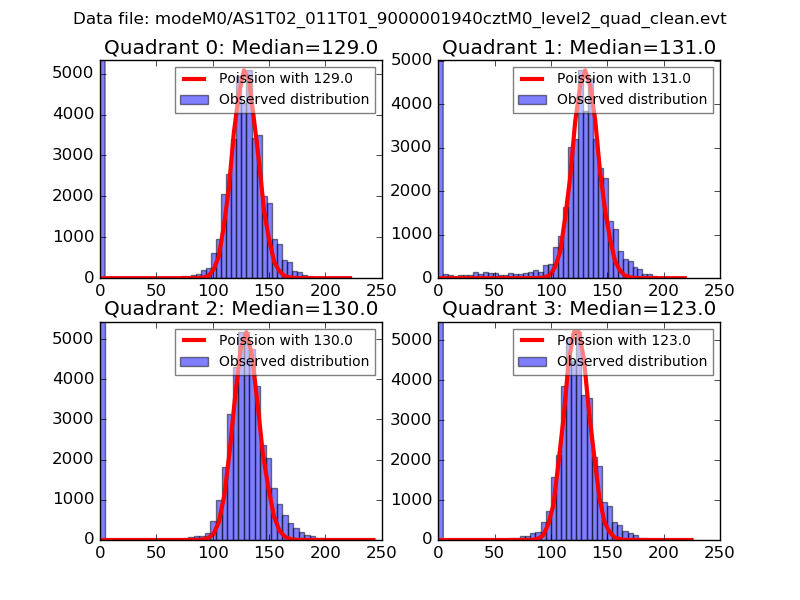 |
 |
| Quadrant-wise count rates Data is divided into 100 sec bins |
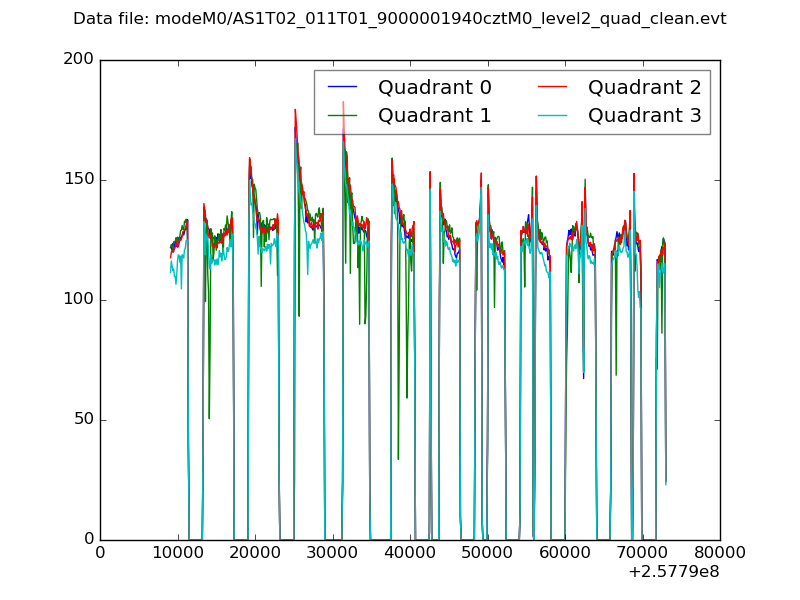 |
|
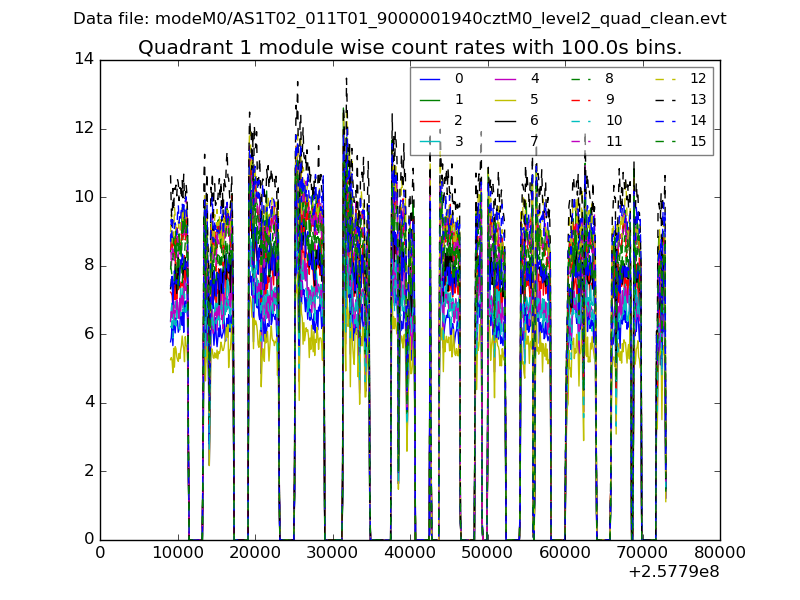
| Module-wise count rates for Quadrant A Data is divided into 100 sec bins |
 |
 |
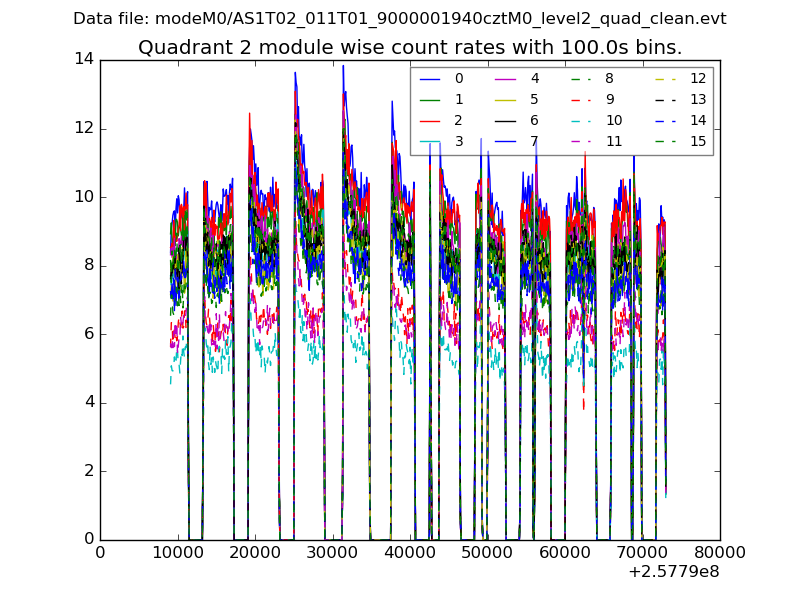
| Module-wise count rates for Quadrant B Data is divided into 100 sec bins |
 |
 |
| Module-wise count rates for Quadrant C Data is divided into 100 sec bins |
 |
 |
| Module-wise count rates for Quadrant D Data is divided into 100 sec bins |
 |
 |
| Parameter | Plot |
|---|---|
| CZT HV Monitor |  |
| D_VDD | 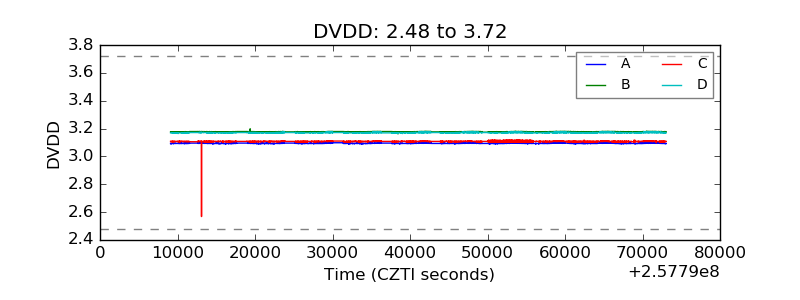 |
| Temperature 1 | 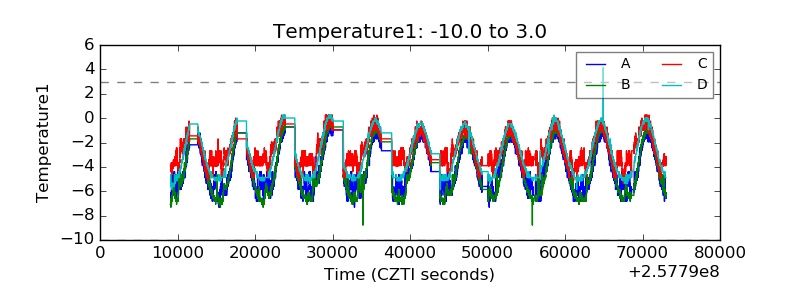 |
| Veto HV Monitor |  |
| Veto LLD | 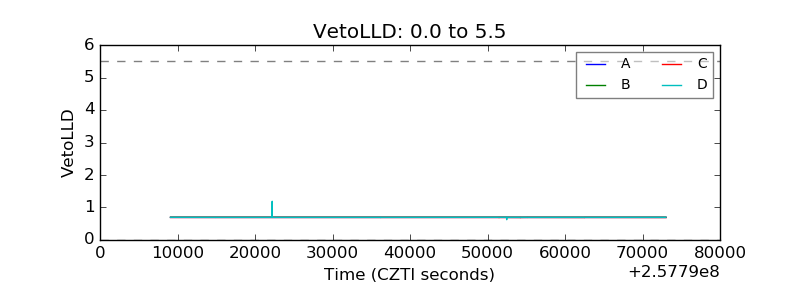 |
| Alpha Counter |  |
| _CPM_Rate |  |
| CZT Counter |  |
| +2.5 Volts monitor |  |
| +5 Volts monitor | 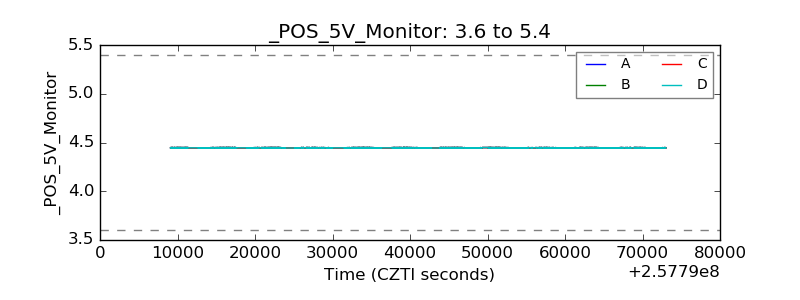 |
| _ROLL_ROT | 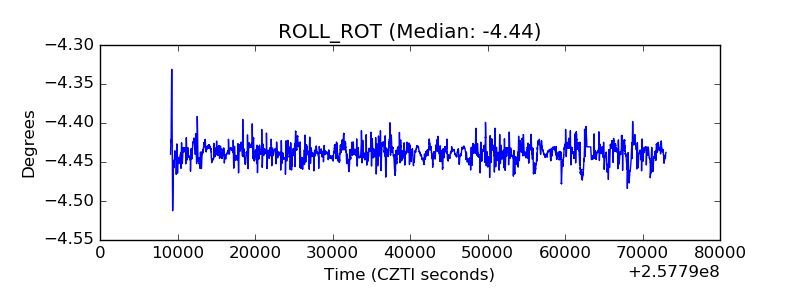 |
| _Roll_DEC |  |
| _Roll_RA |  |
| Veto Counter |  |