| Param | Original file | Final file |
|---|---|---|
| Filename | modeM0/AS1T02_011T01_9000001940_13140cztM0_level2.evt | modeM0/AS1T02_011T01_9000001940_13140cztM0_level2_quad_clean.evt |
| Size (bytes) | 511,128,000 | 95,952,960 |
| Size | 487.4 MB | 91.5 MB |
| Events in quadrant A | 3,290,224 | 634,794 |
| Events in quadrant B | 4,926,421 | 610,459 |
| Events in quadrant C | 2,957,737 | 631,674 |
| Events in quadrant D | 3,880,659 | 592,407 |
| Mode M9 | |||
|---|---|---|---|
| Quadrant | BADHDUFLAG | Total packets | Discarded packets |
| A | 0 | 24 | 0 |
| B | 0 | 24 | 0 |
| C | 0 | 24 | 0 |
| D | 0 | 24 | 0 |
| Mode M0 | |||
|---|---|---|---|
| Quadrant | BADHDUFLAG | Total packets | Discarded packets |
| A | 0 | 13813 | 3 |
| B | 0 | 18879 | 2 |
| C | 0 | 12899 | 2 |
| D | 0 | 15666 | 2 |
| Mode SS | |||
|---|---|---|---|
| Quadrant | BADHDUFLAG | Total packets | Discarded packets |
| A | 0 | 126 | 0 |
| B | 0 | 126 | 0 |
| C | 0 | 126 | 0 |
| D | 0 | 126 | 0 |
| Quadrant | Total seconds | Saturated seconds | Saturation percentage |
|---|---|---|---|
| A | 6266 | 66 | 1.053304% |
| B | 6266 | 754 | 12.033195% |
| C | 6266 | 34 | 0.542611% |
| D | 6266 | 153 | 2.441749% |
Noise dominated data is calculated using 1-second bins in cleaned event files. If a bin has >2000 counts, and if more than 50% of those come from <1% of pixels, then it is considered to be noise-dominated and hence unusable.
| Quadrant | # 1 sec bins | Bins with >0 counts | Bins with >2000 counts | High rate bins dominated by noise | Noise dominated (total time) | Noise dominated (detector-on time) | Marked lightcurve |
|---|---|---|---|---|---|---|---|
| A | 8562 | 6269 | 4 | 4 | 0.05% | 0.06% | 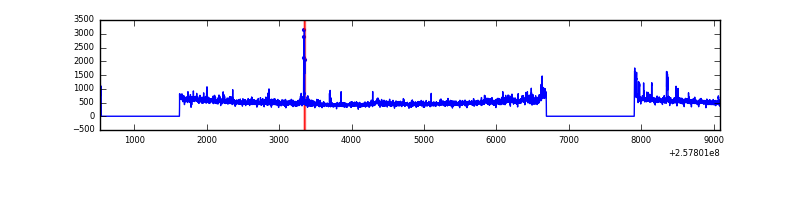 |
| B | 8562 | 6269 | 378 | 378 | 4.41% | 6.03% | 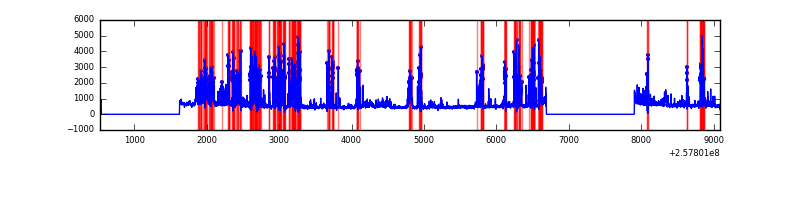 |
| C | 8562 | 6269 | 0 | 0 | 0.00% | 0.00% | 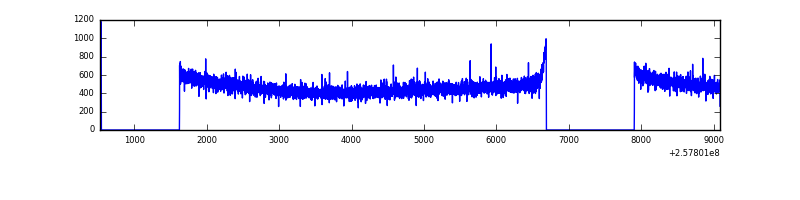 |
| D | 8562 | 6269 | 99 | 99 | 1.16% | 1.58% | 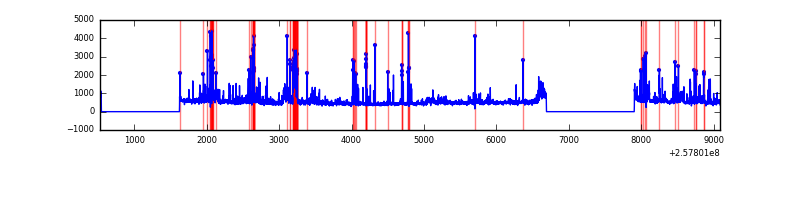 |
Top three noisy pixels from each quadrant. If the there are fewer than three noisy pixels in the level2.evt file, extra rows are filled as -1
| Pixel properties | Quadrant properties | ||||||
|---|---|---|---|---|---|---|---|
| Quadrant | DetID | PixID | Counts | Sigma | Mean | Median | Sigma |
| A | 12 | 189 | 140133 | 888.89 | 777 | 762 | 156.8 |
| A | 0 | 23 | 73488 | 463.84 | 777 | 762 | 156.8 |
| A | 4 | 2 | 35326 | 220.44 | 777 | 762 | 156.8 |
| B | 4 | 239 | 1487411 | 10695.88 | 740 | 722 | 139.0 |
| B | 15 | 32 | 214719 | 1539.59 | 740 | 722 | 139.0 |
| B | 0 | 85 | 170999 | 1225.05 | 740 | 722 | 139.0 |
| C | 13 | 61 | 5466 | 26.85 | 757 | 762 | 175.2 |
| C | 0 | 207 | 4975 | 24.05 | 757 | 762 | 175.2 |
| C | 8 | 222 | 2103 | 7.66 | 757 | 762 | 175.2 |
| D | 1 | 52 | 914586 | 5121.52 | 744 | 724 | 178.4 |
| D | 5 | 222 | 76116 | 422.51 | 744 | 724 | 178.4 |
| D | 2 | 234 | 29378 | 160.58 | 744 | 724 | 178.4 |
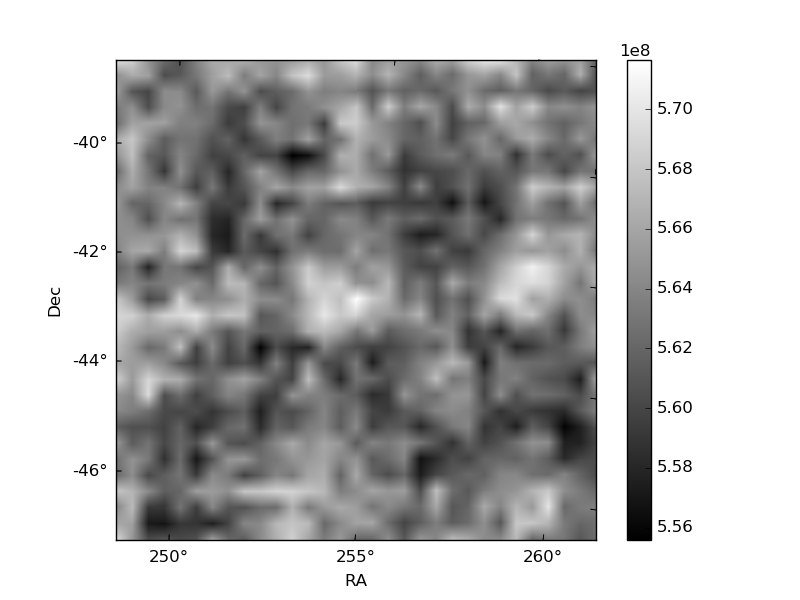
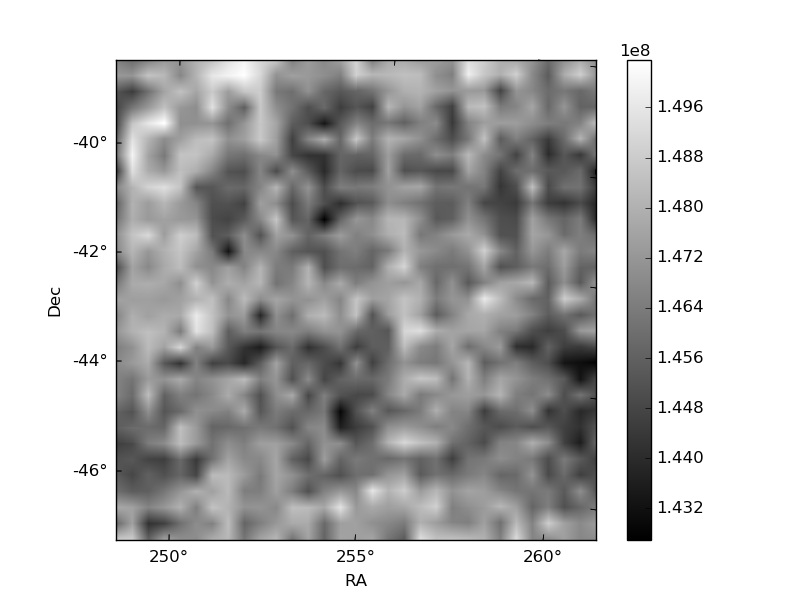
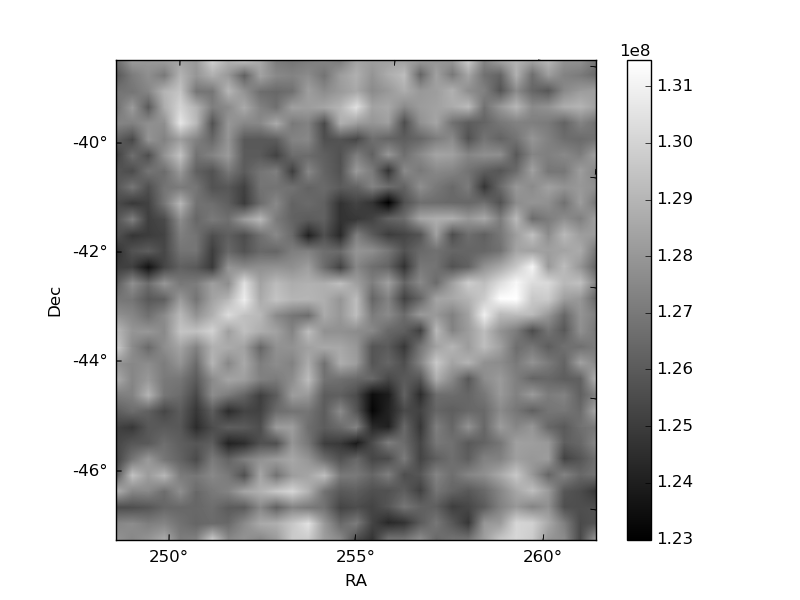
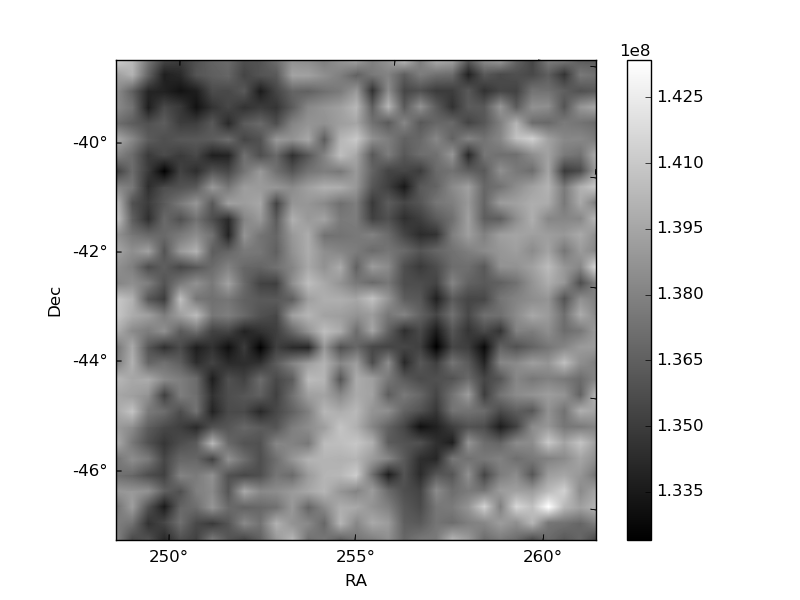
Histogram calculated using DETX and DETY for each event in the final _common_clean file
| Quadrant A | 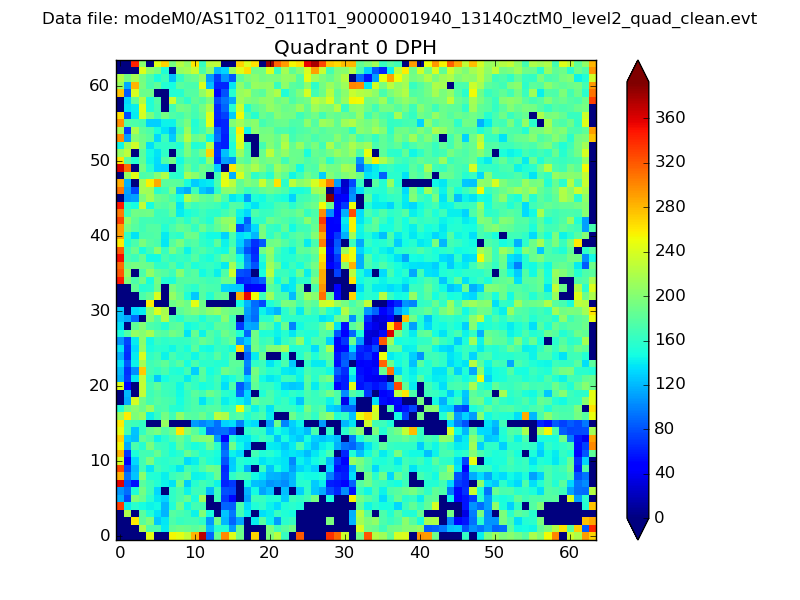 |
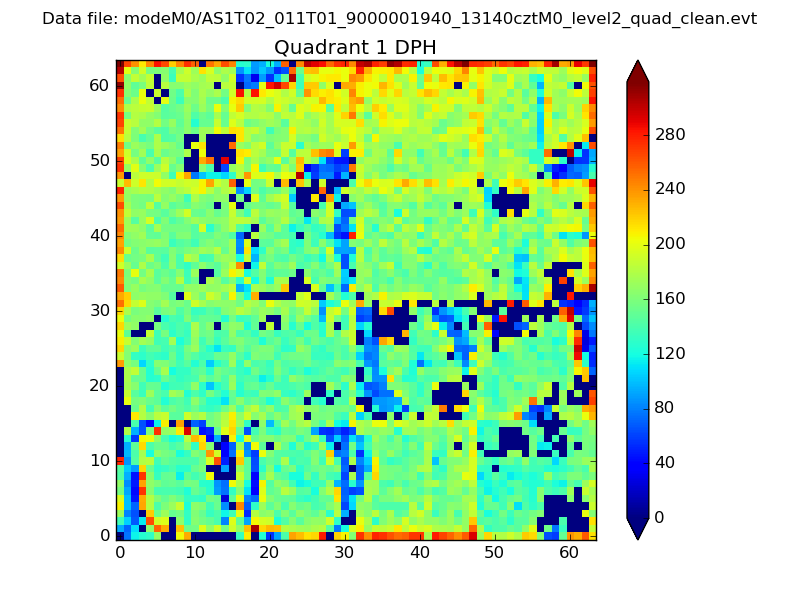 |
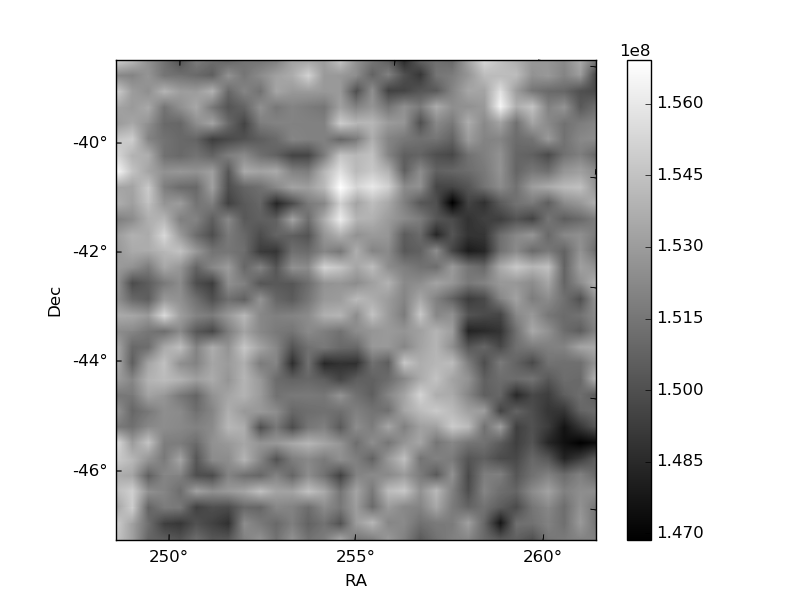
Quadrant B |
|---|---|---|---|
| Quadrant D | 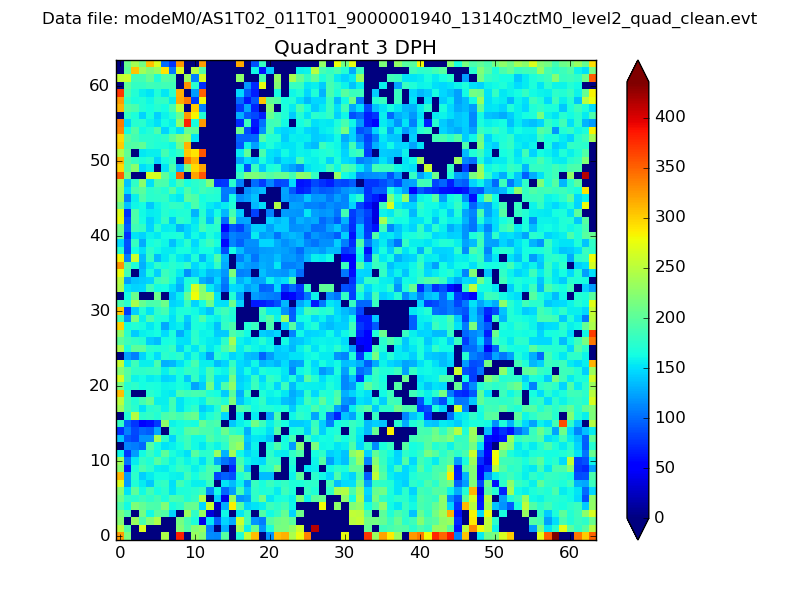 |
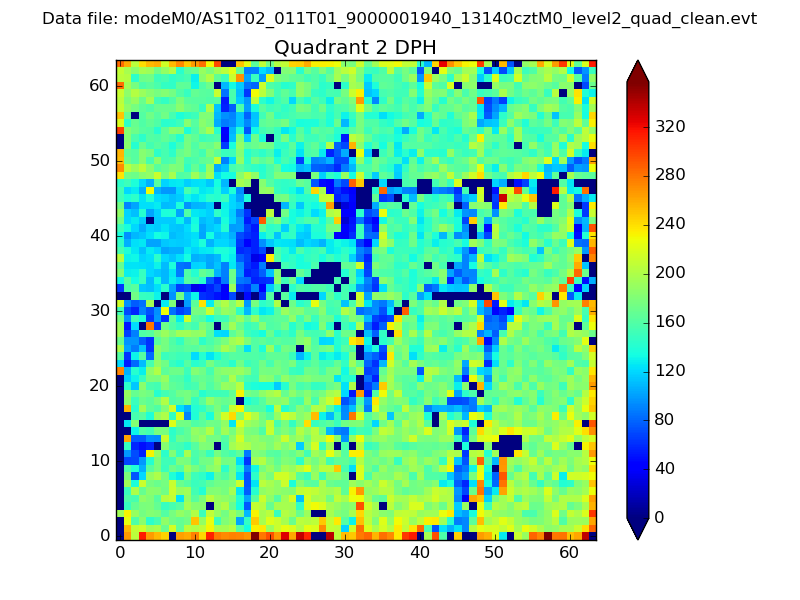 |
Quadrant C |
| Plot type | Count rate plots | Images |
|---|---|---|
| Comparison with Poisson distribution Blue bars denote a histogram of data divided into 1 sec bins. Red curve is a Poisson curve with rate = median count rate of data. |
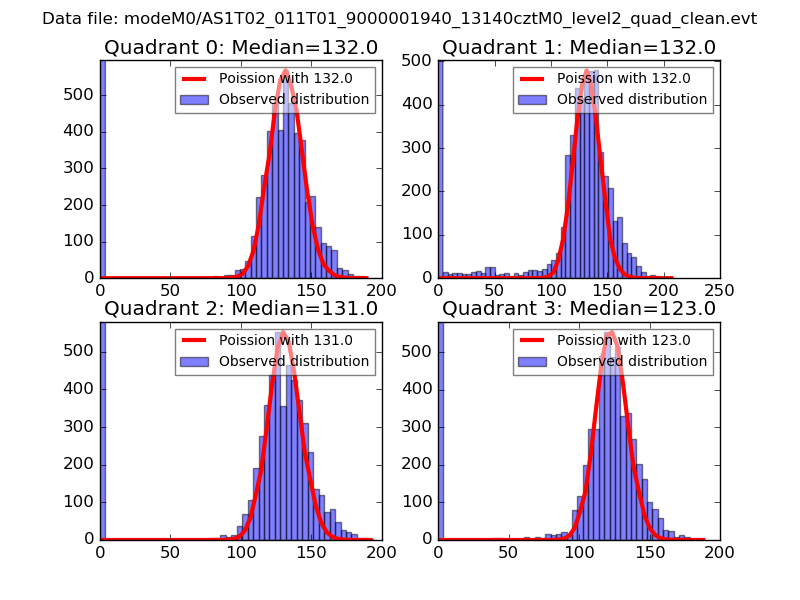 |
 |
| Quadrant-wise count rates Data is divided into 100 sec bins |
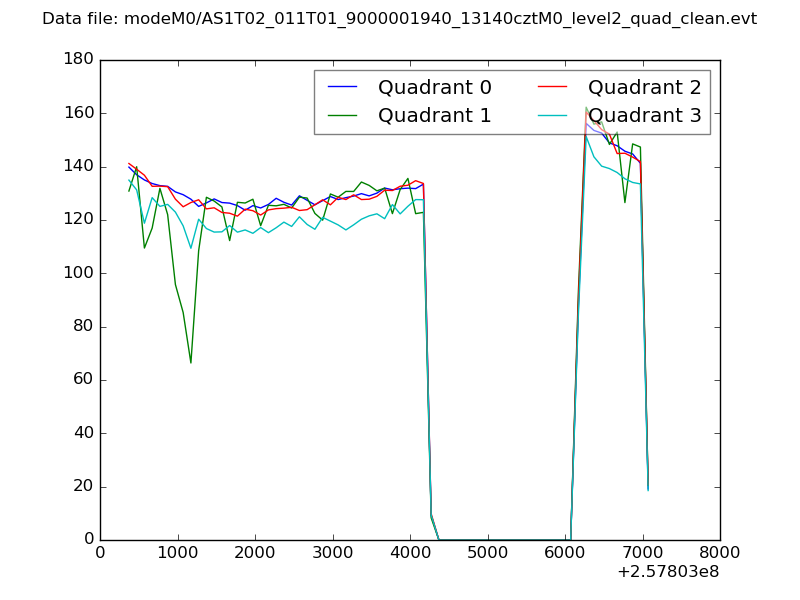 |
|
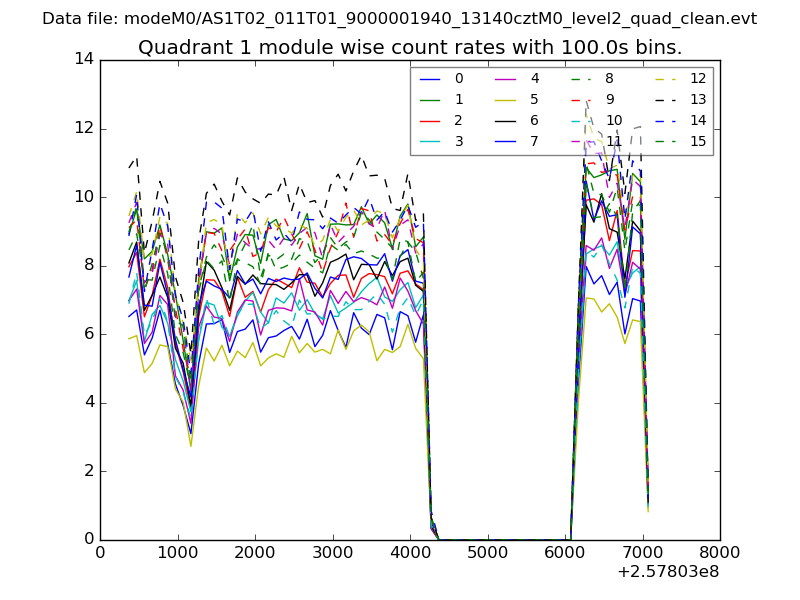
| Module-wise count rates for Quadrant A Data is divided into 100 sec bins |
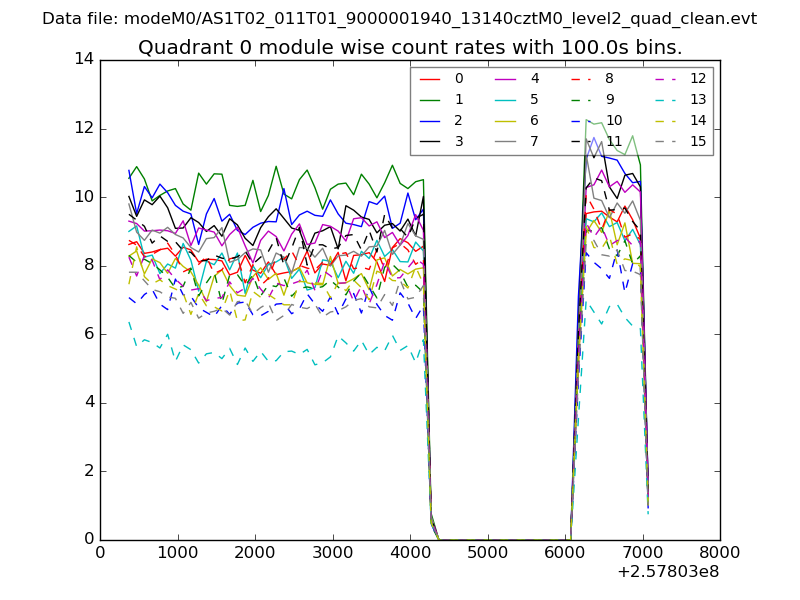 |
 |
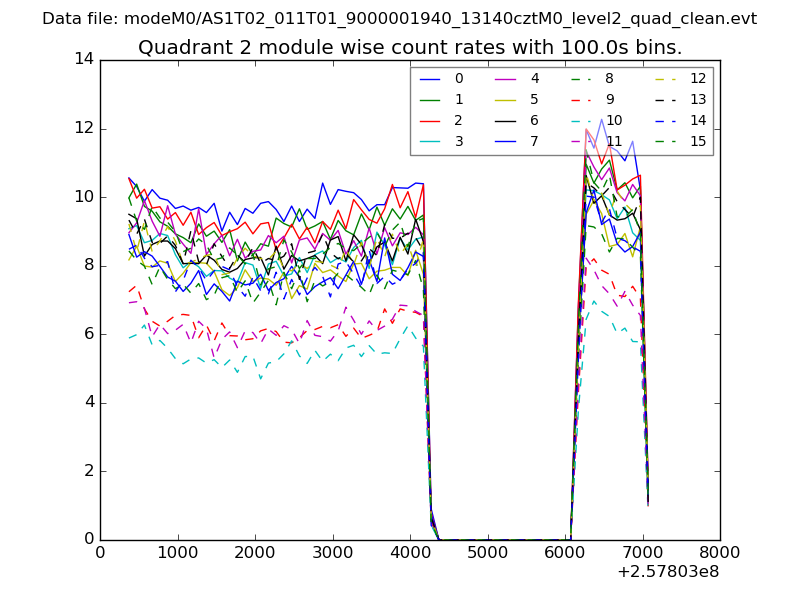
| Module-wise count rates for Quadrant B Data is divided into 100 sec bins |
 |
 |
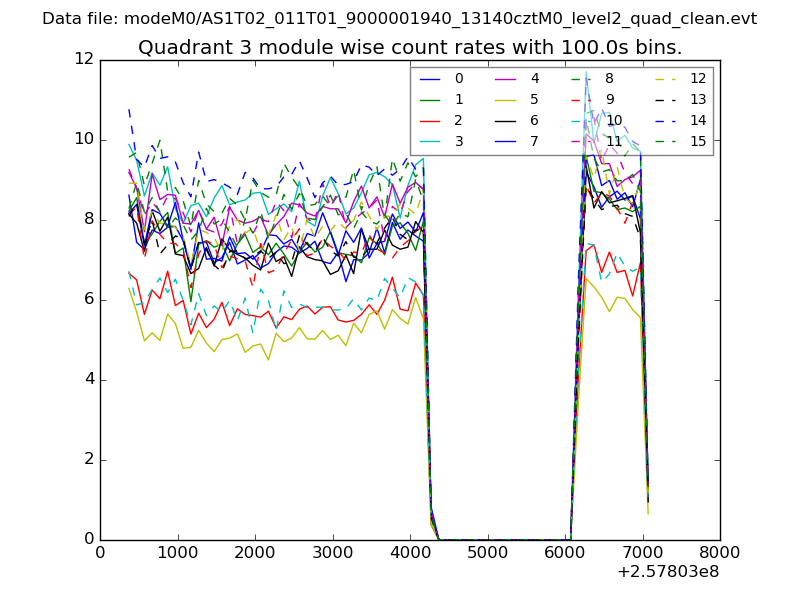
| Module-wise count rates for Quadrant C Data is divided into 100 sec bins |
 |
 |
| Module-wise count rates for Quadrant D Data is divided into 100 sec bins |
 |
 |
| Parameter | Plot |
|---|---|
| CZT HV Monitor | 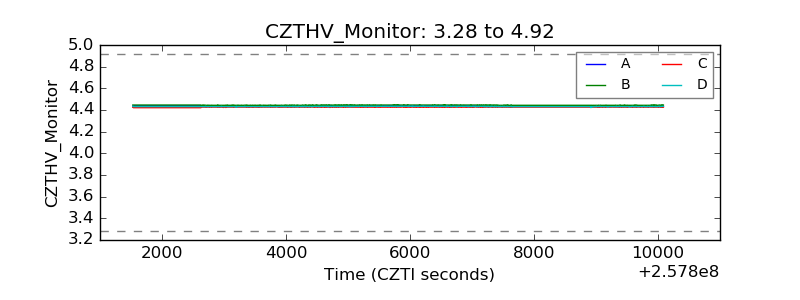 |
| D_VDD | 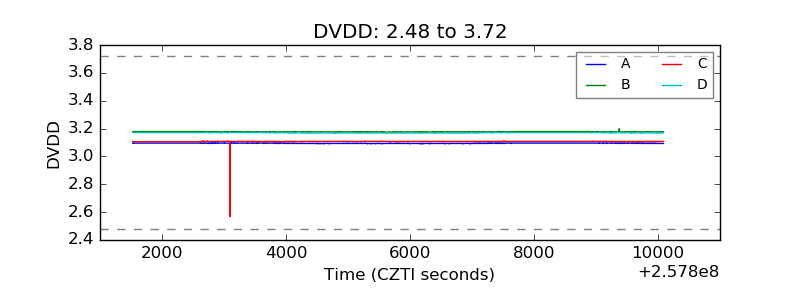 |
| Temperature 1 | 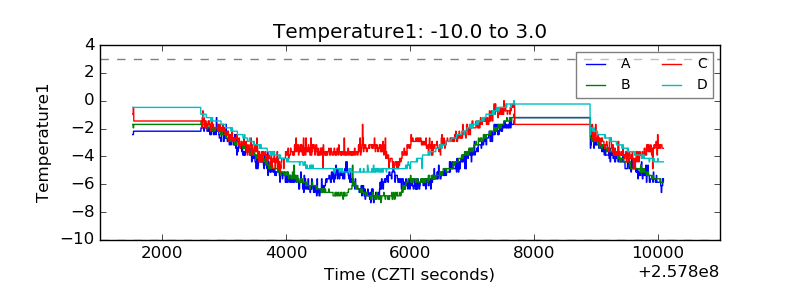 |
| Veto HV Monitor |  |
| Veto LLD | 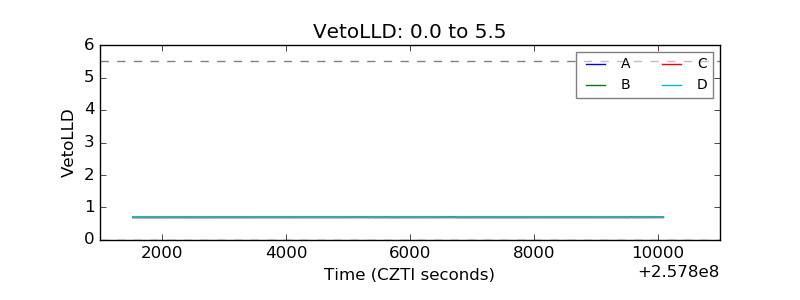 |
| Alpha Counter |  |
| _CPM_Rate | 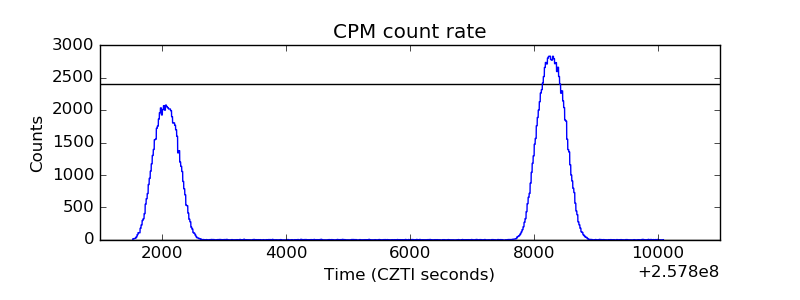 |
| CZT Counter | 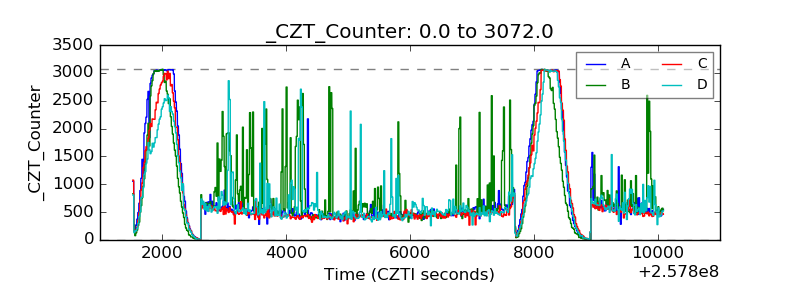 |
| +2.5 Volts monitor |  |
| +5 Volts monitor |  |
| _ROLL_ROT | 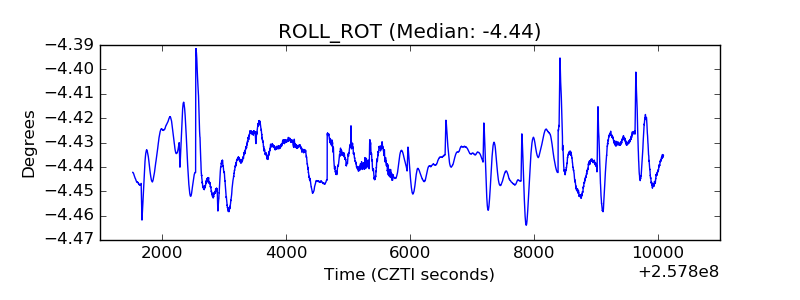 |
| _Roll_DEC | 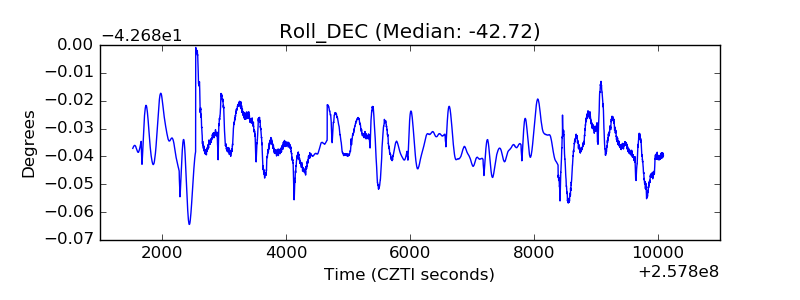 |
| _Roll_RA | 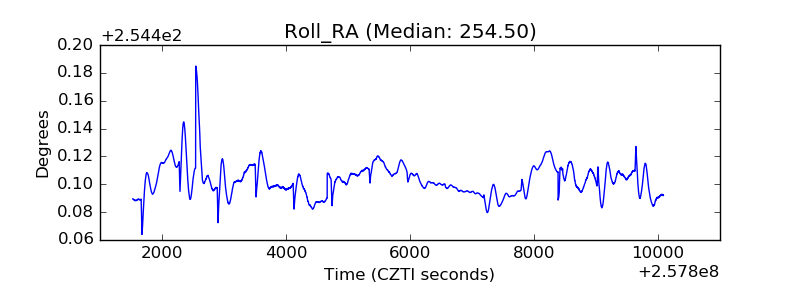 |
| Veto Counter | 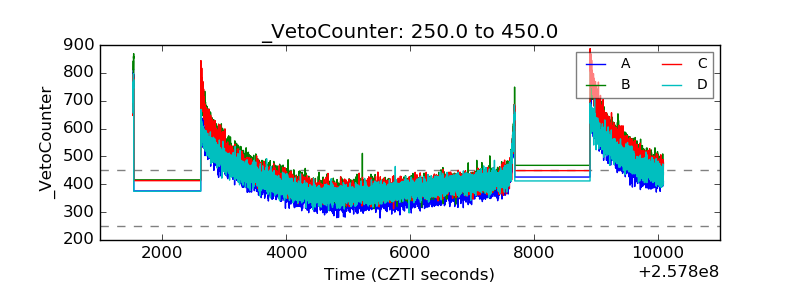 |