| Param | Original file | Final file |
|---|---|---|
| Filename | modeM0/AS1T02_011T01_9000001940_13142cztM0_level2.evt | modeM0/AS1T02_011T01_9000001940_13142cztM0_level2_quad_clean.evt |
| Size (bytes) | 488,361,600 | 108,077,760 |
| Size | 465.7 MB | 103.1 MB |
| Events in quadrant A | 3,135,700 | 722,498 |
| Events in quadrant B | 4,766,951 | 701,864 |
| Events in quadrant C | 2,970,305 | 737,609 |
| Events in quadrant D | 3,501,269 | 683,557 |
| Mode M9 | |||
|---|---|---|---|
| Quadrant | BADHDUFLAG | Total packets | Discarded packets |
| A | 0 | 19 | 0 |
| B | 0 | 19 | 0 |
| C | 0 | 19 | 0 |
| D | 0 | 20 | 0 |
| Mode M0 | |||
|---|---|---|---|
| Quadrant | BADHDUFLAG | Total packets | Discarded packets |
| A | 0 | 13137 | 3 |
| B | 0 | 18197 | 2 |
| C | 0 | 12648 | 2 |
| D | 0 | 14414 | 2 |
| Mode SS | |||
|---|---|---|---|
| Quadrant | BADHDUFLAG | Total packets | Discarded packets |
| A | 0 | 126 | 0 |
| B | 0 | 126 | 0 |
| C | 0 | 126 | 0 |
| D | 0 | 126 | 0 |
| Quadrant | Total seconds | Saturated seconds | Saturation percentage |
|---|---|---|---|
| A | 6120 | 24 | 0.392157% |
| B | 6120 | 740 | 12.091503% |
| C | 6120 | 4 | 0.065359% |
| D | 6120 | 79 | 1.290850% |
Noise dominated data is calculated using 1-second bins in cleaned event files. If a bin has >2000 counts, and if more than 50% of those come from <1% of pixels, then it is considered to be noise-dominated and hence unusable.
| Quadrant | # 1 sec bins | Bins with >0 counts | Bins with >2000 counts | High rate bins dominated by noise | Noise dominated (total time) | Noise dominated (detector-on time) | Marked lightcurve |
|---|---|---|---|---|---|---|---|
| A | 7476 | 6122 | 4 | 4 | 0.05% | 0.07% | 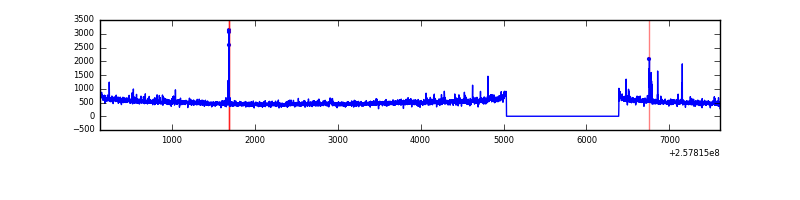 |
| B | 7476 | 6122 | 365 | 365 | 4.88% | 5.96% | 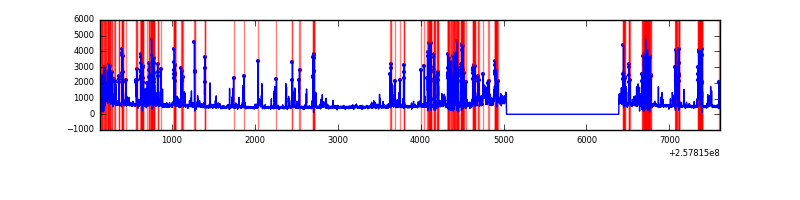 |
| C | 7476 | 6122 | 0 | 0 | 0.00% | 0.00% | 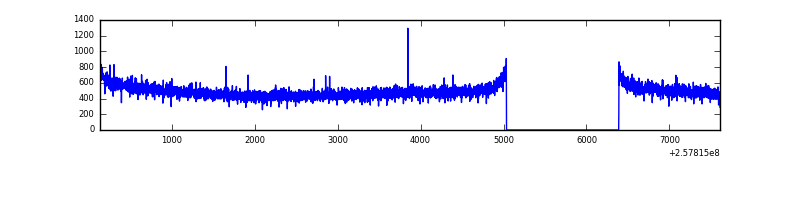 |
| D | 7476 | 6122 | 59 | 59 | 0.79% | 0.96% | 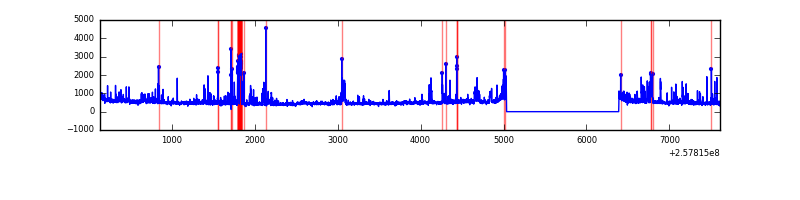 |
Top three noisy pixels from each quadrant. If the there are fewer than three noisy pixels in the level2.evt file, extra rows are filled as -1
| Pixel properties | Quadrant properties | ||||||
|---|---|---|---|---|---|---|---|
| Quadrant | DetID | PixID | Counts | Sigma | Mean | Median | Sigma |
| A | 12 | 189 | 78919 | 509.61 | 766 | 751 | 153.4 |
| A | 4 | 2 | 35842 | 228.77 | 766 | 751 | 153.4 |
| A | 1 | 162 | 19500 | 122.23 | 766 | 751 | 153.4 |
| B | 4 | 239 | 1543882 | 11462.96 | 725 | 709 | 134.6 |
| B | 0 | 85 | 148860 | 1100.49 | 725 | 709 | 134.6 |
| B | 0 | 189 | 78999 | 581.55 | 725 | 709 | 134.6 |
| C | 13 | 61 | 5484 | 27.08 | 761 | 767 | 174.2 |
| C | 8 | 222 | 2771 | 11.5 | 761 | 767 | 174.2 |
| C | 0 | 207 | 2246 | 8.49 | 761 | 767 | 174.2 |
| D | 1 | 52 | 608111 | 3427.68 | 743 | 726 | 177.2 |
| D | 8 | 195 | 28703 | 157.88 | 743 | 726 | 177.2 |
| D | 2 | 234 | 23425 | 128.1 | 743 | 726 | 177.2 |
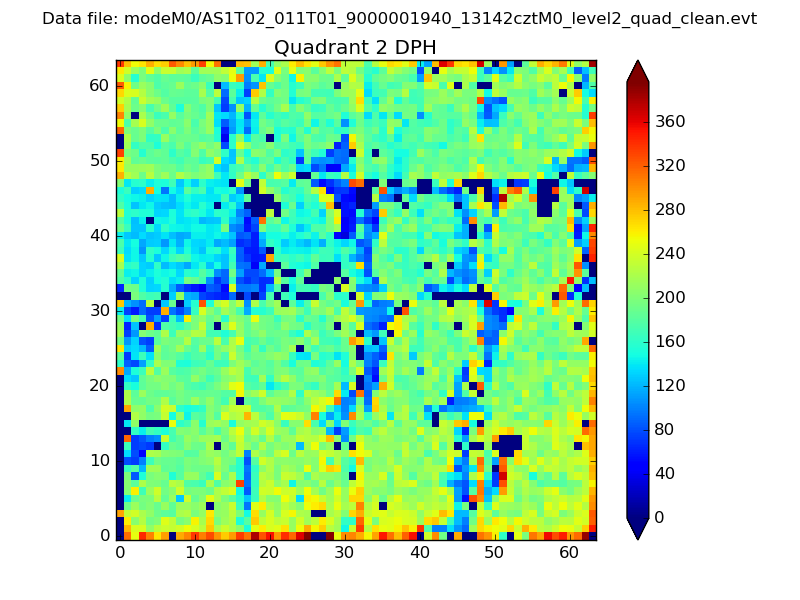
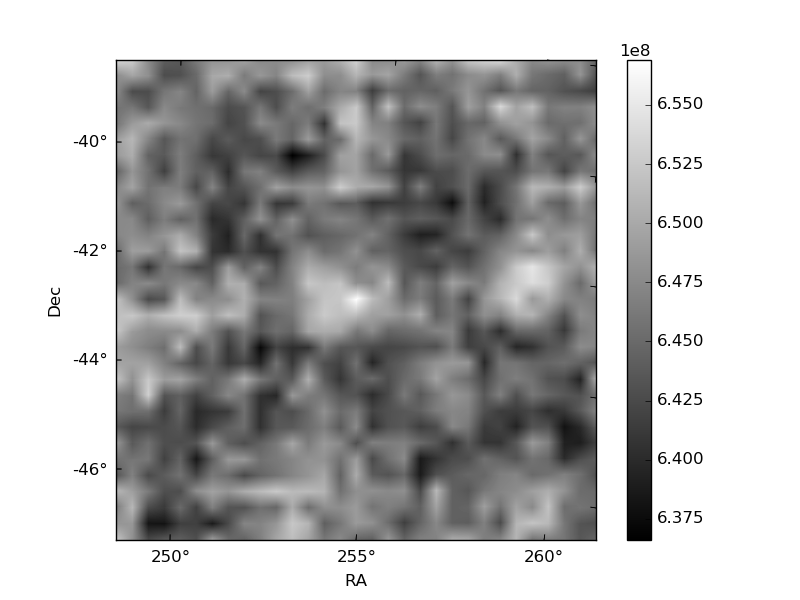
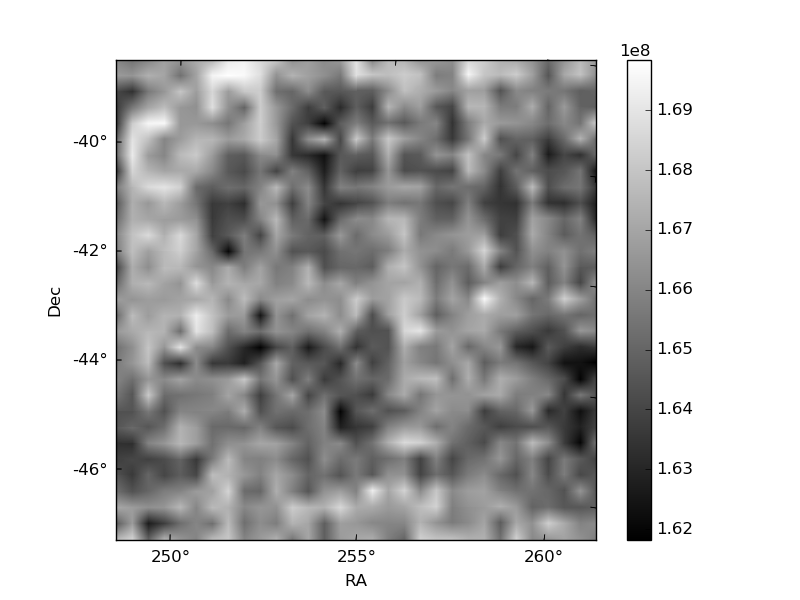
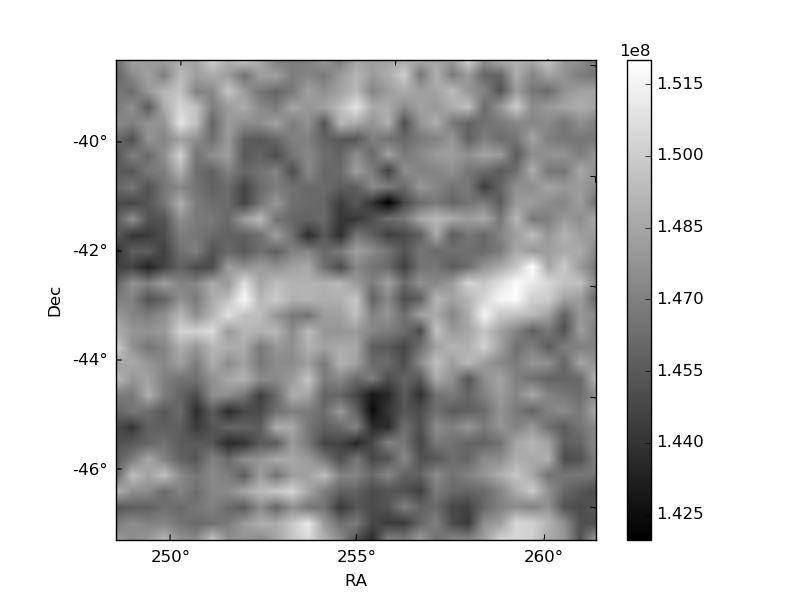
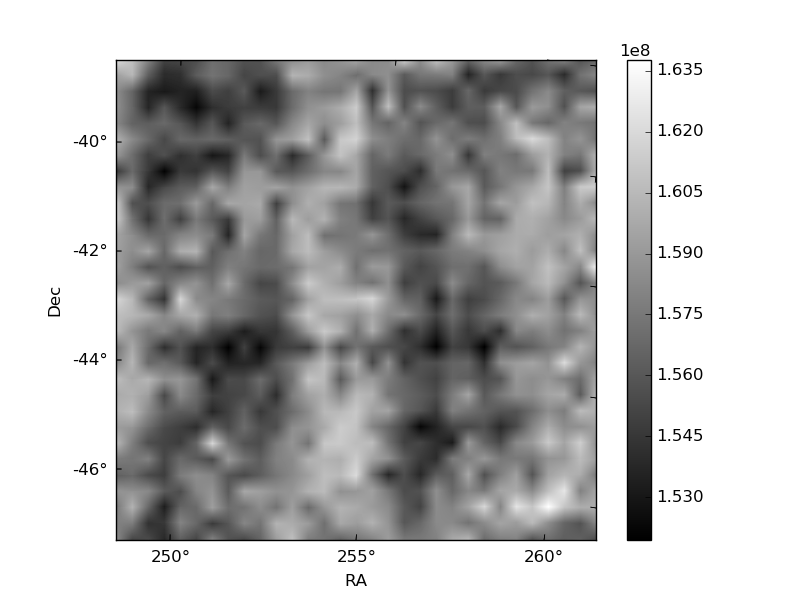
Histogram calculated using DETX and DETY for each event in the final _common_clean file
| Quadrant A | 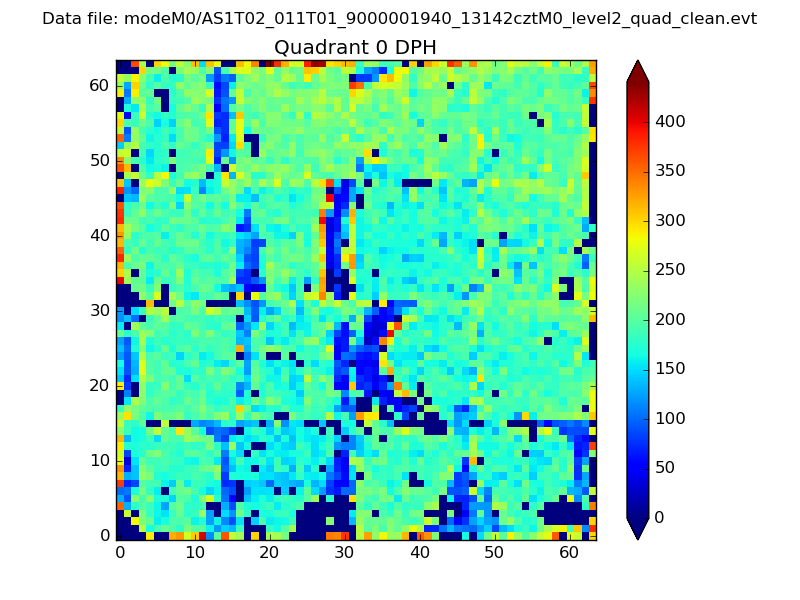 |
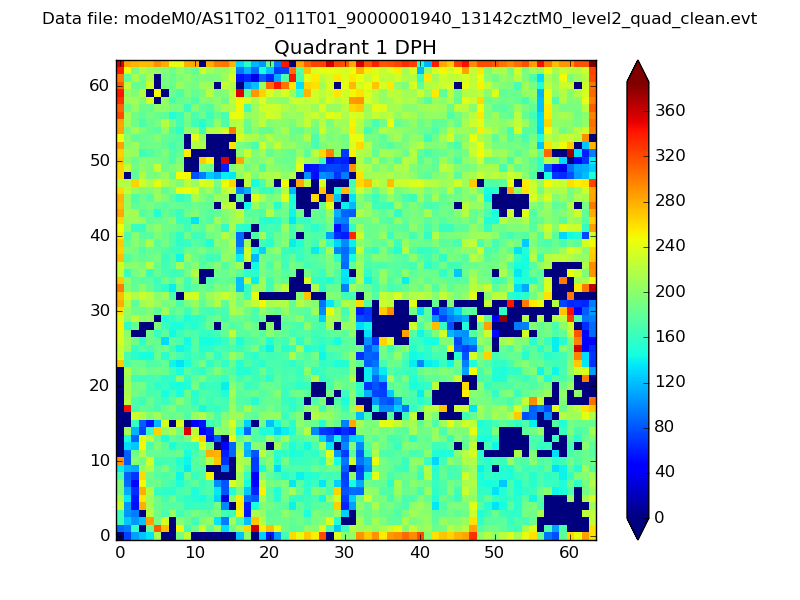 |
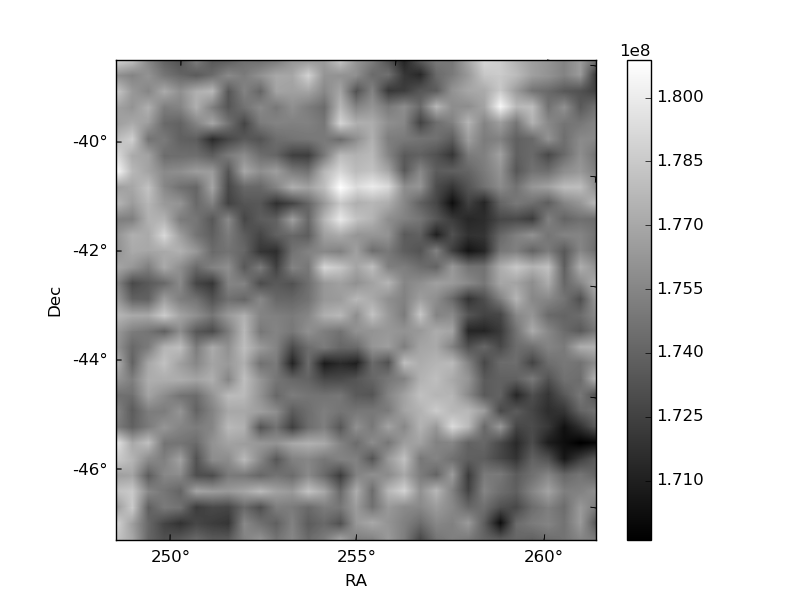
Quadrant B |
|---|---|---|---|
| Quadrant D | 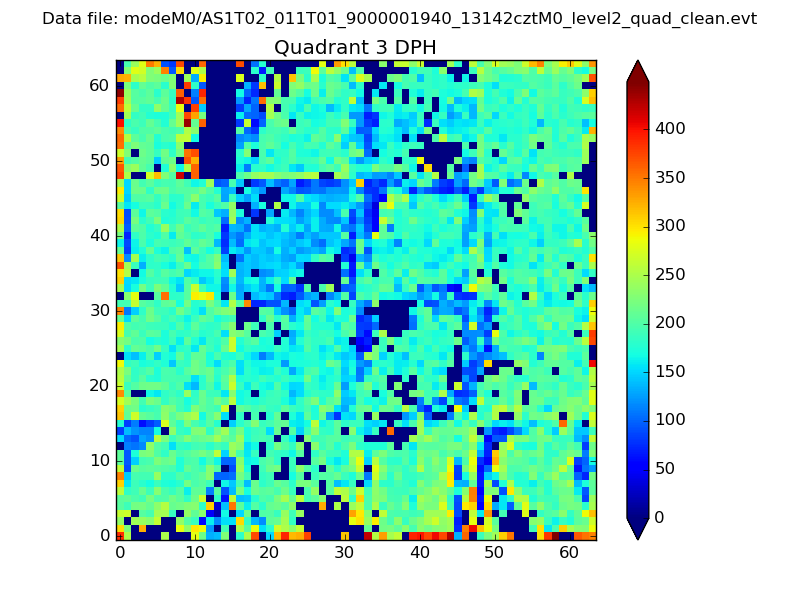 |
 |
Quadrant C |
| Plot type | Count rate plots | Images |
|---|---|---|
| Comparison with Poisson distribution Blue bars denote a histogram of data divided into 1 sec bins. Red curve is a Poisson curve with rate = median count rate of data. |
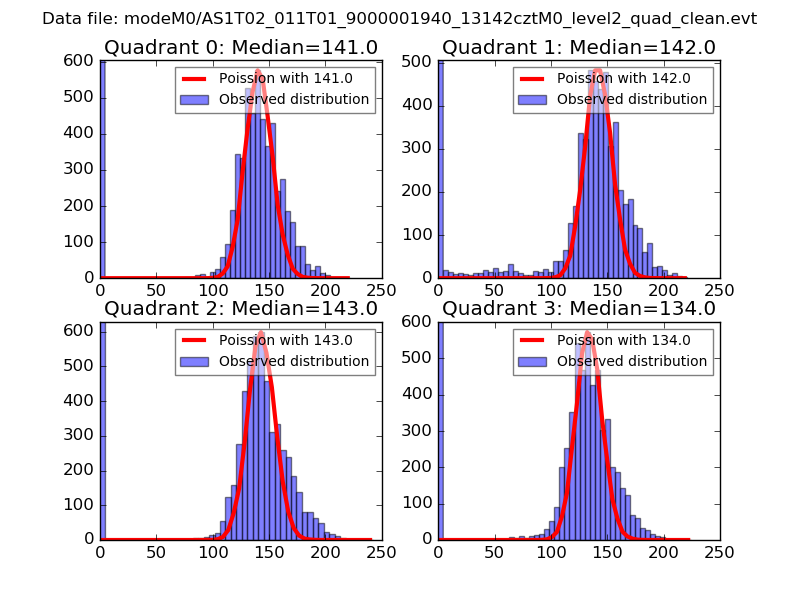 |
 |
| Quadrant-wise count rates Data is divided into 100 sec bins |
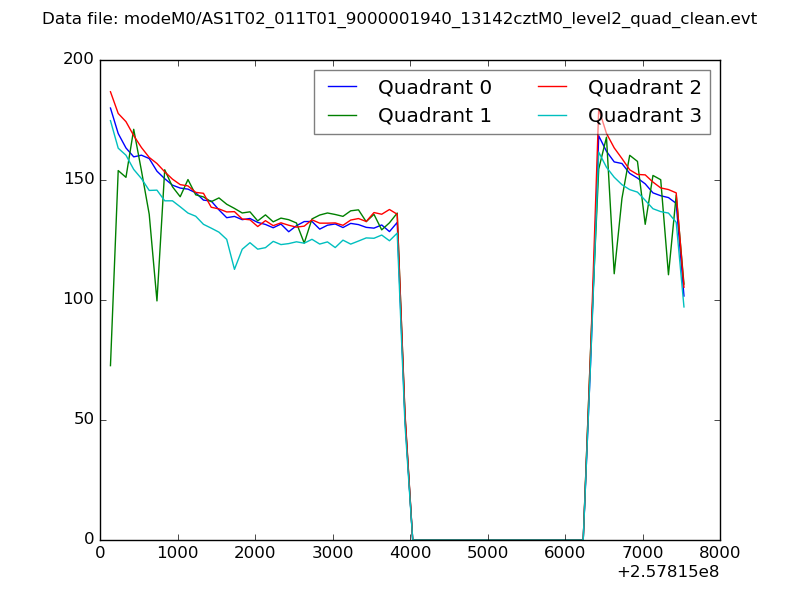 |
|
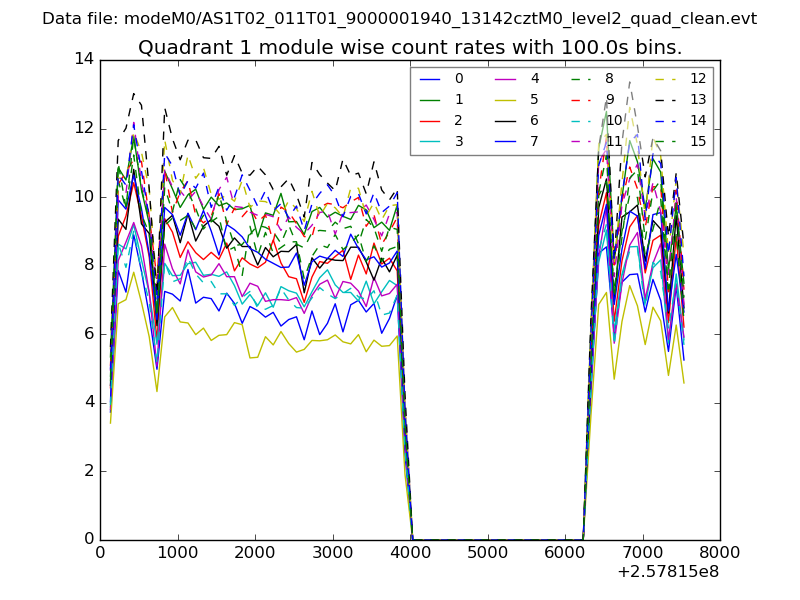
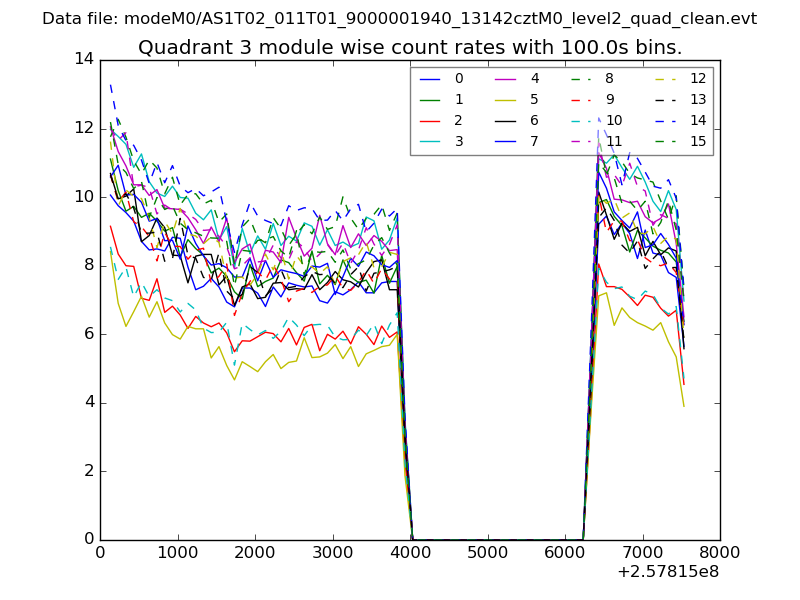
| Module-wise count rates for Quadrant A Data is divided into 100 sec bins |
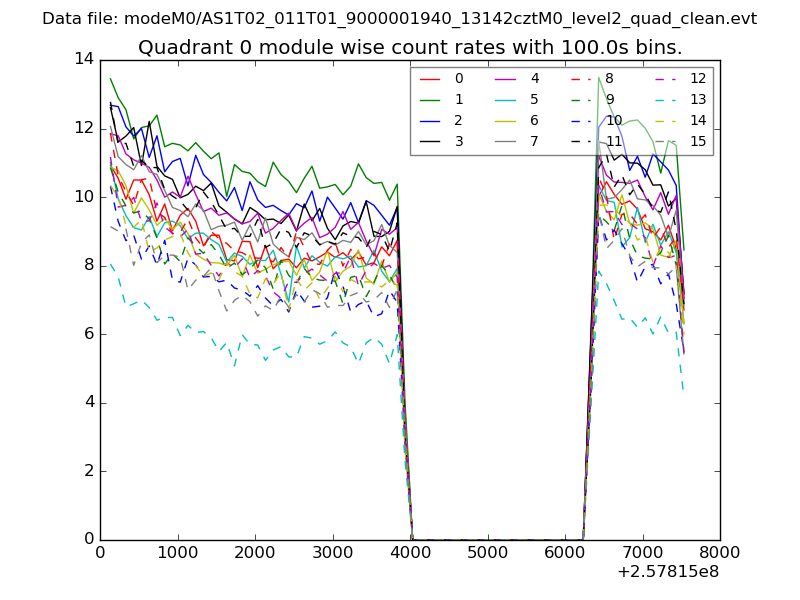 |
 |
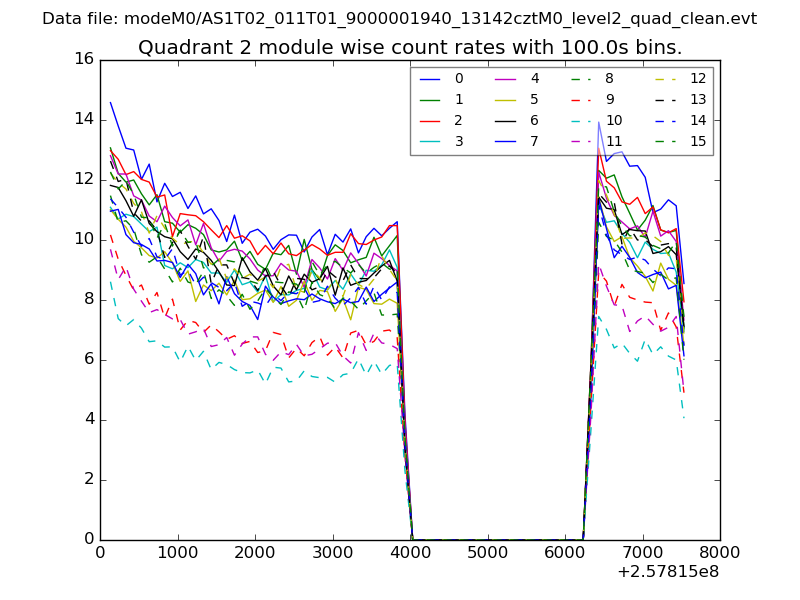
| Module-wise count rates for Quadrant B Data is divided into 100 sec bins |
 |
 |
| Module-wise count rates for Quadrant C Data is divided into 100 sec bins |
 |
 |
| Module-wise count rates for Quadrant D Data is divided into 100 sec bins |
 |
 |
| Parameter | Plot |
|---|---|
| CZT HV Monitor | 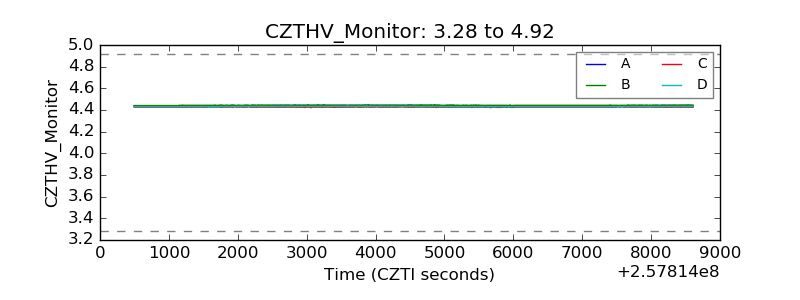 |
| D_VDD | 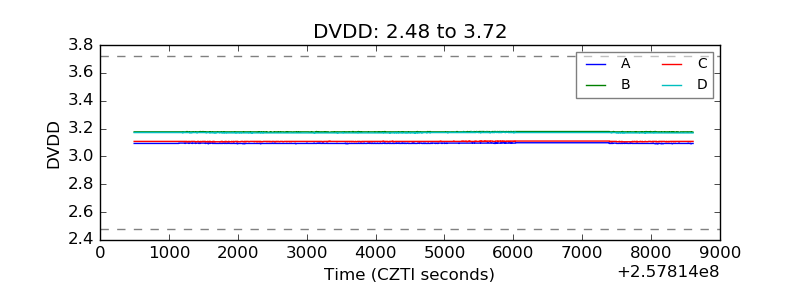 |
| Temperature 1 | 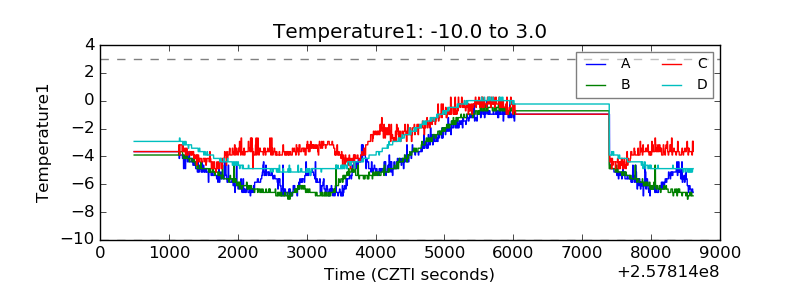 |
| Veto HV Monitor | 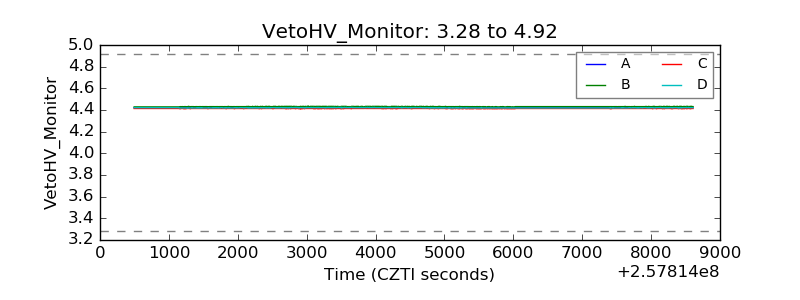 |
| Veto LLD | 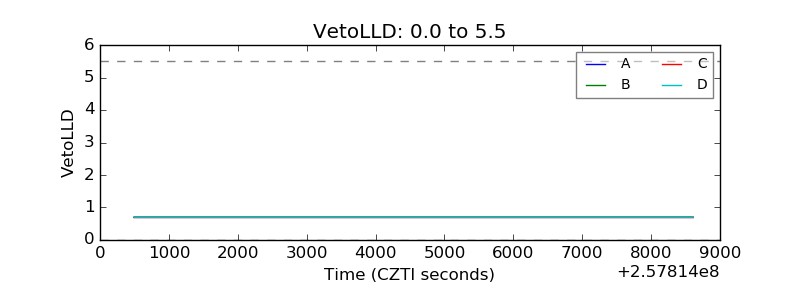 |
| Alpha Counter | 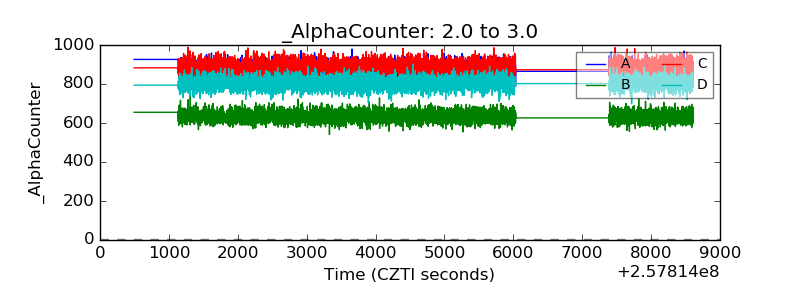 |
| _CPM_Rate |  |
| CZT Counter | 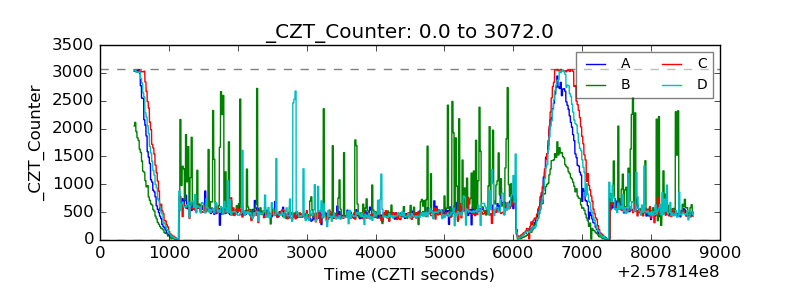 |
| +2.5 Volts monitor |  |
| +5 Volts monitor | 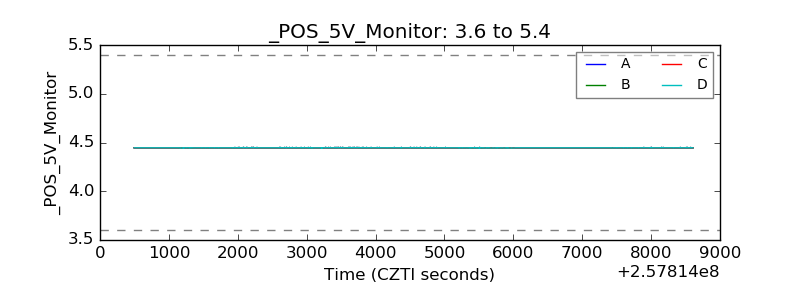 |
| _ROLL_ROT | 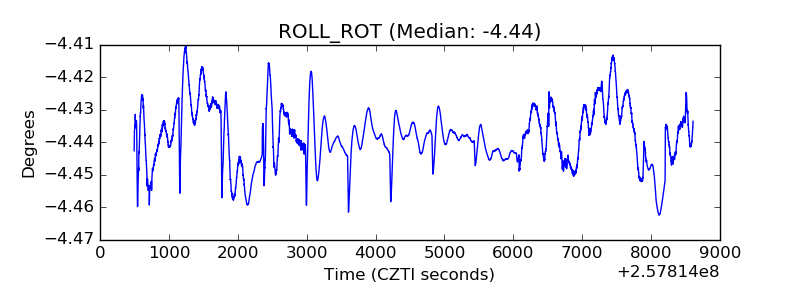 |
| _Roll_DEC | 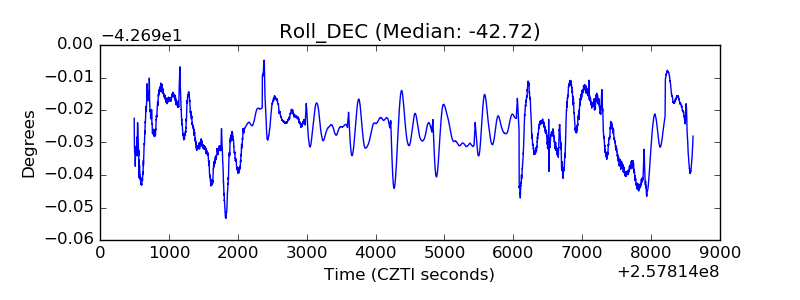 |
| _Roll_RA | 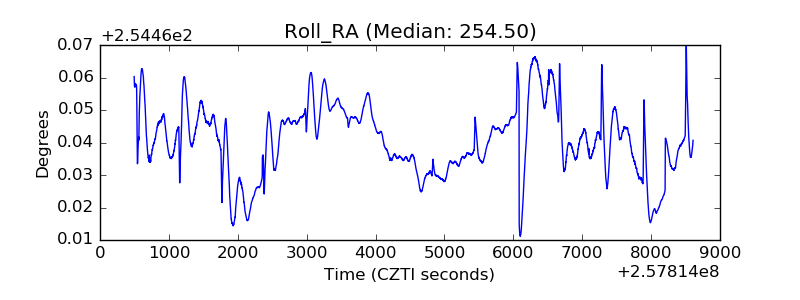 |
| Veto Counter | 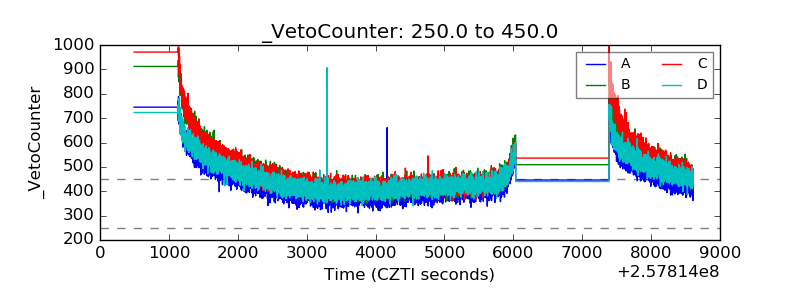 |