| Param | Original file | Final file |
|---|---|---|
| Filename | modeM0/AS1T02_011T01_9000001940_13143cztM0_level2.evt | modeM0/AS1T02_011T01_9000001940_13143cztM0_level2_quad_clean.evt |
| Size (bytes) | 504,838,080 | 99,688,320 |
| Size | 481.5 MB | 95.1 MB |
| Events in quadrant A | 3,128,462 | 659,504 |
| Events in quadrant B | 5,388,478 | 616,140 |
| Events in quadrant C | 2,985,236 | 677,150 |
| Events in quadrant D | 3,364,290 | 631,461 |
| Mode M9 | |||
|---|---|---|---|
| Quadrant | BADHDUFLAG | Total packets | Discarded packets |
| A | 0 | 20 | 0 |
| B | 0 | 20 | 0 |
| C | 0 | 20 | 0 |
| D | 0 | 21 | 0 |
| Mode M0 | |||
|---|---|---|---|
| Quadrant | BADHDUFLAG | Total packets | Discarded packets |
| A | 0 | 13198 | 3 |
| B | 0 | 20053 | 2 |
| C | 0 | 12801 | 2 |
| D | 0 | 14137 | 2 |
| Mode SS | |||
|---|---|---|---|
| Quadrant | BADHDUFLAG | Total packets | Discarded packets |
| A | 0 | 128 | 0 |
| B | 0 | 128 | 0 |
| C | 0 | 128 | 0 |
| D | 0 | 128 | 0 |
| Quadrant | Total seconds | Saturated seconds | Saturation percentage |
|---|---|---|---|
| A | 6219 | 19 | 0.305515% |
| B | 6219 | 975 | 15.677762% |
| C | 6219 | 10 | 0.160798% |
| D | 6219 | 24 | 0.385914% |
Noise dominated data is calculated using 1-second bins in cleaned event files. If a bin has >2000 counts, and if more than 50% of those come from <1% of pixels, then it is considered to be noise-dominated and hence unusable.
| Quadrant | # 1 sec bins | Bins with >0 counts | Bins with >2000 counts | High rate bins dominated by noise | Noise dominated (total time) | Noise dominated (detector-on time) | Marked lightcurve |
|---|---|---|---|---|---|---|---|
| A | 7540 | 6221 | 1 | 1 | 0.01% | 0.02% | 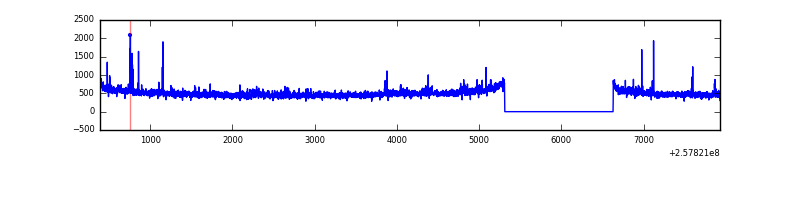 |
| B | 7540 | 6221 | 579 | 579 | 7.68% | 9.31% | 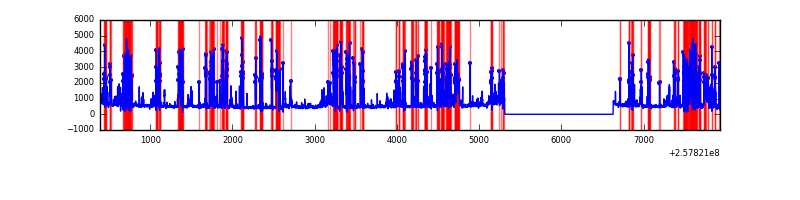 |
| C | 7540 | 6221 | 0 | 0 | 0.00% | 0.00% | 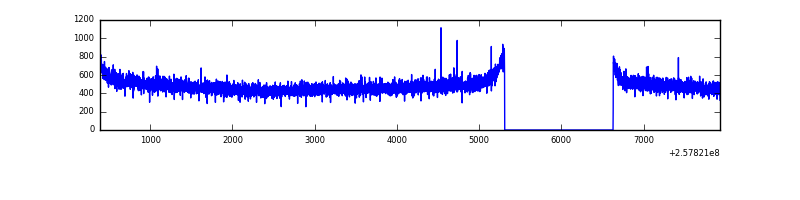 |
| D | 7540 | 6221 | 14 | 14 | 0.19% | 0.23% | 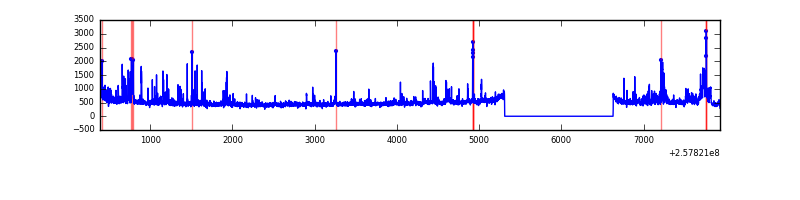 |
Top three noisy pixels from each quadrant. If the there are fewer than three noisy pixels in the level2.evt file, extra rows are filled as -1
| Pixel properties | Quadrant properties | ||||||
|---|---|---|---|---|---|---|---|
| Quadrant | DetID | PixID | Counts | Sigma | Mean | Median | Sigma |
| A | 12 | 189 | 107006 | 691.51 | 763 | 747 | 153.7 |
| A | 4 | 2 | 25659 | 162.12 | 763 | 747 | 153.7 |
| A | 0 | 23 | 18853 | 117.83 | 763 | 747 | 153.7 |
| B | 4 | 239 | 2239739 | 16987.24 | 710 | 693 | 131.8 |
| B | 0 | 85 | 249997 | 1891.42 | 710 | 693 | 131.8 |
| B | 4 | 173 | 41346 | 308.43 | 710 | 693 | 131.8 |
| C | 13 | 61 | 5468 | 26.58 | 765 | 771 | 176.7 |
| C | 8 | 222 | 2477 | 9.66 | 765 | 771 | 176.7 |
| C | 3 | 202 | 1988 | 6.89 | 765 | 771 | 176.7 |
| D | 1 | 52 | 198812 | 1122.56 | 747 | 729 | 176.5 |
| D | 12 | 221 | 178632 | 1008.2 | 747 | 729 | 176.5 |
| D | 8 | 195 | 63945 | 358.25 | 747 | 729 | 176.5 |
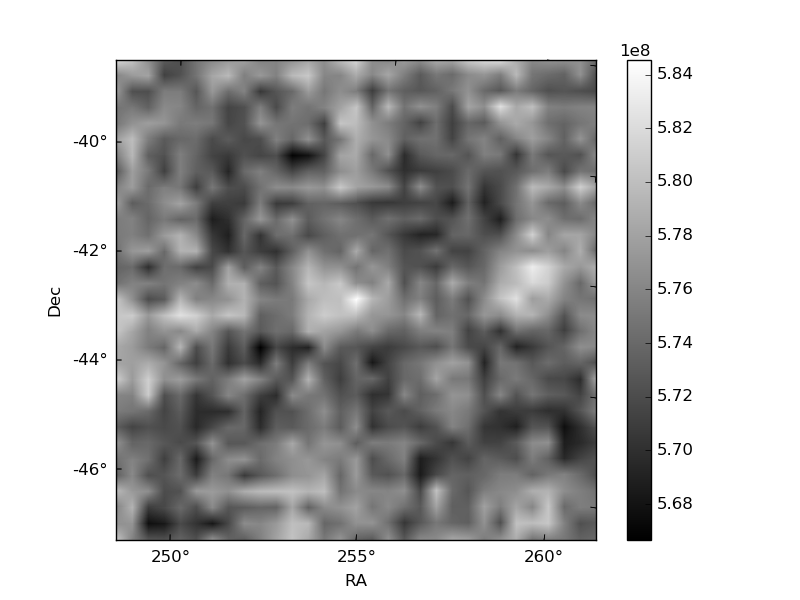
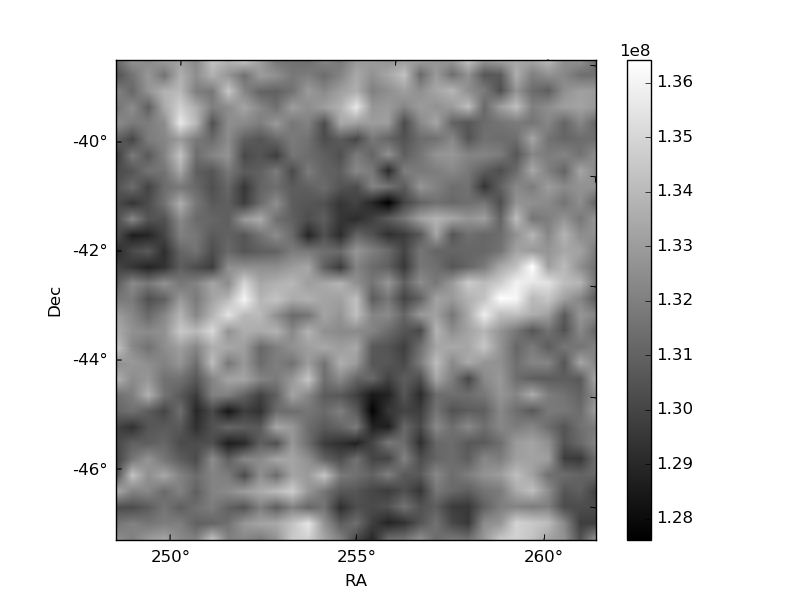
Histogram calculated using DETX and DETY for each event in the final _common_clean file
| Quadrant A | 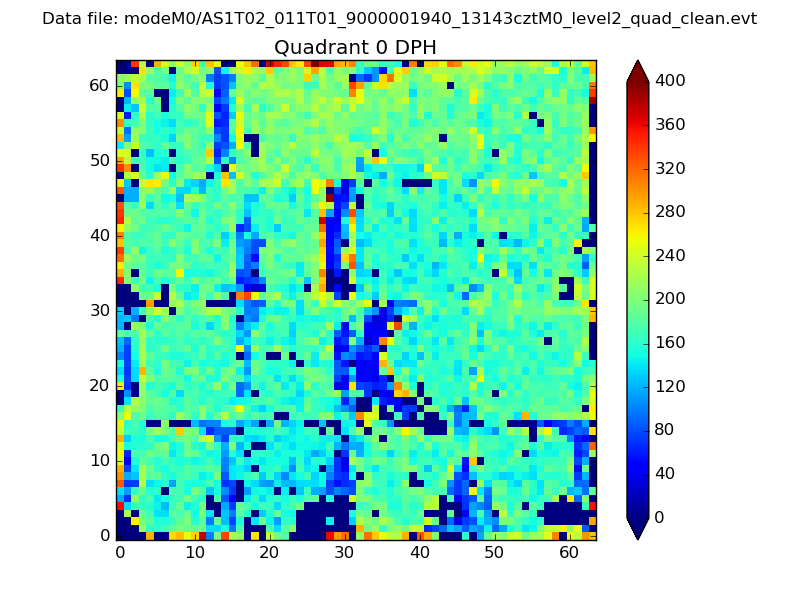 |
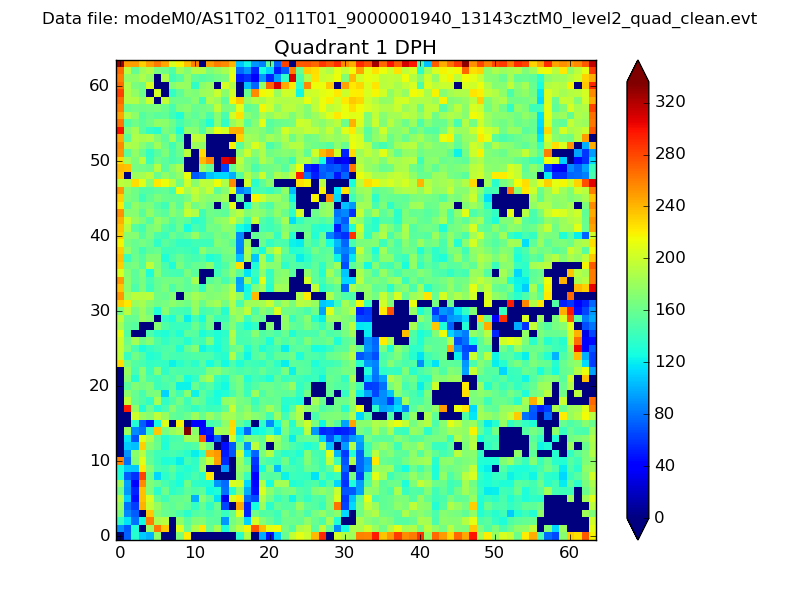 |
Quadrant B |
|---|---|---|---|
| Quadrant D | 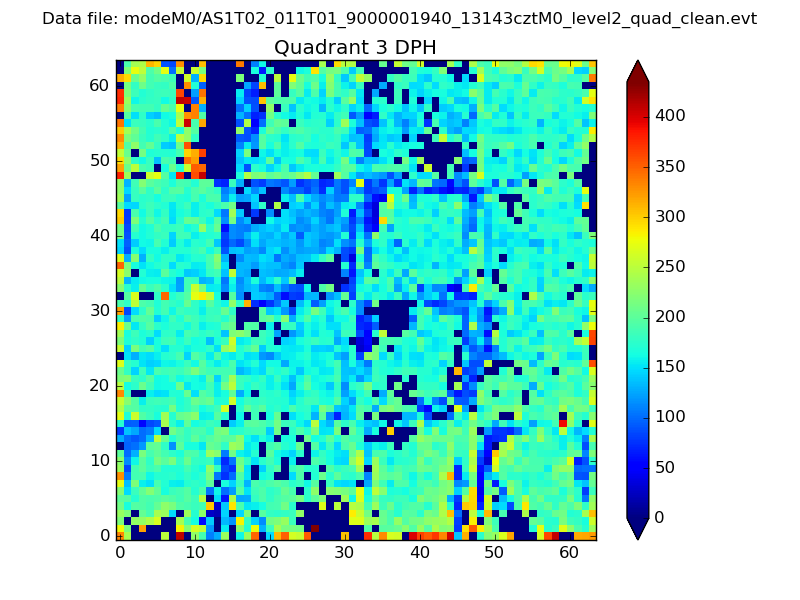 |
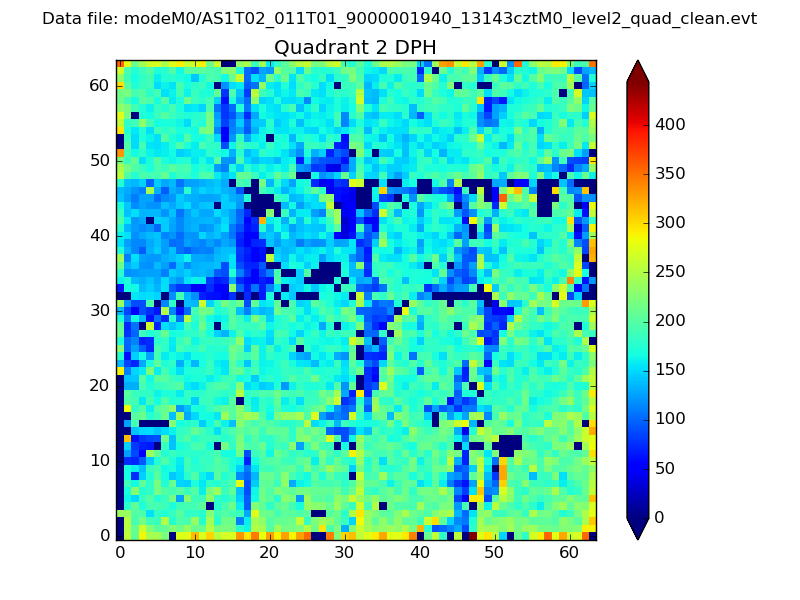 |
Quadrant C |
| Plot type | Count rate plots | Images |
|---|---|---|
| Comparison with Poisson distribution Blue bars denote a histogram of data divided into 1 sec bins. Red curve is a Poisson curve with rate = median count rate of data. |
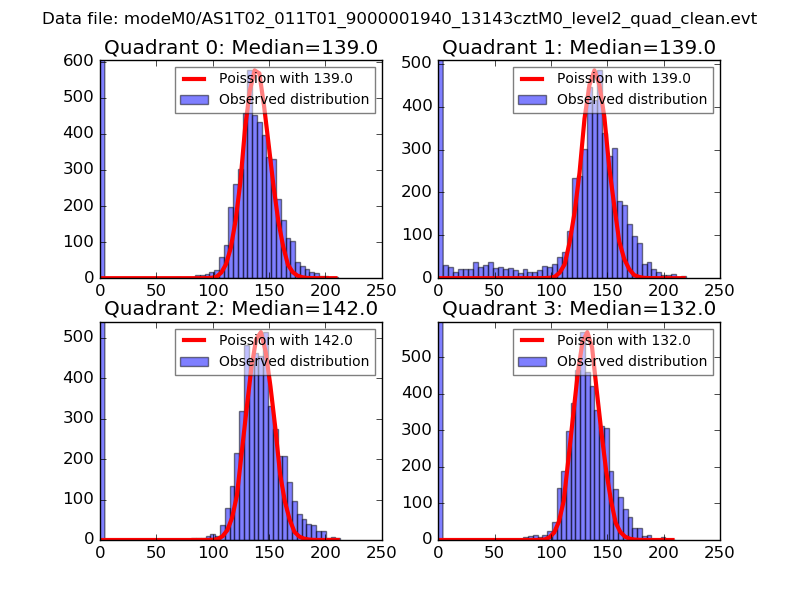 |
 |
| Quadrant-wise count rates Data is divided into 100 sec bins |
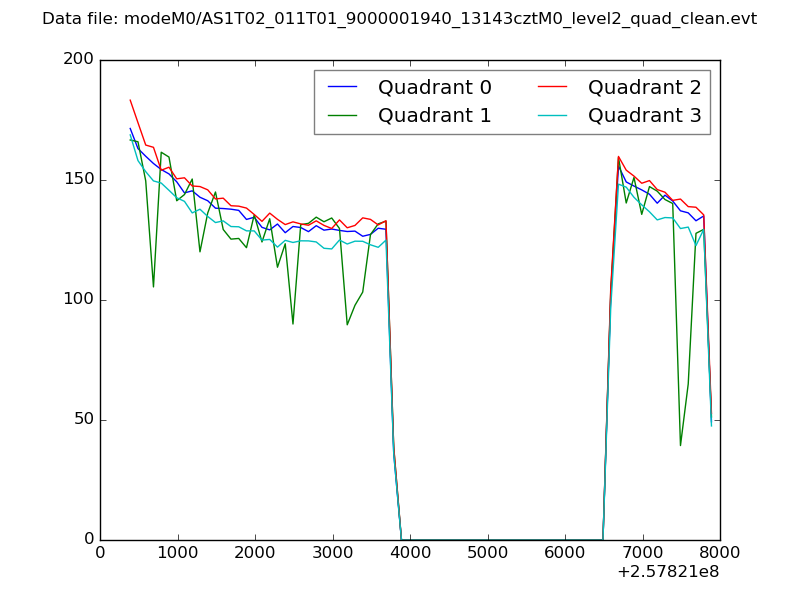 |
|
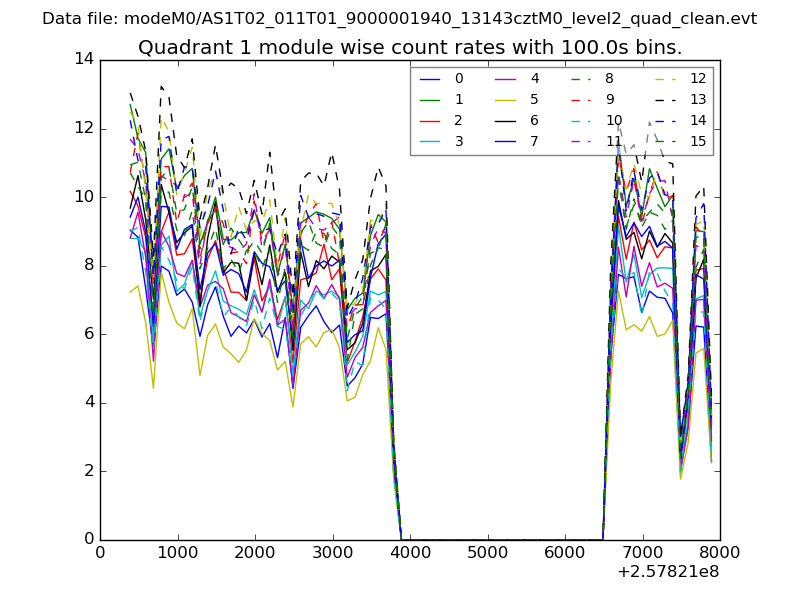
| Module-wise count rates for Quadrant A Data is divided into 100 sec bins |
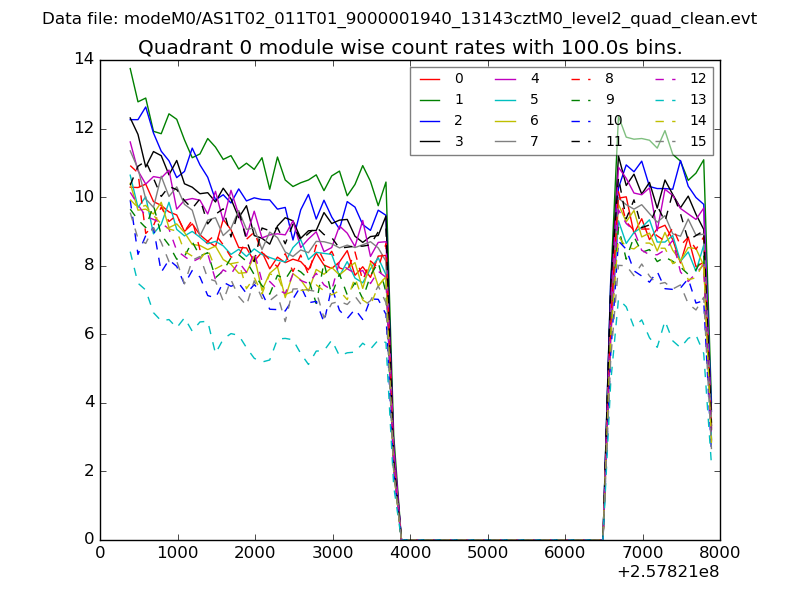 |
 |
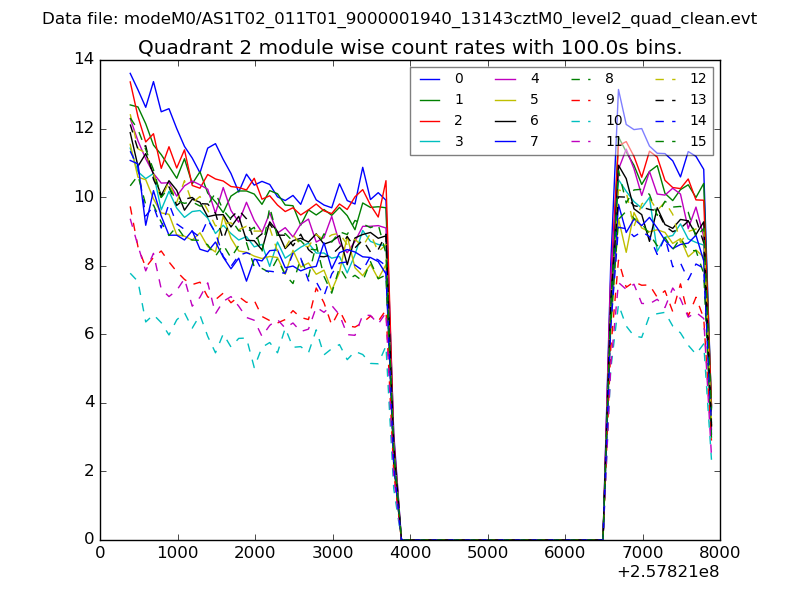
| Module-wise count rates for Quadrant B Data is divided into 100 sec bins |
 |
 |
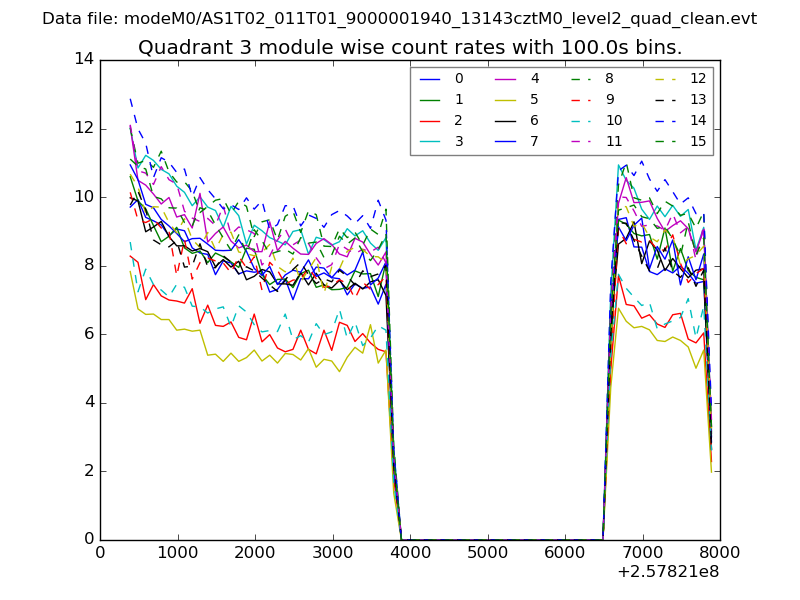
| Module-wise count rates for Quadrant C Data is divided into 100 sec bins |
 |
 |
| Module-wise count rates for Quadrant D Data is divided into 100 sec bins |
 |
 |
| Parameter | Plot |
|---|---|
| CZT HV Monitor |  |
| D_VDD | 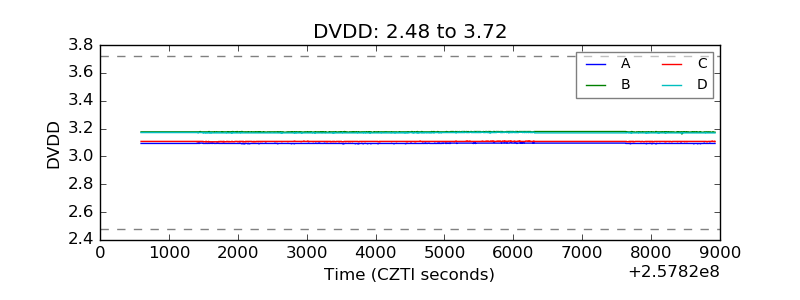 |
| Temperature 1 | 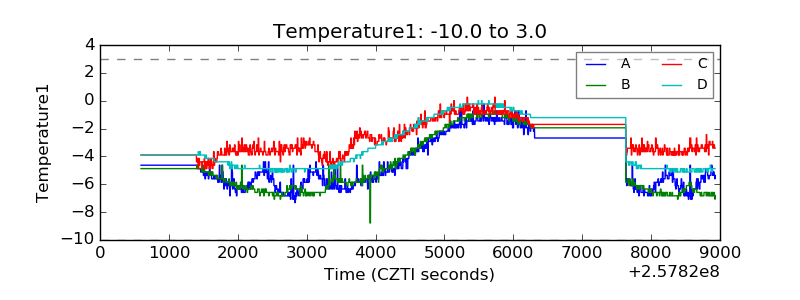 |
| Veto HV Monitor | 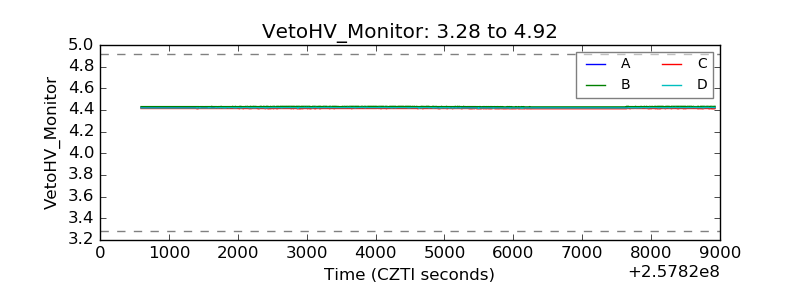 |
| Veto LLD | 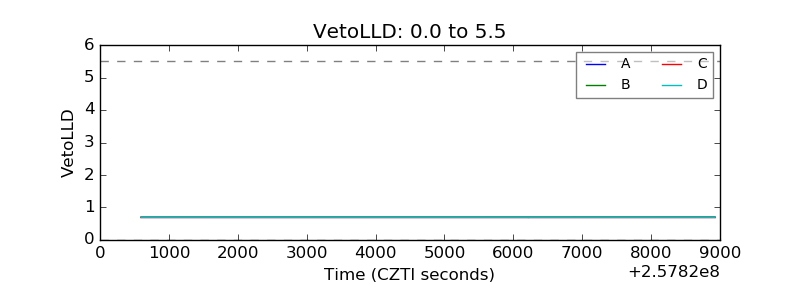 |
| Alpha Counter | 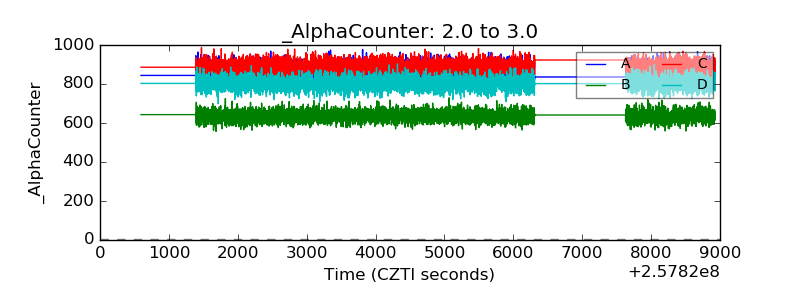 |
| _CPM_Rate | 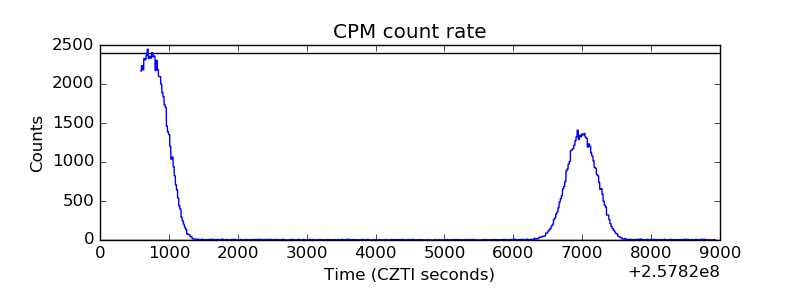 |
| CZT Counter | 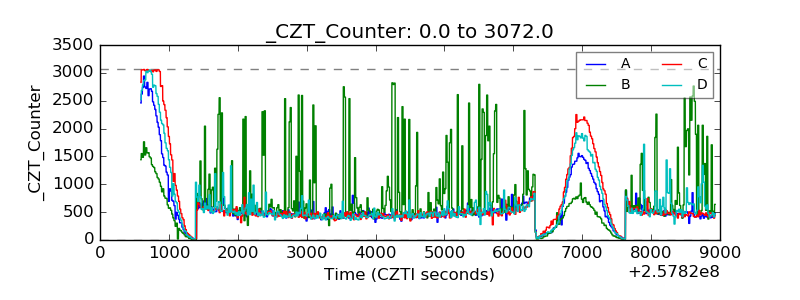 |
| +2.5 Volts monitor |  |
| +5 Volts monitor | 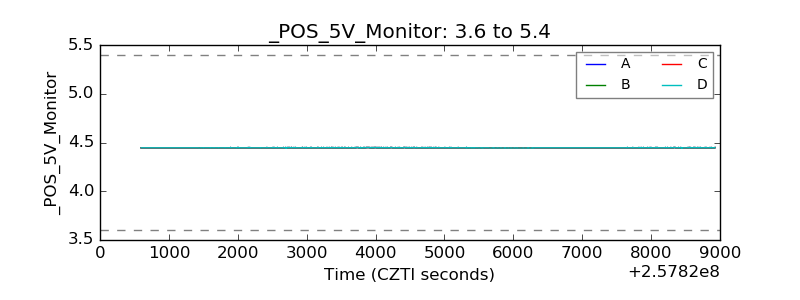 |
| _ROLL_ROT | 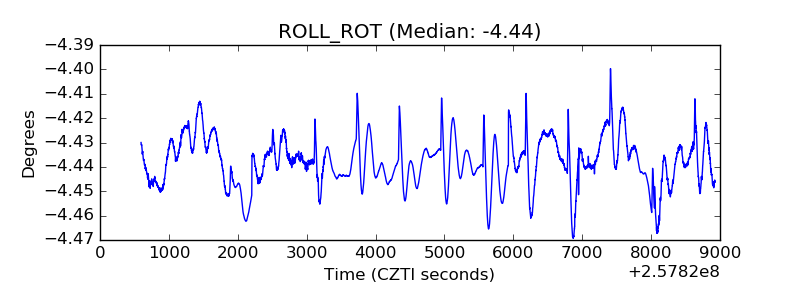 |
| _Roll_DEC | 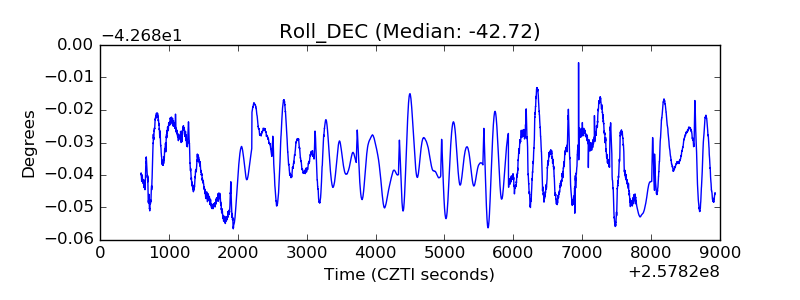 |
| _Roll_RA | 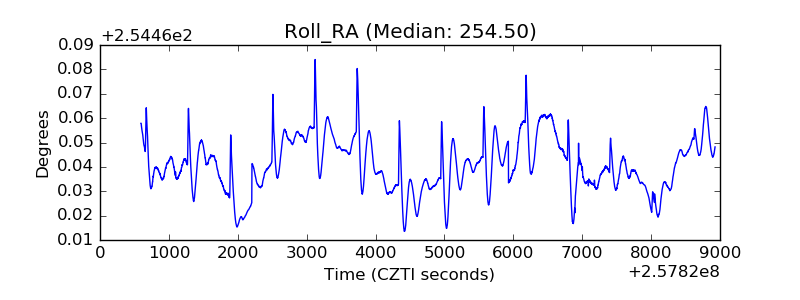 |
| Veto Counter | 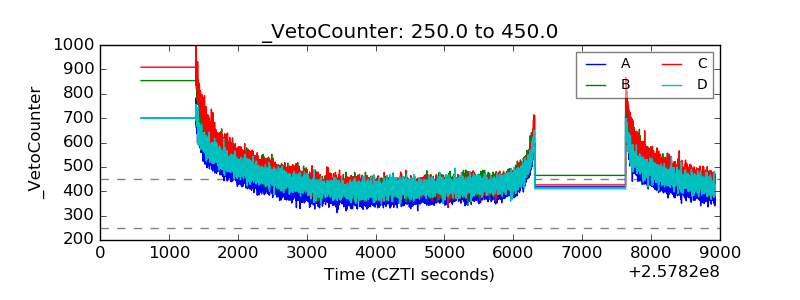 |