| Param | Original file | Final file |
|---|---|---|
| Filename | modeM0/AS1T02_011T01_9000001940_13144cztM0_level2.evt | modeM0/AS1T02_011T01_9000001940_13144cztM0_level2_quad_clean.evt |
| Size (bytes) | 468,331,200 | 84,332,160 |
| Size | 446.6 MB | 80.4 MB |
| Events in quadrant A | 3,007,805 | 544,434 |
| Events in quadrant B | 4,937,489 | 509,399 |
| Events in quadrant C | 2,838,440 | 556,158 |
| Events in quadrant D | 2,988,616 | 521,033 |
| Mode M9 | |||
|---|---|---|---|
| Quadrant | BADHDUFLAG | Total packets | Discarded packets |
| A | 0 | 11 | 0 |
| B | 0 | 11 | 0 |
| C | 0 | 11 | 0 |
| D | 0 | 11 | 0 |
| Mode M0 | |||
|---|---|---|---|
| Quadrant | BADHDUFLAG | Total packets | Discarded packets |
| A | 0 | 12839 | 2 |
| B | 0 | 18616 | 1 |
| C | 0 | 12430 | 1 |
| D | 0 | 13026 | 1 |
| Mode SS | |||
|---|---|---|---|
| Quadrant | BADHDUFLAG | Total packets | Discarded packets |
| A | 0 | 122 | 0 |
| B | 0 | 122 | 0 |
| C | 0 | 122 | 0 |
| D | 0 | 122 | 0 |
| Quadrant | Total seconds | Saturated seconds | Saturation percentage |
|---|---|---|---|
| A | 6053 | 40 | 0.660829% |
| B | 6053 | 786 | 12.985297% |
| C | 6053 | 35 | 0.578226% |
| D | 6053 | 35 | 0.578226% |
Noise dominated data is calculated using 1-second bins in cleaned event files. If a bin has >2000 counts, and if more than 50% of those come from <1% of pixels, then it is considered to be noise-dominated and hence unusable.
| Quadrant | # 1 sec bins | Bins with >0 counts | Bins with >2000 counts | High rate bins dominated by noise | Noise dominated (total time) | Noise dominated (detector-on time) | Marked lightcurve |
|---|---|---|---|---|---|---|---|
| A | 7149 | 6055 | 0 | 0 | 0.00% | 0.00% | 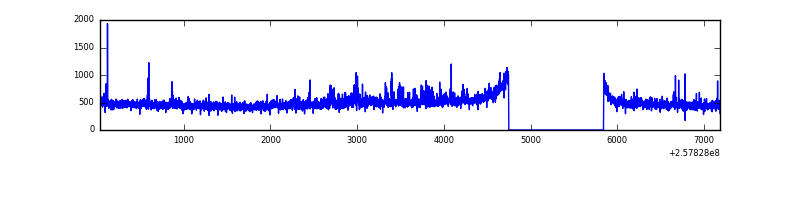 |
| B | 7149 | 6055 | 462 | 462 | 6.46% | 7.63% | 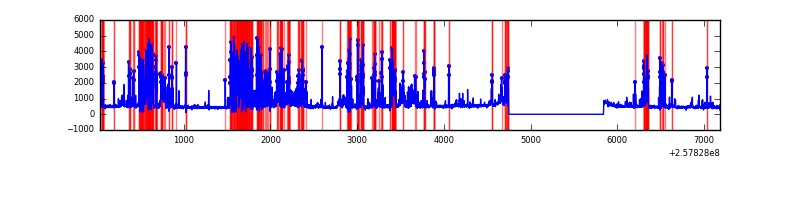 |
| C | 7149 | 6055 | 0 | 0 | 0.00% | 0.00% | 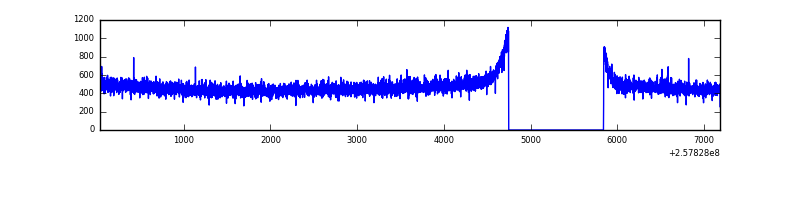 |
| D | 7149 | 6055 | 4 | 4 | 0.06% | 0.07% | 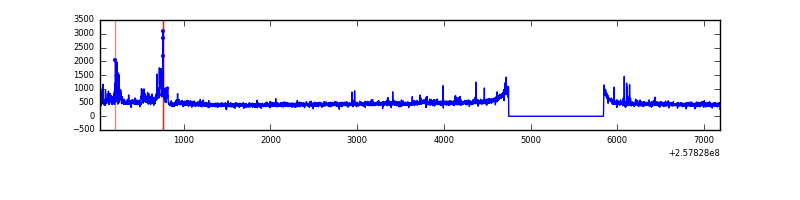 |
Top three noisy pixels from each quadrant. If the there are fewer than three noisy pixels in the level2.evt file, extra rows are filled as -1
| Pixel properties | Quadrant properties | ||||||
|---|---|---|---|---|---|---|---|
| Quadrant | DetID | PixID | Counts | Sigma | Mean | Median | Sigma |
| A | 12 | 189 | 126089 | 853.96 | 727 | 712 | 146.8 |
| A | 1 | 162 | 22935 | 151.36 | 727 | 712 | 146.8 |
| A | 0 | 23 | 13246 | 85.37 | 727 | 712 | 146.8 |
| B | 4 | 239 | 1799048 | 13756.94 | 686 | 668 | 130.7 |
| B | 0 | 85 | 284195 | 2168.87 | 686 | 668 | 130.7 |
| B | 3 | 64 | 66818 | 506.02 | 686 | 668 | 130.7 |
| C | 0 | 207 | 5308 | 27.17 | 726 | 733 | 168.4 |
| C | 13 | 61 | 5289 | 27.05 | 726 | 733 | 168.4 |
| C | 8 | 222 | 2227 | 8.87 | 726 | 733 | 168.4 |
| D | 12 | 221 | 182604 | 1058.99 | 716 | 697 | 171.8 |
| D | 14 | 34 | 40222 | 230.1 | 716 | 697 | 171.8 |
| D | 8 | 195 | 24221 | 136.95 | 716 | 697 | 171.8 |
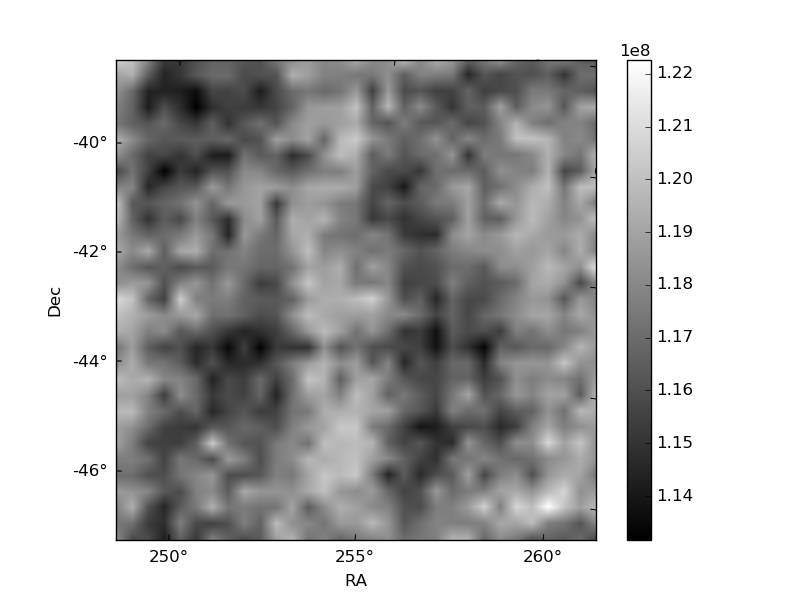
Histogram calculated using DETX and DETY for each event in the final _common_clean file
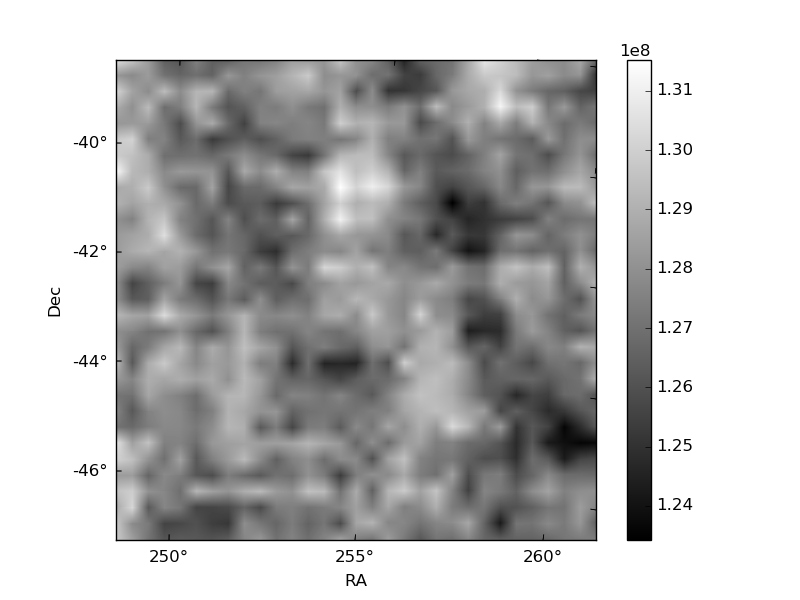
| Quadrant A | 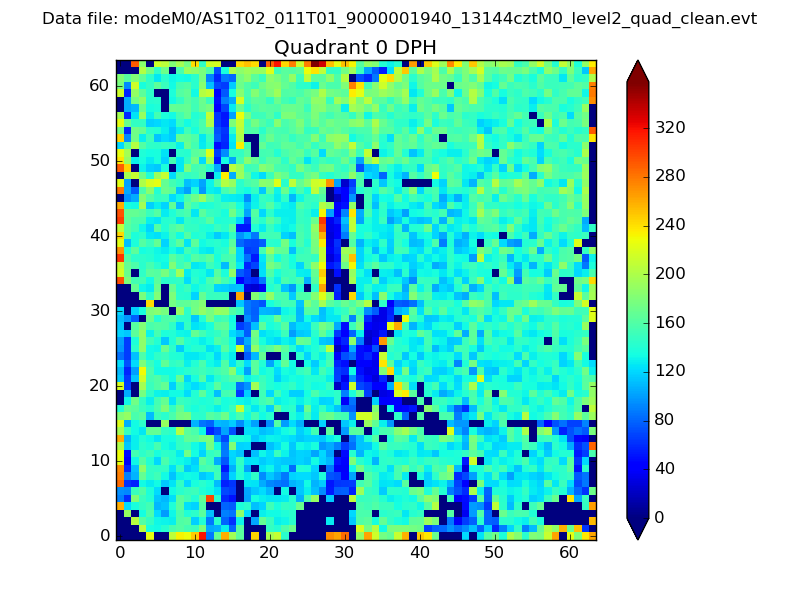 |
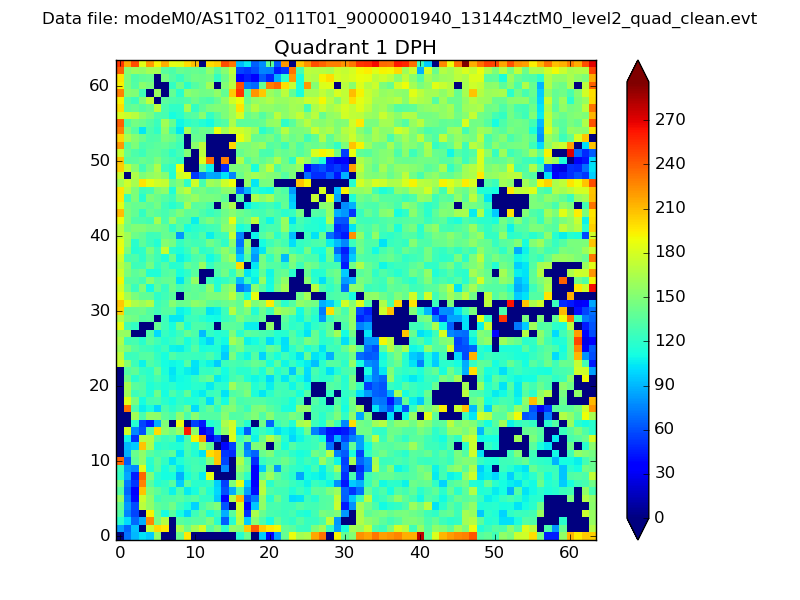 |
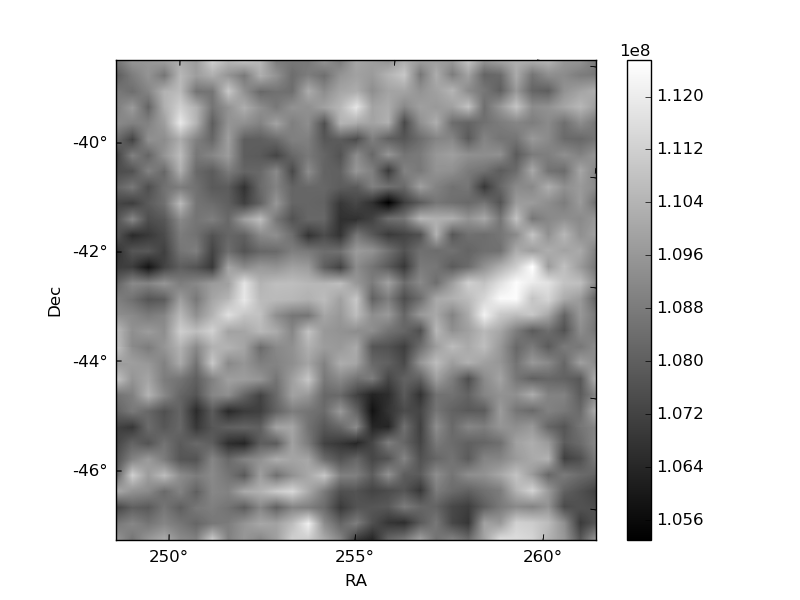
Quadrant B |
|---|---|---|---|
| Quadrant D | 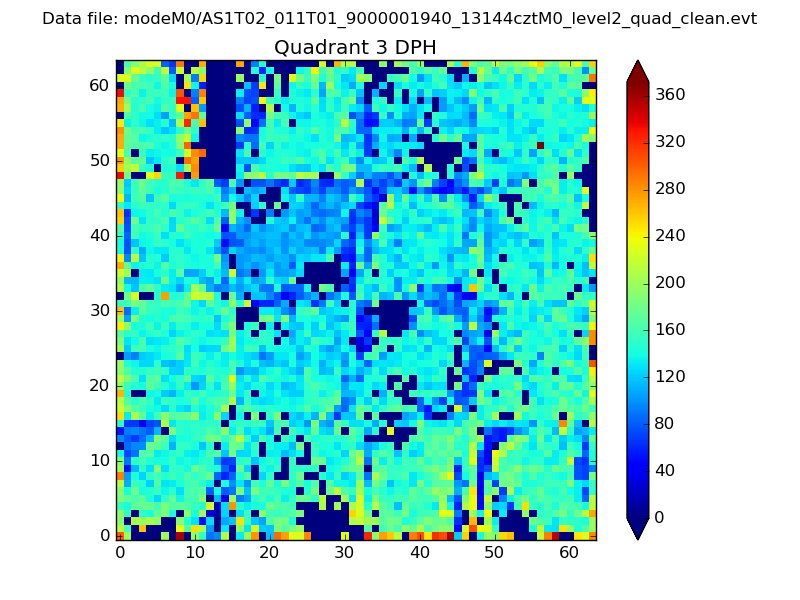 |
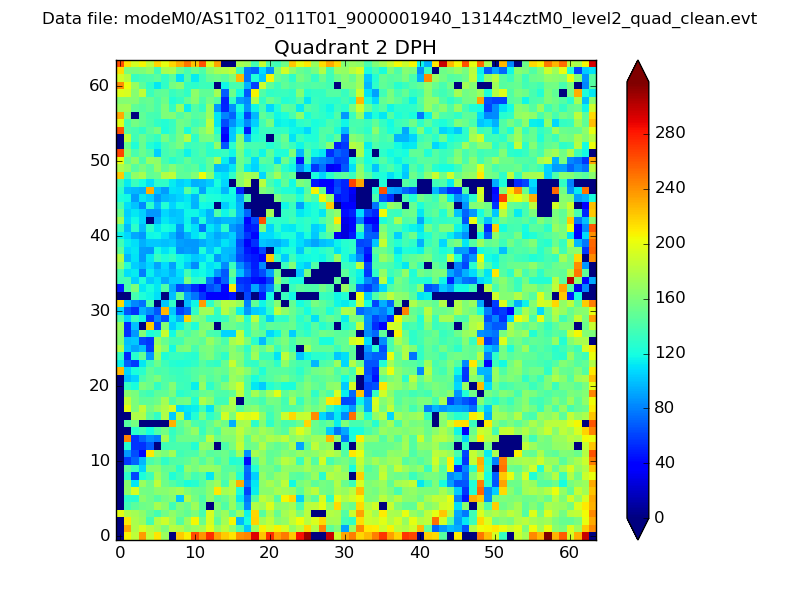 |
Quadrant C |
| Plot type | Count rate plots | Images |
|---|---|---|
| Comparison with Poisson distribution Blue bars denote a histogram of data divided into 1 sec bins. Red curve is a Poisson curve with rate = median count rate of data. |
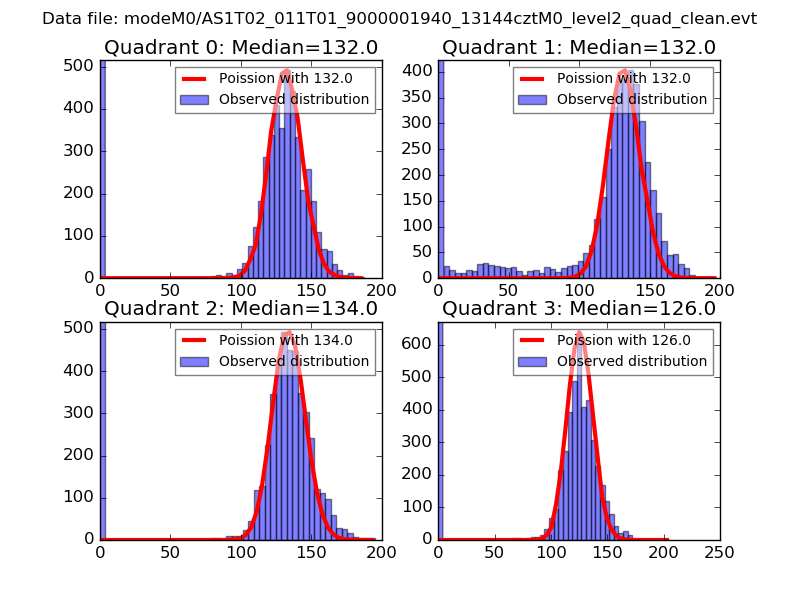 |
 |
| Quadrant-wise count rates Data is divided into 100 sec bins |
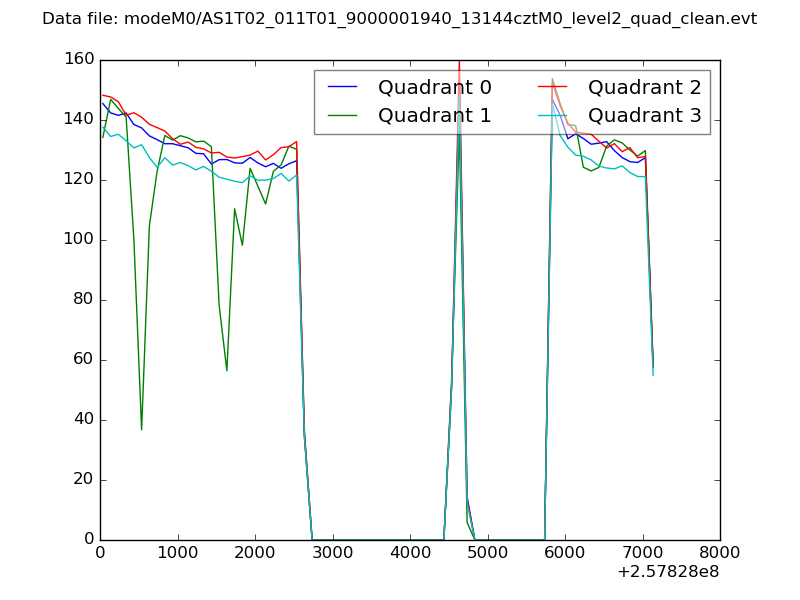 |
|
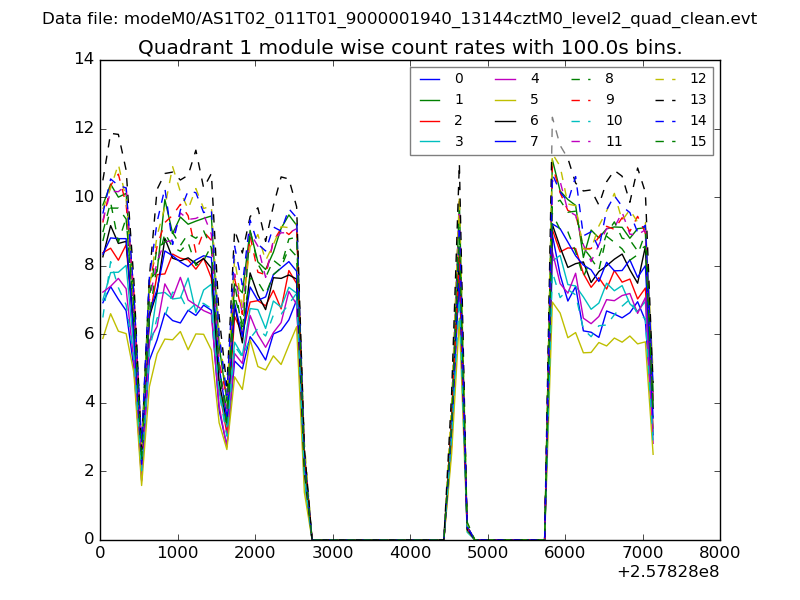
| Module-wise count rates for Quadrant A Data is divided into 100 sec bins |
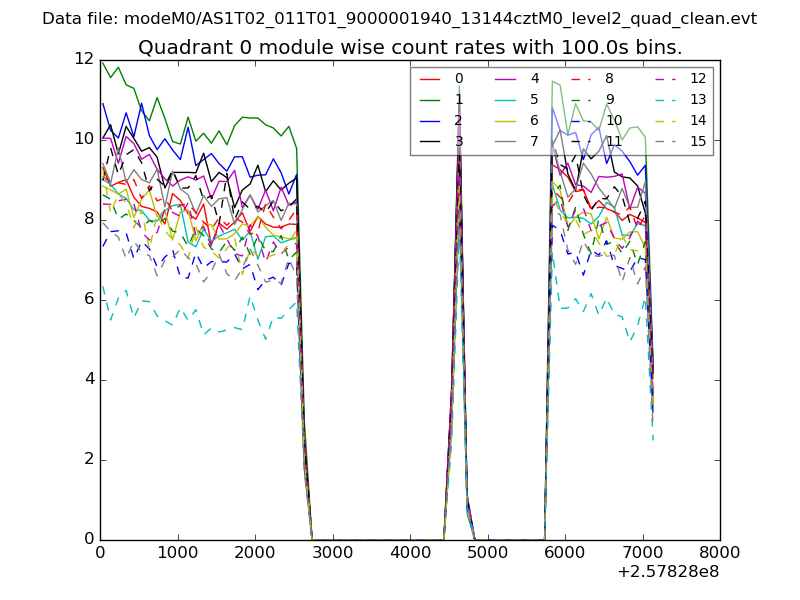 |
 |
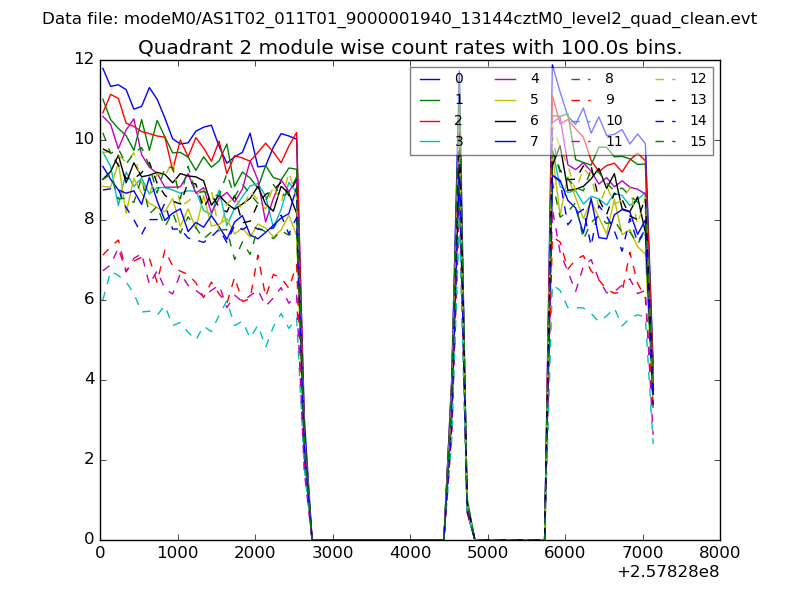
| Module-wise count rates for Quadrant B Data is divided into 100 sec bins |
 |
 |
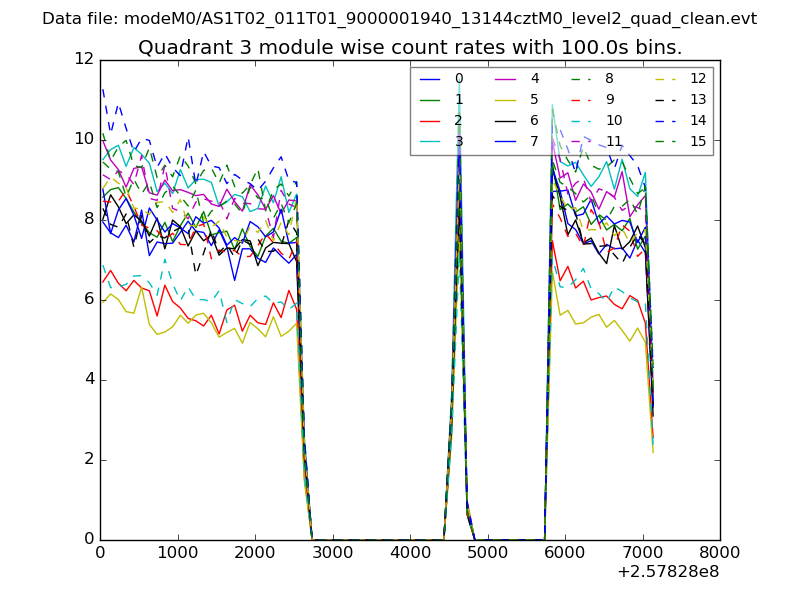
| Module-wise count rates for Quadrant C Data is divided into 100 sec bins |
 |
 |
| Module-wise count rates for Quadrant D Data is divided into 100 sec bins |
 |
 |
| Parameter | Plot |
|---|---|
| CZT HV Monitor | 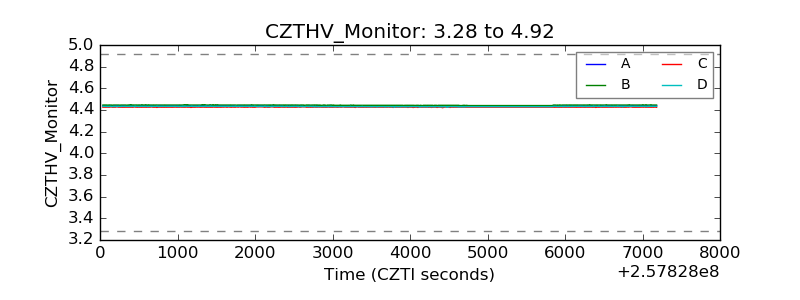 |
| D_VDD | 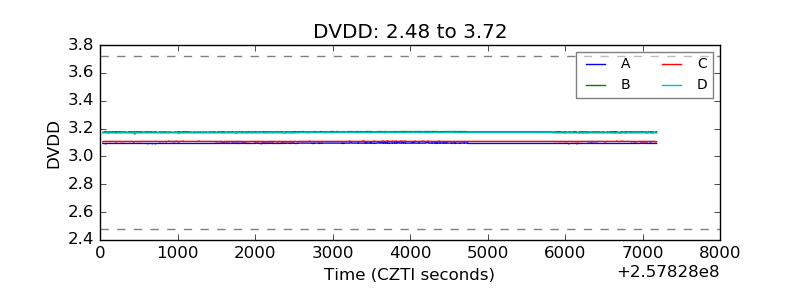 |
| Temperature 1 | 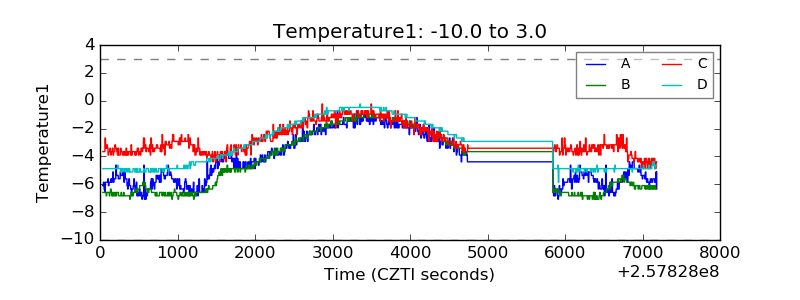 |
| Veto HV Monitor | 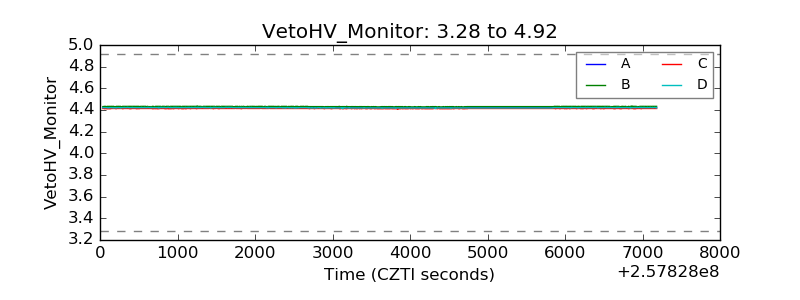 |
| Veto LLD | 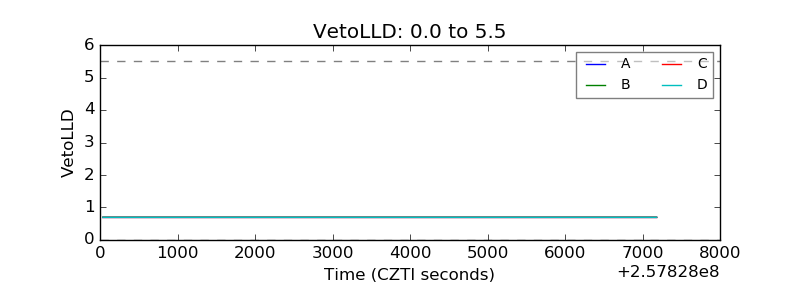 |
| Alpha Counter | 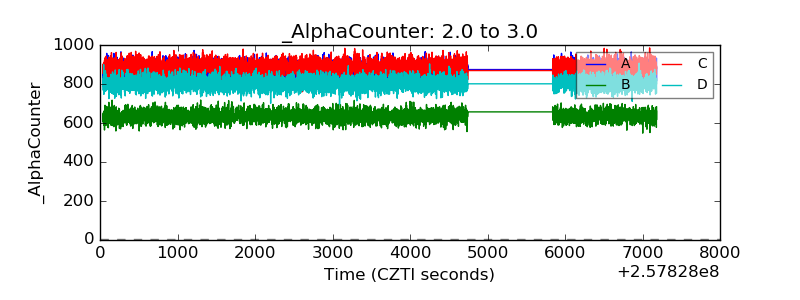 |
| _CPM_Rate | 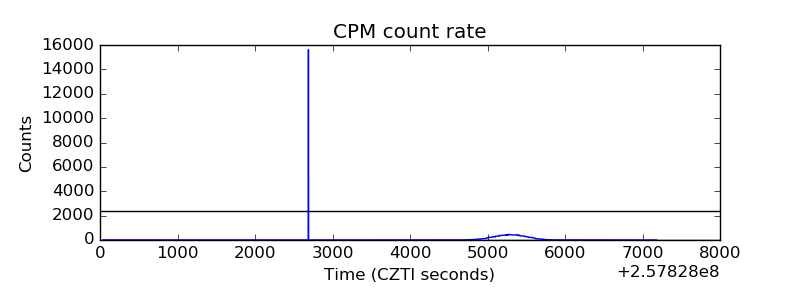 |
| CZT Counter | 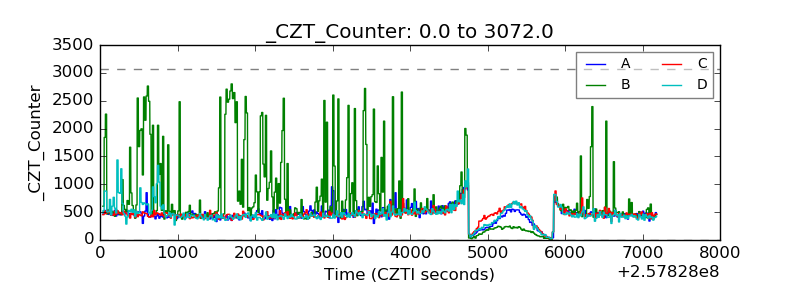 |
| +2.5 Volts monitor | 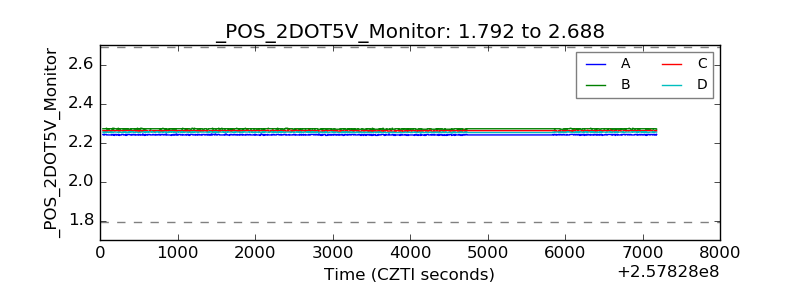 |
| +5 Volts monitor |  |
| _ROLL_ROT | 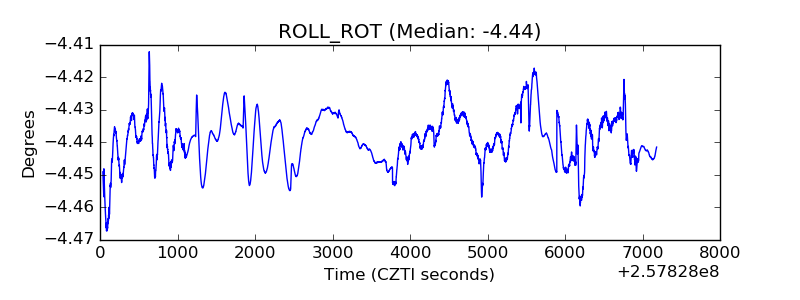 |
| _Roll_DEC | 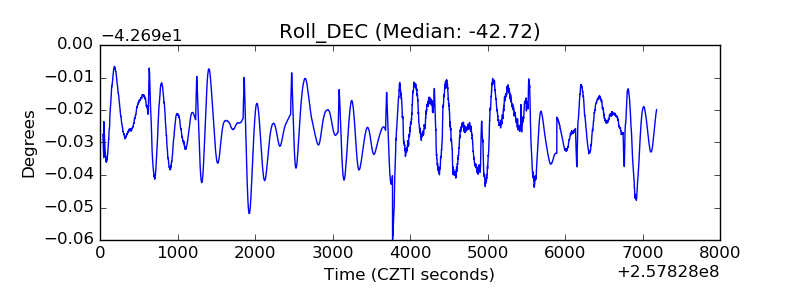 |
| _Roll_RA | 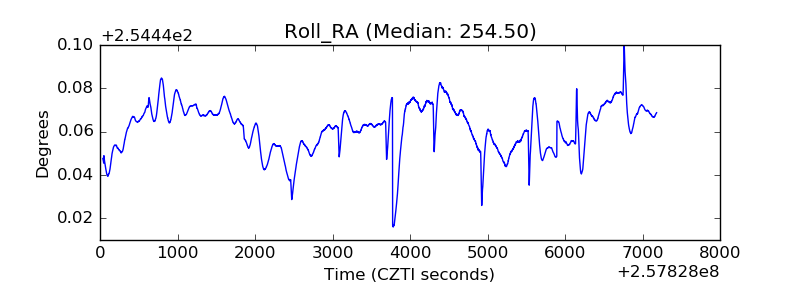 |
| Veto Counter | 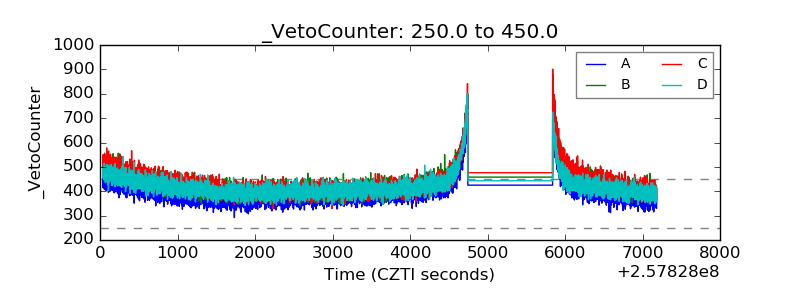 |