| Param | Original file | Final file |
|---|---|---|
| Filename | modeM0/AS1T02_011T01_9000001940_13145cztM0_level2.evt | modeM0/AS1T02_011T01_9000001940_13145cztM0_level2_quad_clean.evt |
| Size (bytes) | 465,926,400 | 92,413,440 |
| Size | 444.3 MB | 88.1 MB |
| Events in quadrant A | 3,239,987 | 589,609 |
| Events in quadrant B | 4,286,076 | 590,559 |
| Events in quadrant C | 3,011,808 | 595,564 |
| Events in quadrant D | 3,126,897 | 565,441 |
| Mode M9 | |||
|---|---|---|---|
| Quadrant | BADHDUFLAG | Total packets | Discarded packets |
| A | 0 | 7 | 0 |
| B | 0 | 7 | 0 |
| C | 0 | 7 | 0 |
| D | 0 | 7 | 0 |
| Mode M0 | |||
|---|---|---|---|
| Quadrant | BADHDUFLAG | Total packets | Discarded packets |
| A | 0 | 13945 | 2 |
| B | 0 | 17096 | 1 |
| C | 0 | 13418 | 1 |
| D | 0 | 13820 | 1 |
| Mode SS | |||
|---|---|---|---|
| Quadrant | BADHDUFLAG | Total packets | Discarded packets |
| A | 0 | 134 | 0 |
| B | 0 | 134 | 0 |
| C | 0 | 134 | 0 |
| D | 0 | 134 | 0 |
| Quadrant | Total seconds | Saturated seconds | Saturation percentage |
|---|---|---|---|
| A | 6556 | 64 | 0.976205% |
| B | 6556 | 453 | 6.909701% |
| C | 6556 | 53 | 0.808420% |
| D | 6556 | 60 | 0.915192% |
Noise dominated data is calculated using 1-second bins in cleaned event files. If a bin has >2000 counts, and if more than 50% of those come from <1% of pixels, then it is considered to be noise-dominated and hence unusable.
| Quadrant | # 1 sec bins | Bins with >0 counts | Bins with >2000 counts | High rate bins dominated by noise | Noise dominated (total time) | Noise dominated (detector-on time) | Marked lightcurve |
|---|---|---|---|---|---|---|---|
| A | 7322 | 6558 | 2 | 2 | 0.03% | 0.03% | 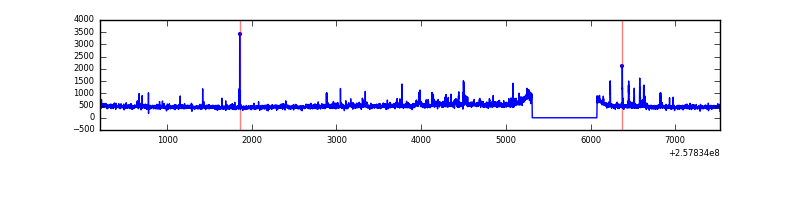 |
| B | 7322 | 6558 | 225 | 225 | 3.07% | 3.43% | 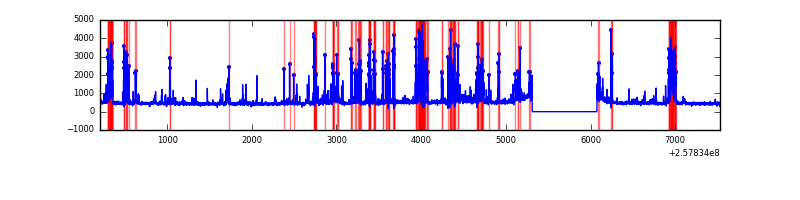 |
| C | 7322 | 6558 | 2 | 2 | 0.03% | 0.03% | 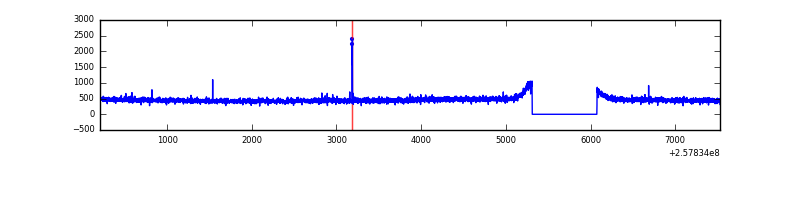 |
| D | 7322 | 6558 | 6 | 6 | 0.08% | 0.09% | 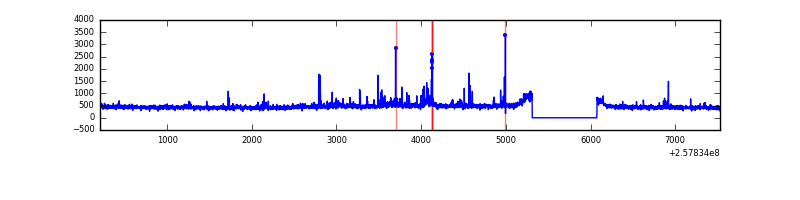 |
Top three noisy pixels from each quadrant. If the there are fewer than three noisy pixels in the level2.evt file, extra rows are filled as -1
| Pixel properties | Quadrant properties | ||||||
|---|---|---|---|---|---|---|---|
| Quadrant | DetID | PixID | Counts | Sigma | Mean | Median | Sigma |
| A | 12 | 189 | 160056 | 1011.77 | 771 | 755 | 157.4 |
| A | 4 | 2 | 66063 | 414.79 | 771 | 755 | 157.4 |
| A | 1 | 162 | 17876 | 108.74 | 771 | 755 | 157.4 |
| B | 4 | 239 | 1140818 | 7974.59 | 753 | 733 | 143.0 |
| B | 0 | 85 | 114710 | 797.24 | 753 | 733 | 143.0 |
| B | 3 | 209 | 21539 | 145.53 | 753 | 733 | 143.0 |
| C | 0 | 207 | 16834 | 90.01 | 766 | 769 | 178.5 |
| C | 13 | 61 | 5472 | 26.35 | 766 | 769 | 178.5 |
| C | 8 | 128 | 4432 | 20.52 | 766 | 769 | 178.5 |
| D | 1 | 52 | 67776 | 366.73 | 757 | 736 | 182.8 |
| D | 5 | 222 | 48978 | 263.9 | 757 | 736 | 182.8 |
| D | 8 | 195 | 43737 | 235.23 | 757 | 736 | 182.8 |
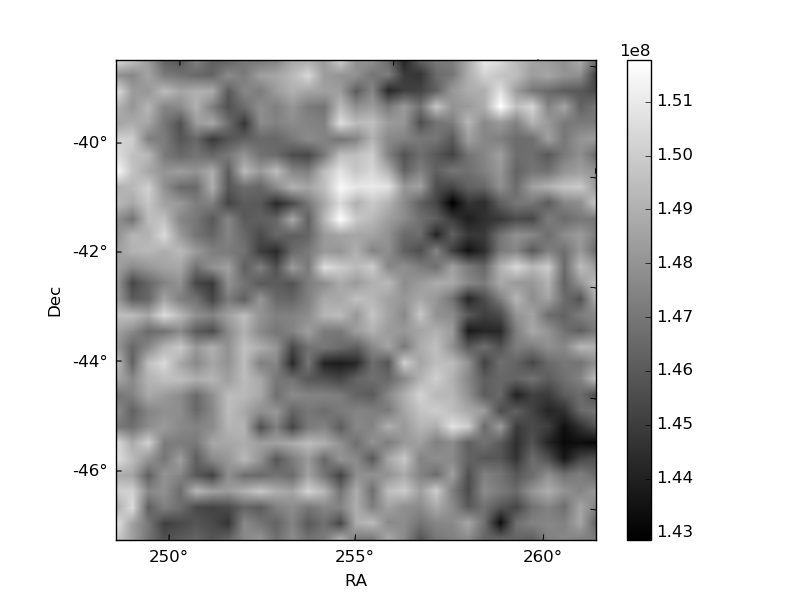
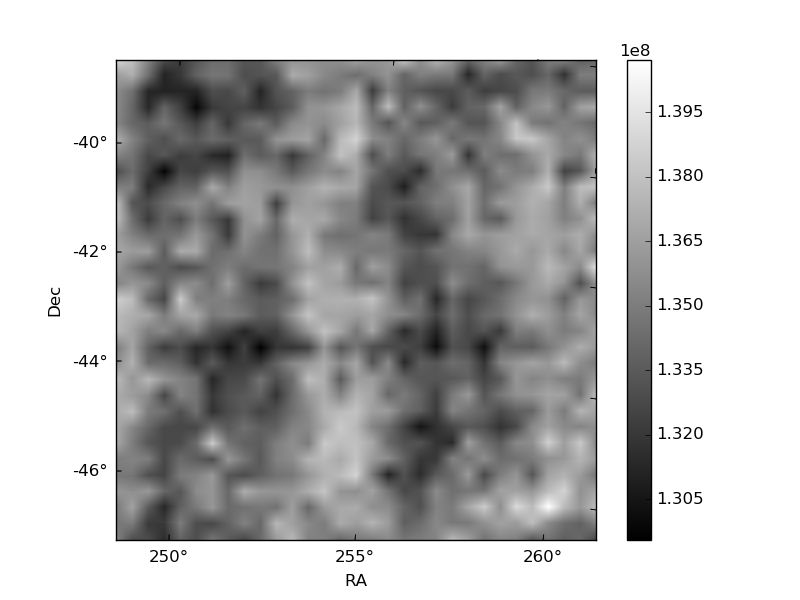
Histogram calculated using DETX and DETY for each event in the final _common_clean file
| Quadrant A | 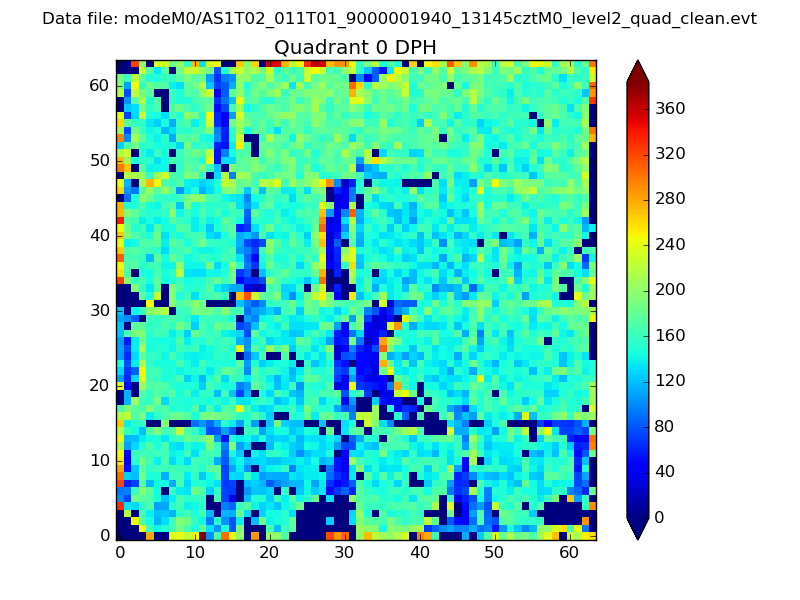 |
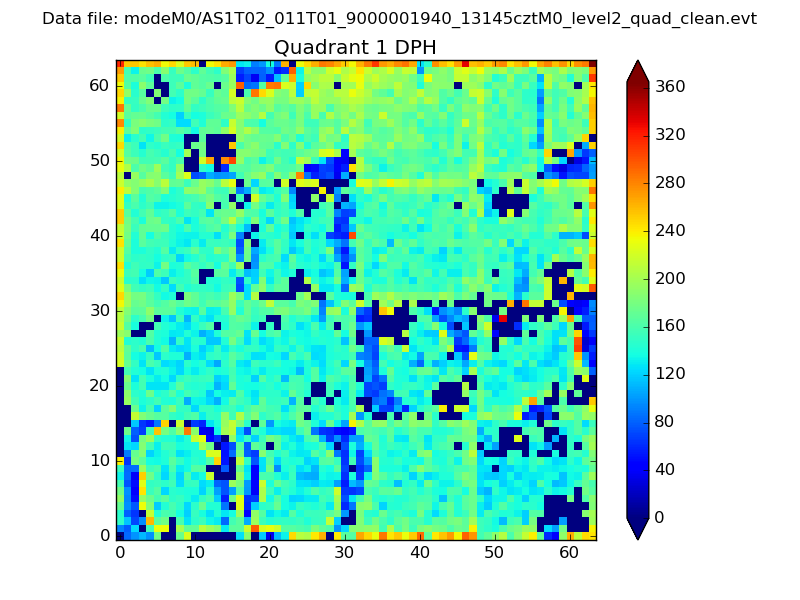 |
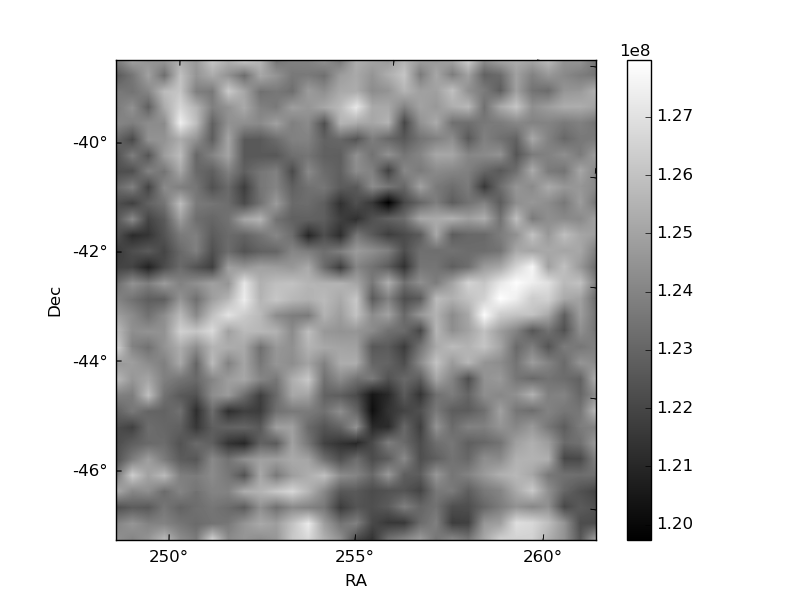
Quadrant B |
|---|---|---|---|
| Quadrant D | 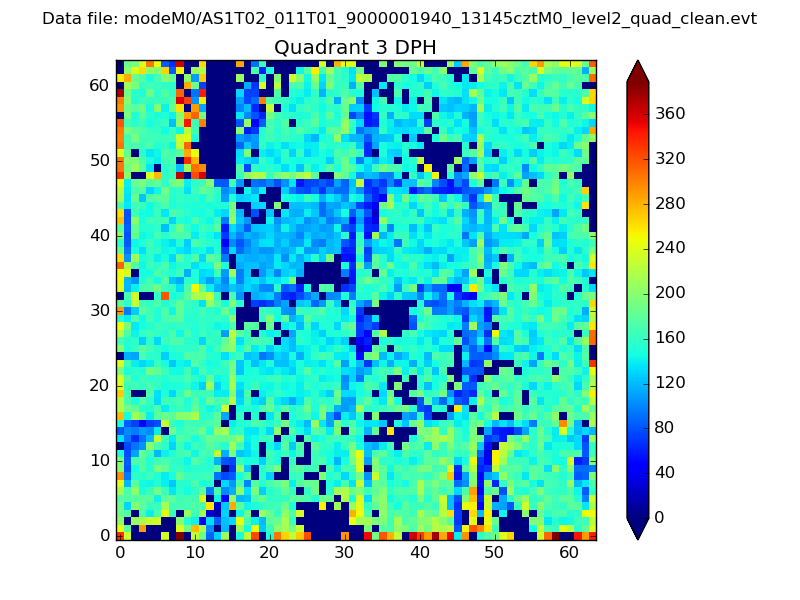 |
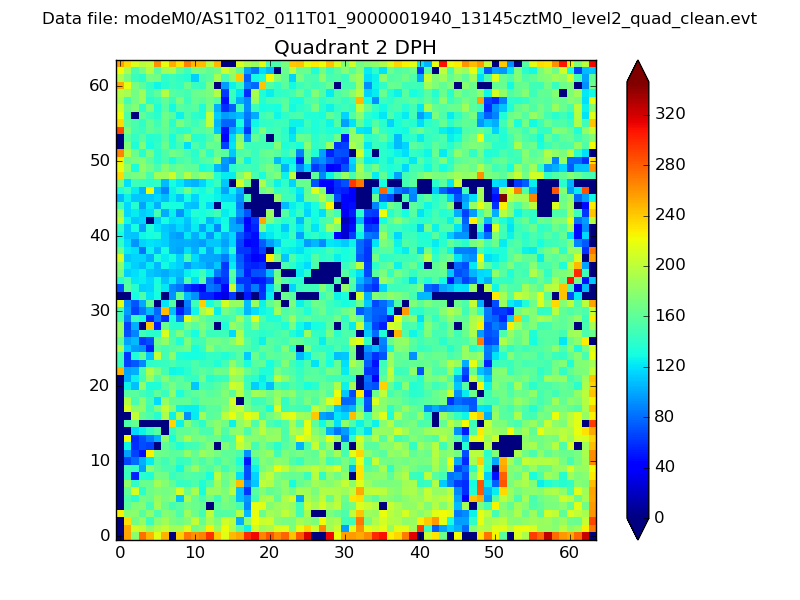 |
Quadrant C |
| Plot type | Count rate plots | Images |
|---|---|---|
| Comparison with Poisson distribution Blue bars denote a histogram of data divided into 1 sec bins. Red curve is a Poisson curve with rate = median count rate of data. |
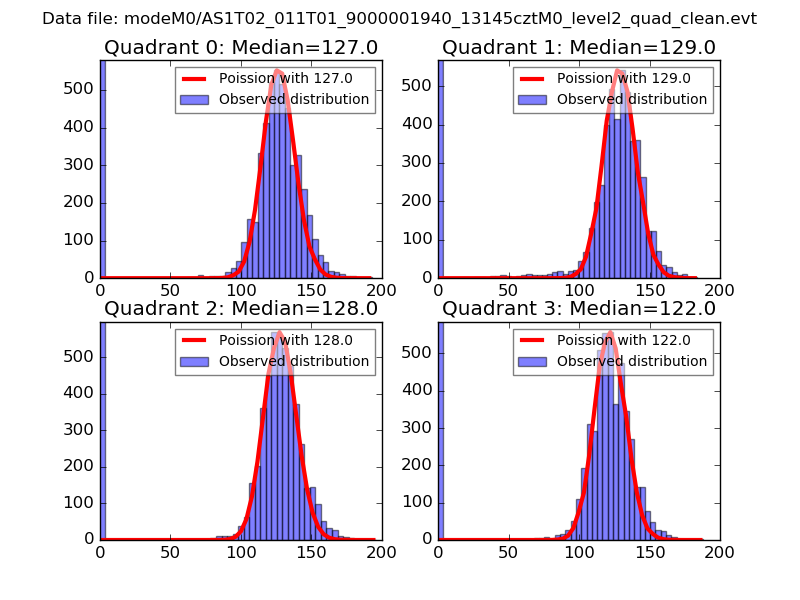 |
 |
| Quadrant-wise count rates Data is divided into 100 sec bins |
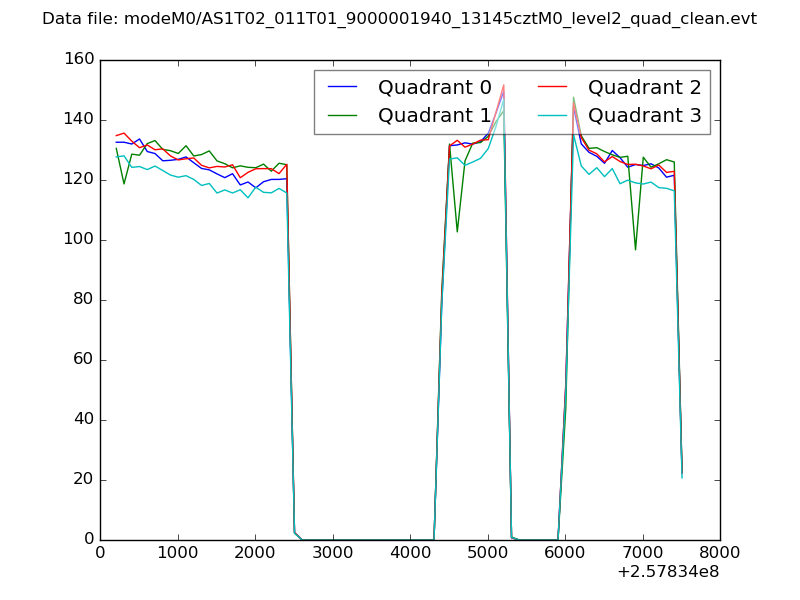 |
|
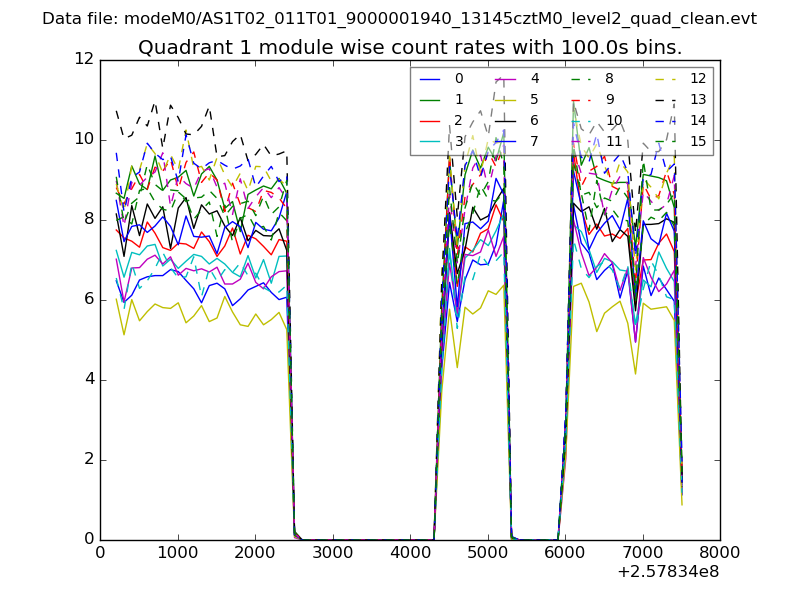
| Module-wise count rates for Quadrant A Data is divided into 100 sec bins |
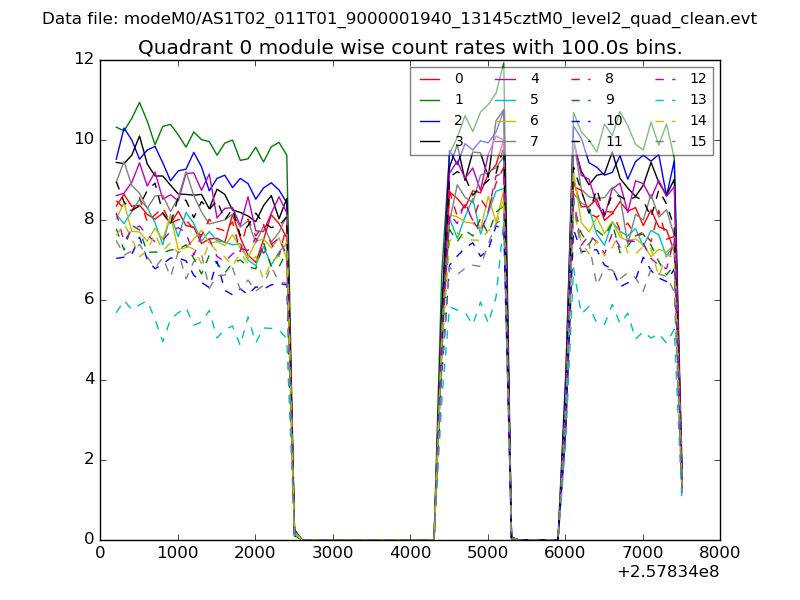 |
 |
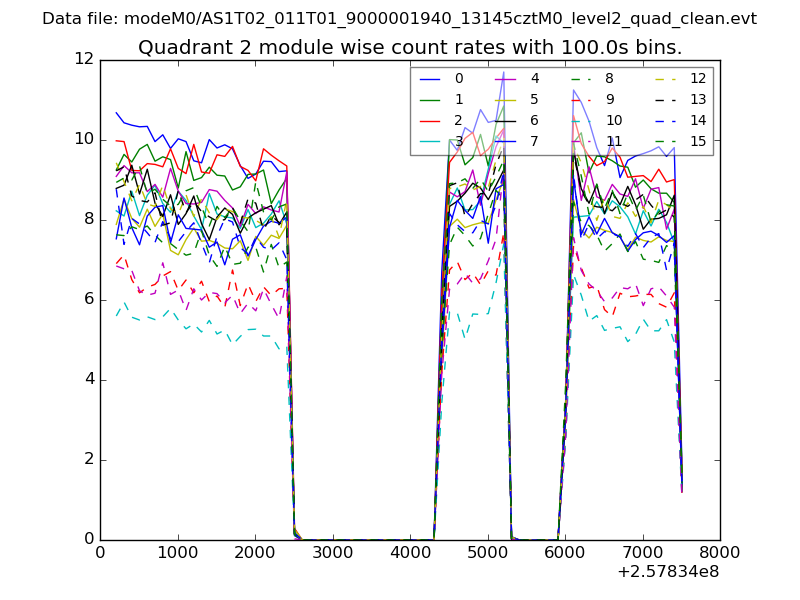
| Module-wise count rates for Quadrant B Data is divided into 100 sec bins |
 |
 |
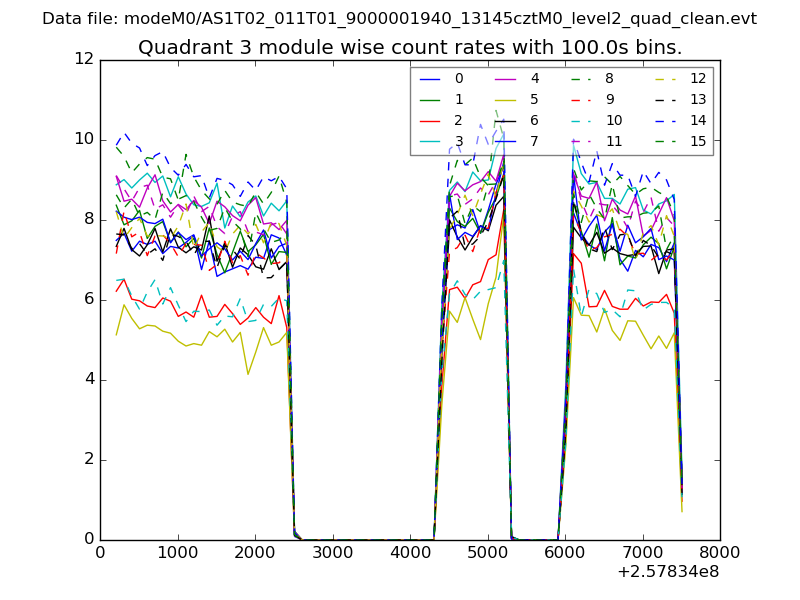
| Module-wise count rates for Quadrant C Data is divided into 100 sec bins |
 |
 |
| Module-wise count rates for Quadrant D Data is divided into 100 sec bins |
 |
 |
| Parameter | Plot |
|---|---|
| CZT HV Monitor | 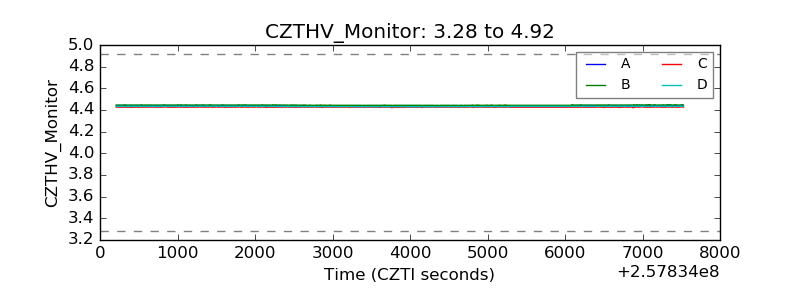 |
| D_VDD | 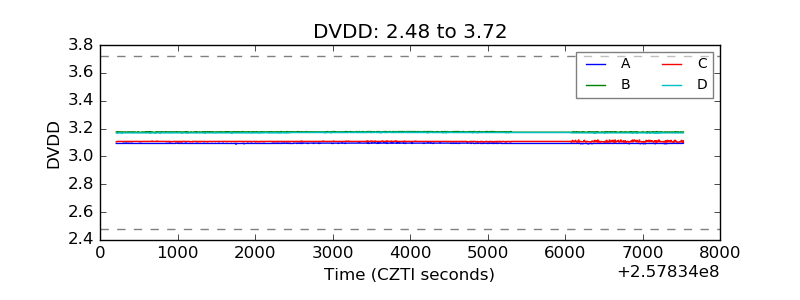 |
| Temperature 1 | 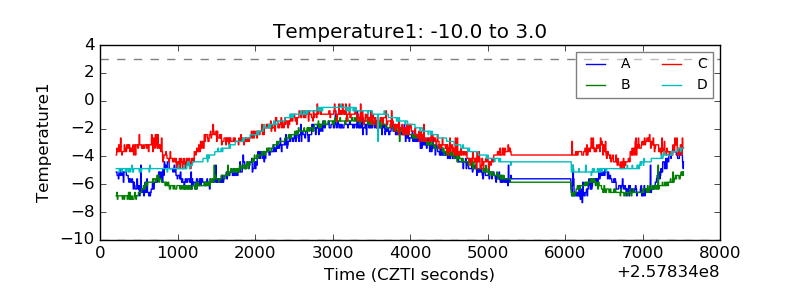 |
| Veto HV Monitor | 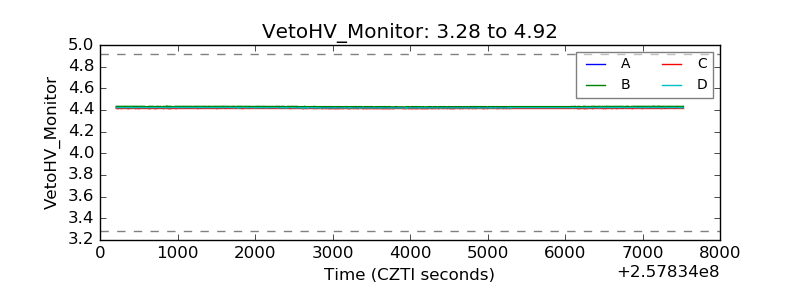 |
| Veto LLD | 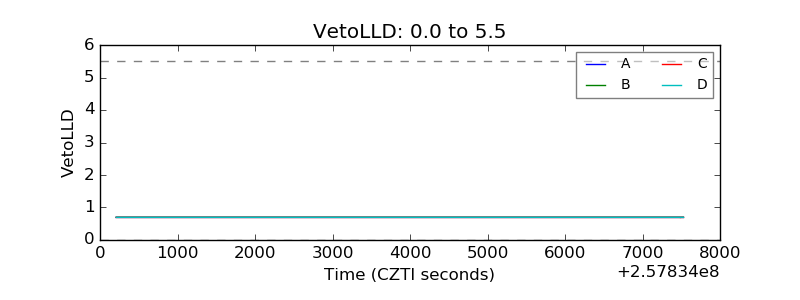 |
| Alpha Counter | 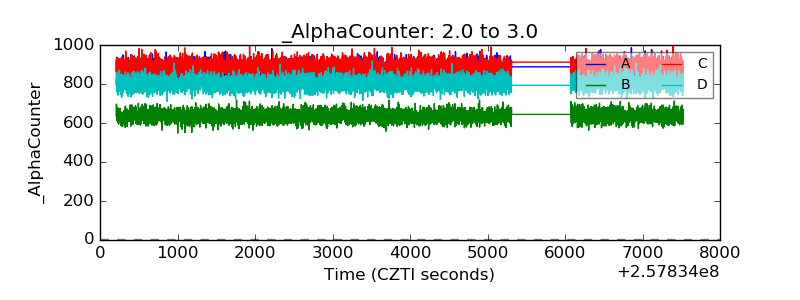 |
| _CPM_Rate | 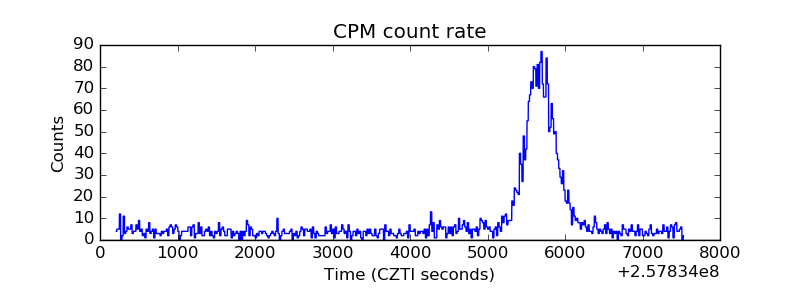 |
| CZT Counter |  |
| +2.5 Volts monitor |  |
| +5 Volts monitor | 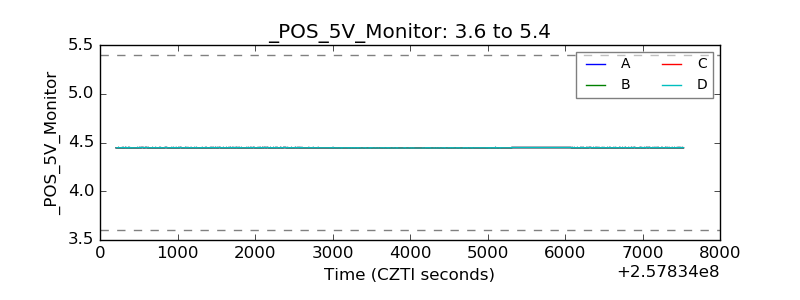 |
| _ROLL_ROT | 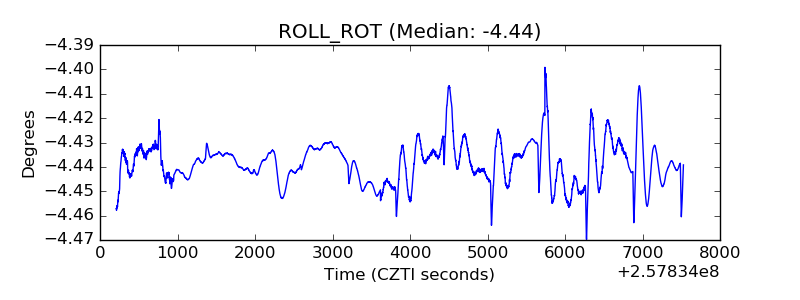 |
| _Roll_DEC | 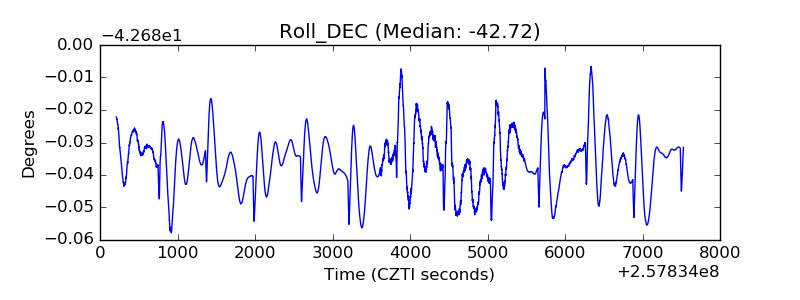 |
| _Roll_RA |  |
| Veto Counter | 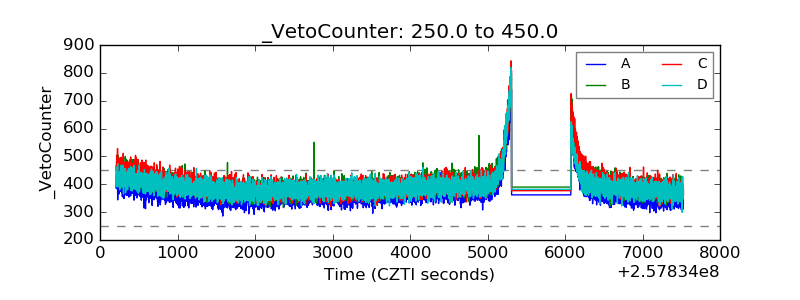 |